Long
Long
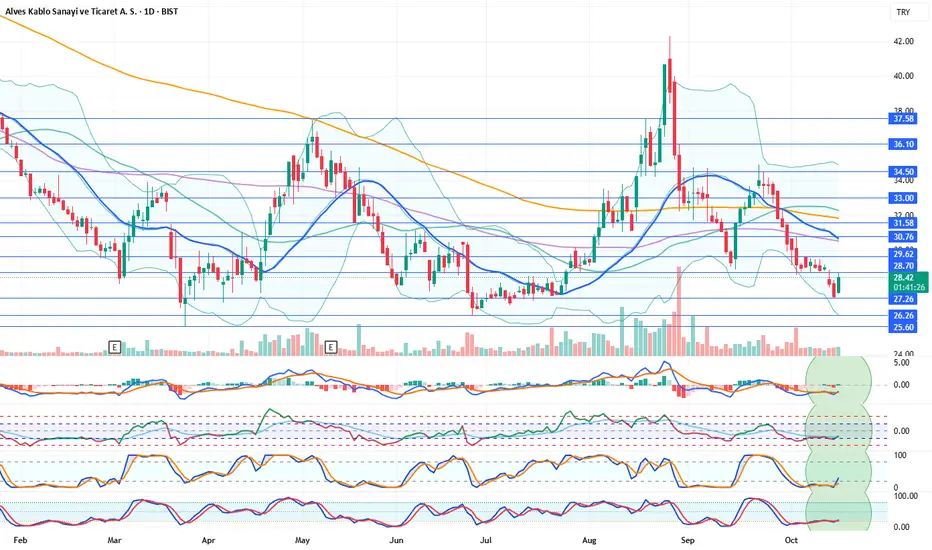
ALVES Stock Analysis & CommentaryALVES Stock Analysis & Commentary
Daily technical indicators are positive. After forming support at 27.26, the stock appears to be recovering from that level. With indicators also showing positive momentum, we believe further recovery may occur. In a potential bullish scenario, the stock could have a chance to test the 21-day moving average (30.68).
Resistance Levels: 28.70 – 29.62 – 30.76 – 31.58
Support Levels: 27.26 – 26.26 – 25.60
We’d appreciate it if you could boost our posts and share them on your social media. 🚀
Legal Disclaimer:
The information, comments, and recommendations contained herein do not constitute investment advice. Investment advisory services are provided only within the framework of an investment advisory agreement to be signed between the investor and authorized institutions such as brokerage firms, portfolio management companies, and non-deposit banks.
The opinions expressed here are personal views and may not be suitable for your financial situation, risk profile, or return preferences. Therefore, no investment decisions should be made based solely on the information and opinions presented on this page.  Long
Long
 Long
Long
Long 
TURSG Stock Analysis CommentaryTURSG Stock Analysis Commentary
Daily technical indicators are positive. The stock has risen above its 21-day moving average (9.22). During the day, it climbed as high as 10.00 TL but failed to hold that level, pulling back below the 9.64 resistance point. With today’s positive movement, the stock has also turned its indicators to the positive side, giving a favorable impression for the coming days. If support continues, it may have another chance to test the 10.00 resistance level. In the medium term, the 10.70 resistance will be monitored.
Resistances: 9.64 – 10.00 – 10.30 – 10.70
Supports: 8.99 – 8.66 – 8.32
We’d appreciate it if you boost our posts and don’t forget to share them on your social media accounts!
Legal Disclaimer:
The information, comments, and recommendations provided here do not constitute investment advice. Investment advisory services are offered only within the framework of an investment advisory agreement to be signed between the investor and authorized institutions such as brokerage firms, portfolio management companies, and non-deposit banks. The opinions expressed on this page reflect personal views only. These views may not be suitable for your financial situation, risk profile, or return preferences. Therefore, investment decisions should not be made based solely on the information and commentary provided here.  Long
Long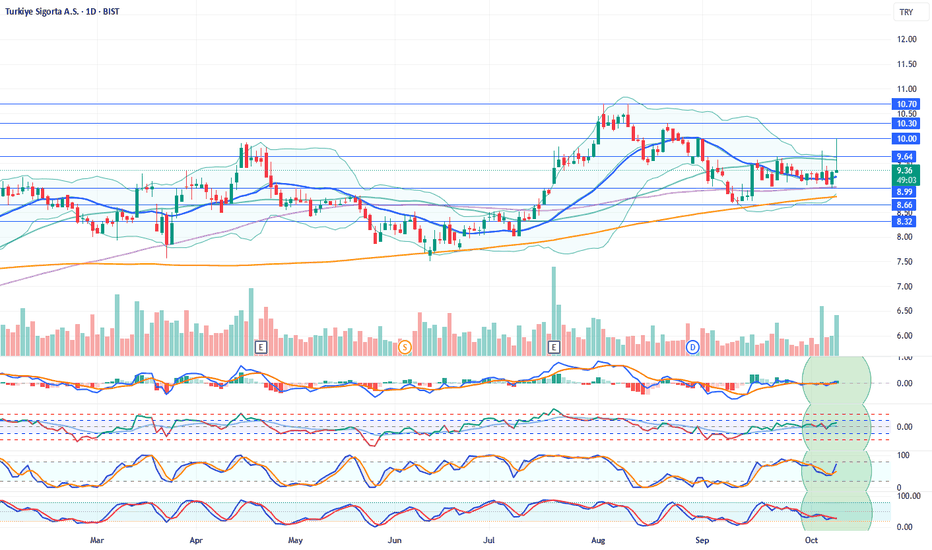
 Long
Long
CLEBI Stock Analysis CommentaryCLEBI Stock Analysis Commentary
Daily technical indicators are positive. The stock is trying to stay above its 21-day moving average (1546). As of this post, we observe positive price movements above the 1554 support level. Volatility has also increased compared to the previous week. Closing the small price gap around the 1600 level could occur in the short term. If the stock manages to remain above the 21-day moving average, resistances at 1652 and higher levels will be the next to watch. With indicators remaining positive, the probability of seeing further upward movement in the stock has increased.
Resistance Levels: 1554 – (1600) – 1652 – 1686 – 1748
Support Levels: 1497 – 1454 – 1430
If you enjoy our analysis, we’d appreciate your support — don’t forget to share it on your social media!
Legal Disclaimer:
The information, comments, and opinions provided here do not constitute investment advice. Investment advisory services are offered under a formal investment advisory agreement between the investor and authorized institutions such as brokerage firms, portfolio management companies, or non-deposit banks. The views expressed here are personal opinions and may not be suitable for your financial situation, risk tolerance, or return preferences. Therefore, no investment decisions should be made based solely on the information provided on this page.  Long
Long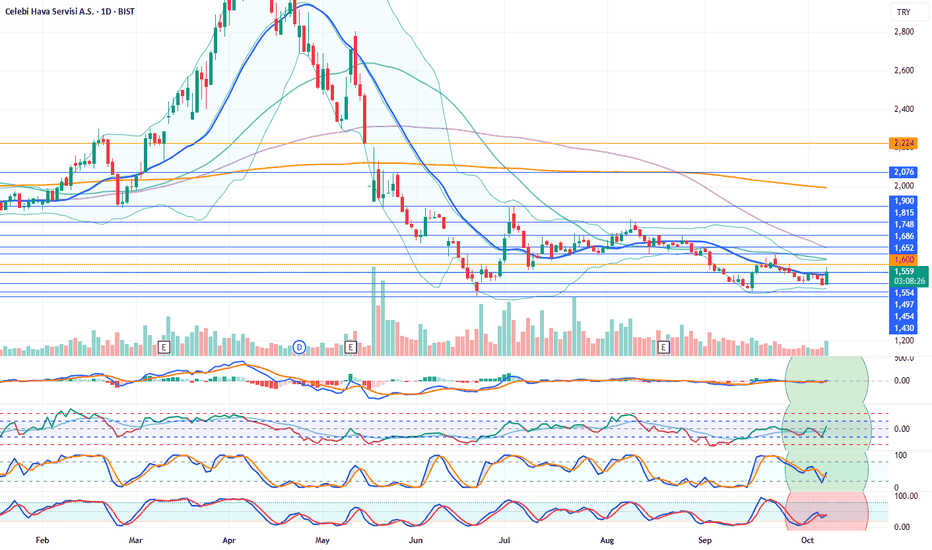
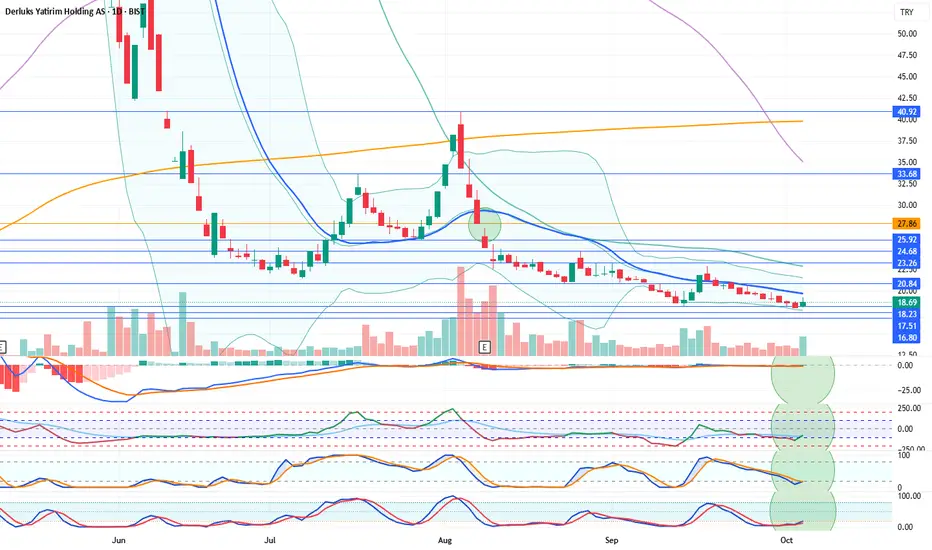
DERHL Stock Analysis CommentaryDERHL Stock Analysis Commentary
Daily technical indicators are positive. After a long break, the stock closed the week on a positive note, turning its indicators upward from the lower levels. If the support continues to hold, the stock may have a chance to break above its 21-day moving average (19.93). On September 16, the stock previously broke this average but failed to hold above it, leading to a long-term decline. Let’s see if this time it can stay above the average and manage to close the price gap at 27.86. For now, positivity seems to have started.
Resistances: 20.84 – 23.26 – 24.68 – 25.92 – (27.86)
Supports: 18.23 – 17.51 – 16.80
We’d appreciate it if you rocket 🚀 our posts and don’t forget to share them on your social accounts.
Legal Disclaimer:
The information, comments, and recommendations provided here do not fall within the scope of investment advisory services. Investment advisory services are offered under an investment advisory agreement to be signed between the client and brokerage firms, portfolio management companies, or non-deposit banks. The content shared on this page reflects only personal opinions. These views may not be suitable for your financial situation, risk profile, or return preferences. Therefore, investment decisions should not be made solely based on the information and writings presented here.  Long
Long
 Long
Long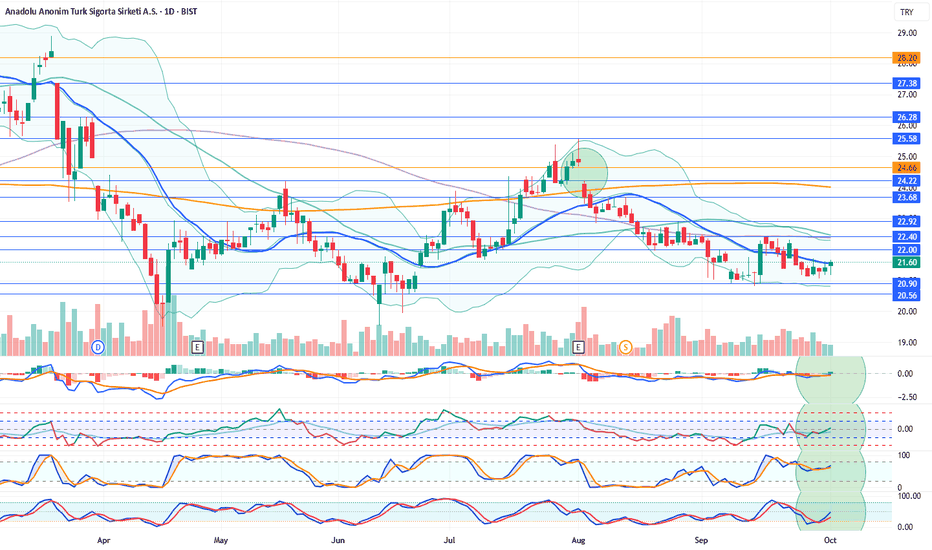
 Long
Long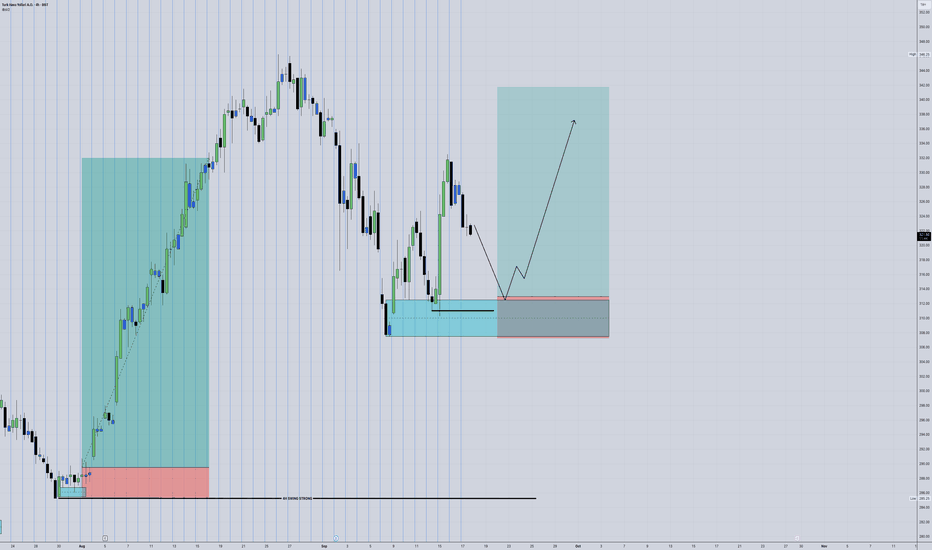
 Long
Long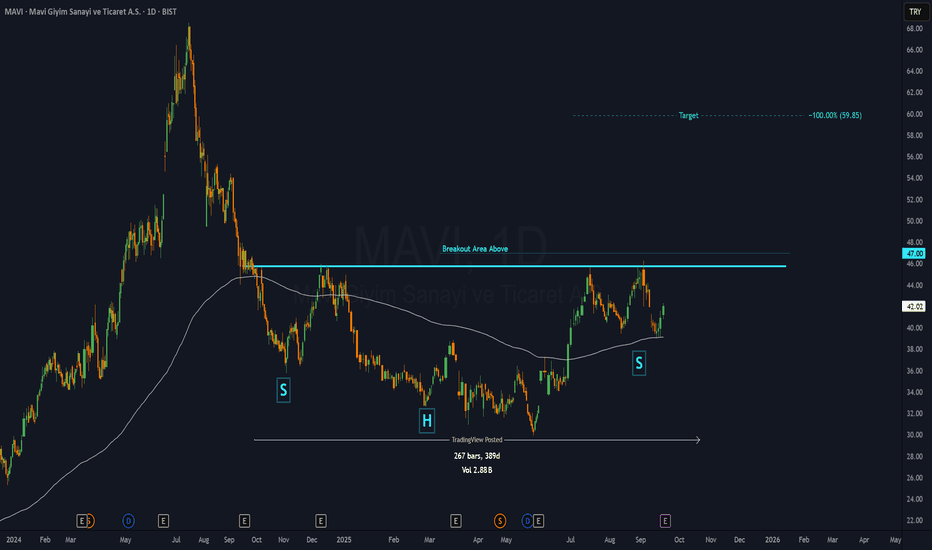
 Short
Short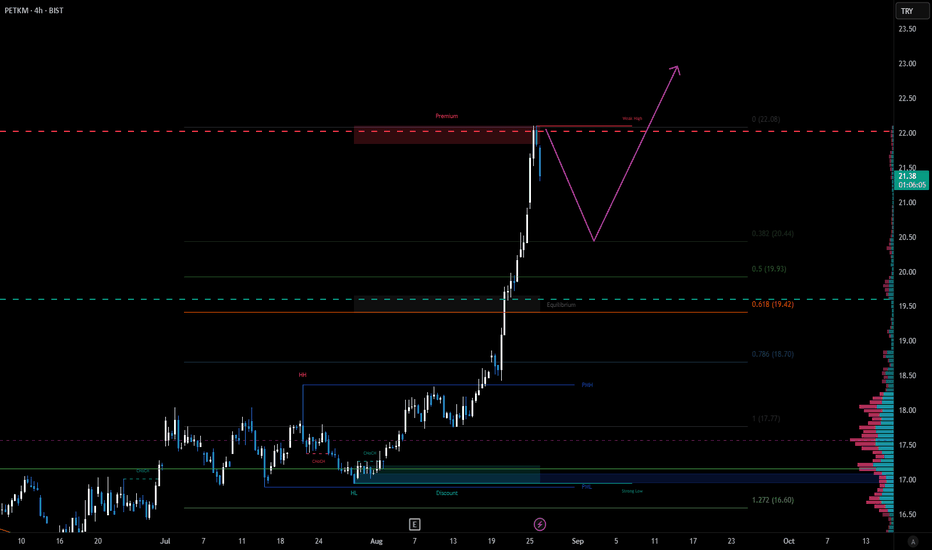
 Long
Long
 Long
Long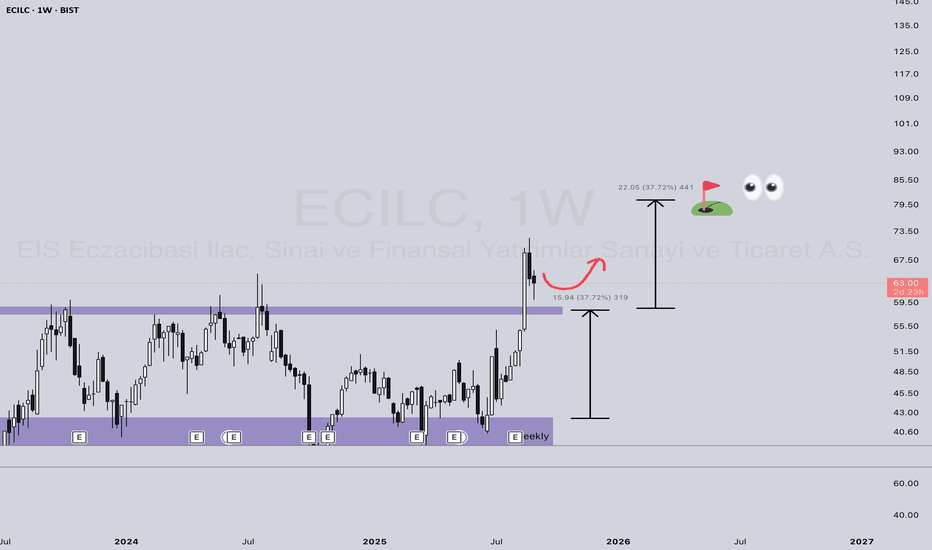
HUNER (1D) — Seller Bias After OB Cluster; Descending BA SlopesHUNER (1D) — Seller Bias After OB Cluster; Descending BA Slopes, 4.00 Support Under Test
Executive read (VPA, 55-bar window)
◉ OB/OS: An OverBought 4/7 tag printed at the apex; no confirmed OS on the right edge. That OB cluster preceded the entire red B→A leg and frames the current risk.
◉ Ranked volume peaks (Top-3):
- B1 (H 4.35/L 4.00) ↑ 68.33M, ↓ 53.3M, Δ +15.03M.
- B2 (H 5.00/L 4.75) ↑ 56.06M, ↓ 44.72M, Δ +11.34M.
- B3 (H 4.71/L 4.39) ↑ 49.81M, ↓ 33.61M, Δ +16.19M.
- S3 (H 4.79/L 4.59) ↑ 41.05M, ↓ 34.1M, Δ +6.95M.
Takeaway: Buying peaks were heavy, but subsequent price action failed to sustain higher highs; sellers have since controlled the B→A leg.
◉ Segment diagnostics:
- C→B advance: top/bottom slopes +22.3° / +21.0° → mature but constructive.
- B→A decline: top/bottom slopes –12.3° / –10.1° → persistent downside pressure.
- Orientation at B: α 212.9° (red) / β 147.1° (red) confirm the bearish state of the current swing geometry.
◉ Levels & structure:
- Support: the S1 low ≈ 4.00 is the active horizontal shelf repeatedly defended.
- Resistance: 4.35 (B1/S1 pivot), 4.71–4.79 (B3/S3 band), then 5.00 (B2). The descending B→A trendline caps bounces before these levels.
Actionable interpretation (educational):
Bias stays bearish-to-neutral while price trades beneath the B→A upper line and below 4.35. A credible shift would require (i) a fresh B-ranked bar with positive Δ near the right edge, and (ii) a close back above the B→A top. Failure to reclaim 4.35 after bounces leaves 4.00 vulnerable; a daily close below 4.00 would validate extension into the S-zones. Conversely, an OS print near 4.00 coupled with flattening BA slopes would set up a tactical mean-reversion toward 4.35 → 4.71/4.79. Seller Strength Evident as Volume Peaks Fail to Propel Price HigAnalysis
Context – This 1D chart uses the ATAI Volume Pressure Analyzer to study the A→B→C structure over the last 11 trading sessions. Segment C→B captures the advance (blue), while B→A captures the subsequent decline (red). Each bar’s up‑ and down‑volume is measured on a lower timeframe to detect buying and selling pressure.
Volume ranking – Within this 11‑bar window, the indicator identifies the three largest buying (B1–B3) and selling (S1–S3) bars. Although the B1 bar shows the highest buying volume (~10.29 M units), its selling volume (~12.52 M) exceeds buying, resulting in a negative delta of ‑2.23 M. B2 is the only buyer bar with a positive delta (+1.87 M), while B3 again shows sellers in control (‑0.90 M). The seller bars S1–S3 all display net negative deltas, with S3 registering the heaviest selling (‑4.03 M). This pattern shows that peaks in buying volume are not producing higher closes and that sellers are consistently overwhelming buyers.
Segment behaviour – The C→B segment (the rally) totals approximately +28.9 M up‑volume versus +36.7 M down‑volume, a net deficit of about ‑7.74 M. The subsequent decline (B→A) is even more one‑sided: +26.9 M up‑volume versus +41.4 M down‑volume, yielding a ‑14.5 M delta. The slopes of the segment trend lines reinforce this narrative: the rise from C to B has a shallow positive slope (~ 5° on the upper line), whereas the decline from B to A has a steeper negative slope (‑12° on the upper line). Sellers are pushing the price lower more aggressively than buyers previously pushed it higher.
Price structure – Price currently trades near TRY 3.45,where resistance resides near the recent pivot highs around TRY 3.65 and TRY 3.73 (where B1 and S1 occur). As long as the price remains below these levels and buying peaks fail to translate into higher highs, the bearish bias remains. The red dashed line is not a fixed support; it dynamically connects the lows of the current C→A leg and updates with each new candle’s low. Its red colour confirms the bearish slope of this segment. As long as this guide remains red and slopes downward, the downtrend is intact. A meaningful sign of shifting momentum would be a flattening or reversal of this guide (e.g., changing colour) accompanied by a new B‑ranked bar that shows a positive delta.
Risk management – This analysis is provided for educational purposes and does not constitute investment advice. Always consider your own risk tolerance and trading plan before entering a position.  Short
Short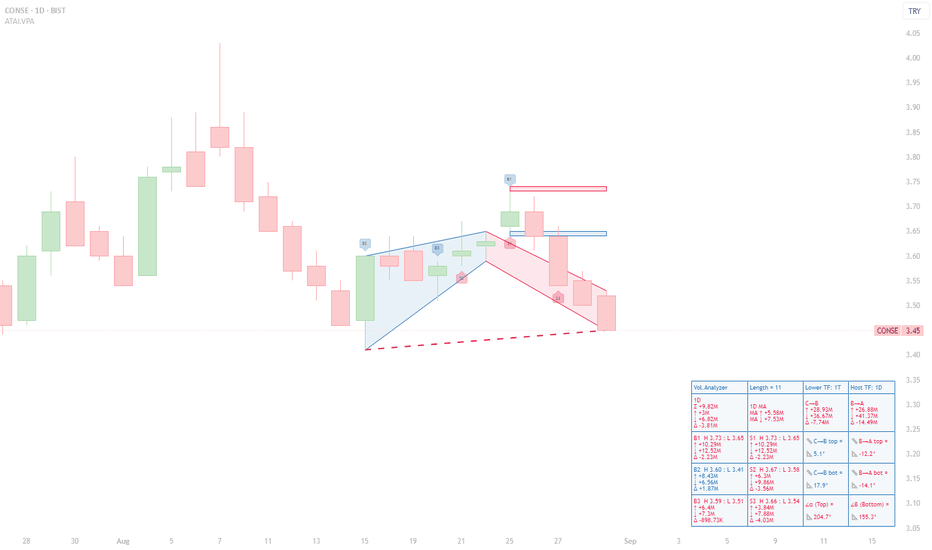
 Long
Long
Volume and Structural Analysis of THYAO — Reaching Resistance at📝 Analysis:
My initial focus in this chart was on the daily buy and sell volumes.
According to the table displayed at the bottom of the chart for August 6th:
Buy Volume (t-0): 46.305M
Sell Volume (t-0): 24.566M
These values show a clear increase compared to previous checkpoints (t-13 and t-26).
Notably, the buy volume is 28.3M higher than t-13 and about 1.6M higher than t-26.
This gives us a broader picture: buying strength remains dominant, even though delta volume has not surpassed its value at t-26 (still about 7M short). Nevertheless, the current volume levels show stronger positioning compared to the mid-term past.
On the upper-right side of the chart, four system-based scenarios have been triggered via our custom indicator:
✅ Scenario 01 – Buyer Power Convergence with Price
✅ Scenario 08 – Seller Weakness Divergence
✅ Scenario 09 – Bullish Volume Pressure
✅ Scenario 11 – Volume Dominance Bullish
Together, they present a market that is tilting in favor of the buyers, with bullish sentiment supported by volume structure.
Next, my attention shifts to the triangle formations on the chart, which were automatically plotted based on cross high/low logic.
🔺 The green ascending triangle, with a slope of 20.65°, indicates a healthy and steady bullish structure.
Its top has not yet reached the resistance zone, where the red triangle forms a descending structure aligned with the R4 level at 314.25.
Beyond the technical interpretation, I also look at triangles symbolically.
Throughout history, from the Seal of Solomon (Star of David) to the Egyptian pyramids, triangles have represented stability, energy focus, and a path upward.
In this chart, that symbolism holds true — the green triangle embodies a progressive, rising support, while the red triangle offers a calculated obstacle.
What’s intriguing is the parallel structure of the triangle bases — suggesting a balanced energy field, ready to be tipped by momentum.
📊 When combined with other indicators:
Price is above the red Ichimoku cloud
It sits in the upper zone of the regression channel
Bollinger Bands show an upward breakout bias
Daily pivot levels align with this structure, and the R4 level (314.25) becomes a relevant resistance to monitor
📍 Conclusion:
Given the alignment of structural elements and volume behavior,
a move toward the resistance at 314.25 is well within reach under current market dynamics.
⚠️ This analysis is based on a custom-built indicator named Volume Based Analysis V 1.4+ and is provided strictly for educational and analytical purposes.
No investment or trading advice is intended.
👥 I welcome your interpretations and experiences —
Do you also see 314.25 as a realistic target?  Long
Long
 Long
Long