AMBER ENTERPRISES | Positional Trade SetupTechnical View
AMBER is trading within a well-defined Ascending Triangle, supported by a series of higher lows and a strong horizontal resistance zone. The price has repeatedly respected the rising support trendline, indicating sustained buying interest despite short-term corrections.
The current consolidation appears constructive. A decisive breakout above the resistance zone may trigger the next leg of the uptrend.
Trade Setup
CMP: ₹7,484
Add on Dips: Around ₹7,200
Stop Loss (Closing Basis): ₹6,989
Target Levels
🎯 Target 1: ₹8,228
🎯 Target 2: ₹8,666
🎯 Target 3: ₹8,888
🎯 Target 4: ₹9,111
🎯 Target 5: ₹9,333
🎯 Target 6: ₹9,666
Trading Strategy
* Fresh positions may be considered around the current market price.
* Additional accumulation may be considered near ₹7,200 if the stock witnesses healthy corrective moves.
* Maintain a strict Closing Basis Stop Loss at ₹6,989.
* Consider partial profit booking at successive targets while trailing the stop loss (TSL) to protect gains.
Technical Highlight
* Pattern: Ascending Triangle
* Trend: Bullish
* Support: Rising Trendline
* Resistance: ₹8,228 Zone
* Time Horizon: Positional (Medium Term)
Disclosure: This technical view is based on price action and chart analysis. The analysis reflects the current market structure and is subject to change based on evolving market conditions. There are no guaranteed returns in the stock market. Investors should assess their risk profile and follow appropriate risk management before making any investment decisions.
 Long
Long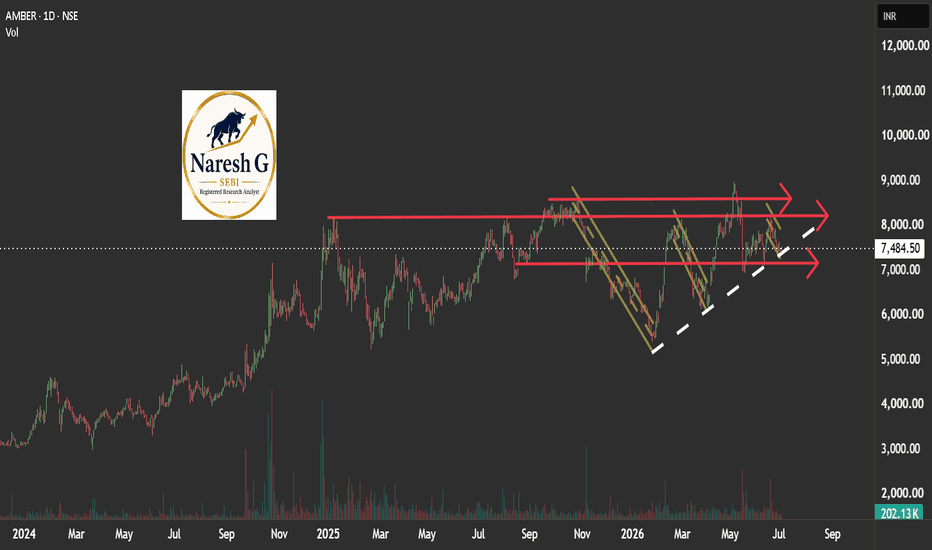
You Found the X. But How Big Is the Canvas?The Trap of Looking at One Timeframe
It does not matter how clean the setup looks. It does not matter if the market structure on the daily is textbook perfect, higher highs, higher lows, clean breakouts, a beautiful EMA crossover. None of that context matters in isolation if you have not asked one simple question first.
Where is this on the bigger canvas?
What the Daily Shows
The daily chart tells a confident story. Market structure is healthy. Higher lows are forming. Maybe a breakout has occurred. Maybe the EMAs have crossed in the right direction. From this lens, everything looks constructive. A trader looking only here would feel justified in their read.
What the 6 Month Reveals
Switch to the left side of this post. The monthly chart. Zoom out and suddenly the same price area that looked like open space on the daily is sitting directly beneath a major counter trendline. Or inside a symmetrical triangle pattern that has been compressing for years. Or approaching a resistance zone that has rejected price multiple times across a decade.
The X that looked like opportunity on the daily is sitting at the edge of a wall on the monthly. Same price. Completely different story depending on which canvas you are reading it from.
The Multi Timeframe Habit
This is not about ignoring the daily. It is not about only trading the monthly. It is about making sure that whatever you observe on your working timeframe, you have visited the higher timeframe first to understand the location of that observation within the broader structure.
Disclaimer: This post is purely educational and observational in nature based on historical price action across multiple timeframes. It does not constitute financial advice, a forecast, or a recommendation to buy, sell, or hold any security. Multi timeframe analysis is a personal observational approach and does not guarantee future price behavior.  Long
Long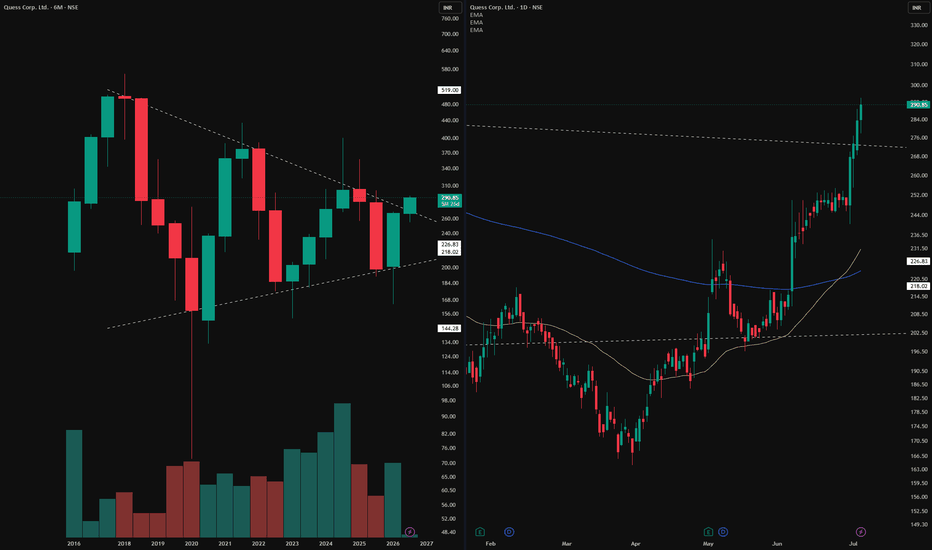
Hyper-Squeeze at 58000 [Analysis For 06.07.2026: Monday]Probable Price Structure Analysis of Nifty Bank for the 06th of July, 2026. The day is Monday.
Chart Pattern: Symmetric Triangle.
Presently, Nifty Bank is stuck in a tight range. It has formed a symmetric triangle. Only a breakout or breakdown would offer trend clarity. The index is under a hyper-squeeze zone.
🟢 Bullish Scenario
Be bullish only if the price sustains above the level of 58250 for at least 30 minutes. The probable bullish targets above the level of 58250 would be - 58375, 58500, 58625, and 58750.
🔴 Bearish Scenario
Be bearish only if the price sustains below the level of 57750 for at least 30 minutes. The probable bearish targets below the level of 57750 would be - 57625, 57500, 57375, and 57250.
🟡 No Trading Zone (NTZ): (58250 - 57750) .
Presently, the price is in the NTZ. We have to wait for a breakout or breakdown from the NTZ for trend clarity. Here, the zone of (58250 - 58125) is a strong resistance zone, and the zone of (57875 - 57750) is a strong support.
⏺ Range of Consolidation (ROC): (58500 - 57500).
Here, 58000 is the median of ROC. The median works like a sentiment. The price trading above the median would offer bullish sentiment, while the price trading below the median would trigger bearish sentiment.
● Event
This week (06th to 10th July), there is one high-impact event (the U.S. FOMC minutes). The event is on Wednesday, 08th of July. So, we have to deal with two weekly expiries and one high-impact event.
● Intraday Bias
Establish intraday bias with respect to the opening price. If the price sustains above the opening price, then don't think of shorting. Look for bullish trades only. On the contrary, if the price sustains below the opening price, then don't think of going long. Look for bearish trades in that case.
● Disclaimer + End Note
- All the analyses would fail in the case of a major gap up, gap down, or price structure anomaly. Thus, practice PRAGMATISM in the live session.
- Trade only if there is a set-up. Remember, not trading is an extension of the trading activity.
- Mark your points. Trade your points. Price is GOD. Anything can happen in the markets. Thus, trade what you see, not what you believe.
- Always PRACTICE RISK MANAGEMENT. Always PROTECT YOUR CAPITAL. Be RESPONSIBLE.
- Be Strategic. Be Courageous. Be Patient. Be Wise.
- Every day is a new day. Thus, do not carry the baggage of past successes or failures. Leave the gardens of winning and losing. Establish yourself in equanimity. Always think from a new perspective.
- Let the joy of trading drive your effectiveness, not greed or fear. Believe in Possibilities.
Happy Trading! DR REDDY'S | Ascending Triangle — Watch ₹1,415 BreakoutOverview
Dr. Reddy's Laboratories — one of India's leading pharmaceutical companies — is forming a well-defined Ascending Triangle on the Daily chart. Today's strong +2.11% session pushed price to ₹1,390, approaching the key resistance at ₹1,415, before closing at ₹1,374. The triangle structure remains intact and the breakout zone is approaching.
The Ascending Triangle
An Ascending Triangle forms when price makes higher lows (rising trendline below) while repeatedly testing a flat horizontal resistance above. This pattern signals accumulation — buyers are consistently stepping in at higher levels, pushing price toward the resistance ceiling.
Upper Boundary: Flat resistance at ₹1,415 — tested multiple times since 2024. Sellers have defended this level consistently. This is the key breakout trigger.
Lower Boundary: Rising trendline support connecting the lows from April 2025 through February 2026 — confirming buyers are making higher lows over time.
Today's Price Action — Why This Setup is Timely
Today's +2.11% session saw Dr. Reddy's rally to ₹1,390 — approaching but not yet breaking the ₹1,415 resistance. Price closed at ₹1,374, consolidating within the triangle structure. The ascending triangle remains fully intact.
The stock is in the compression zone — the narrowing space between rising support and flat resistance — where the next directional move is building energy.
The EMA Context
📈 50 EMA at ₹1,300 — price trading well above, confirming medium-term bullish momentum.
📈 200 EMA at ₹1,273 — price above the 200 EMA, confirming the long-term trend remains bullish.
Both EMAs are positioned as support layers below — adding depth to the bullish structure.
Key Levels
🔴 Triangle Upper Resistance — 1,415 (breakout trigger)
🟡 Current Price — 1,374 (inside triangle)
🟢 50 EMA Support — 1,300
🟢 200 EMA Support — 1,273
🟢 Rising Trendline Support — dynamic, rising from April 2025 lows
🎯 Measured Move Target — 1,820 (triangle height ₹400 projected from breakout at 1,415)
🔴 Invalidation — close below rising trendline
Two Scenarios
🟢 Scenario A — Breakout Confirms
Price breaks above ₹1,415 on a daily close with good volume. This confirms the Ascending Triangle breakout. First interim target is ₹1,600+, with a measured move target of ₹1,820 (triangle height of ~₹400 projected upward from the breakout level).
🔴 Scenario B — Resistance Holds, Pullback
Price fails to break above ₹1,415 and pulls back toward the rising trendline support. The triangle structure remains valid as long as price holds above the rising trendline. A close below the trendline would invalidate the pattern — watch the 50 EMA at ₹1,300 as the next support.
Beginner's Lesson — What is an Ascending Triangle?
An Ascending Triangle tells a story of shifting power from sellers to buyers:
The flat resistance shows sellers defending the same price level repeatedly
The rising trendline shows buyers becoming more aggressive — unwilling to wait for lower prices
As the two lines converge, pressure builds inside the pattern
Eventually buyers overwhelm sellers — and the breakout happens
The key insight: the pattern is bullish not because of the breakout, but because of the higher lows forming before it. Each higher low is a sign buyers are getting stronger.
Always wait for a confirmed daily close above ₹1,415 before acting — not just an intraday breach.
Conclusion
Dr. Reddy's is forming a clean Ascending Triangle on the Daily chart. The upper resistance at ₹1,415 is the key level — multiple tests, multiple rejections. But the rising trendline below shows buyers getting stronger with each pullback.
Watch for a daily close above ₹1,415 with volume — that is the confirmation signal.
For educational purposes only. Not financial advice. Always manage your risk.  Long
Long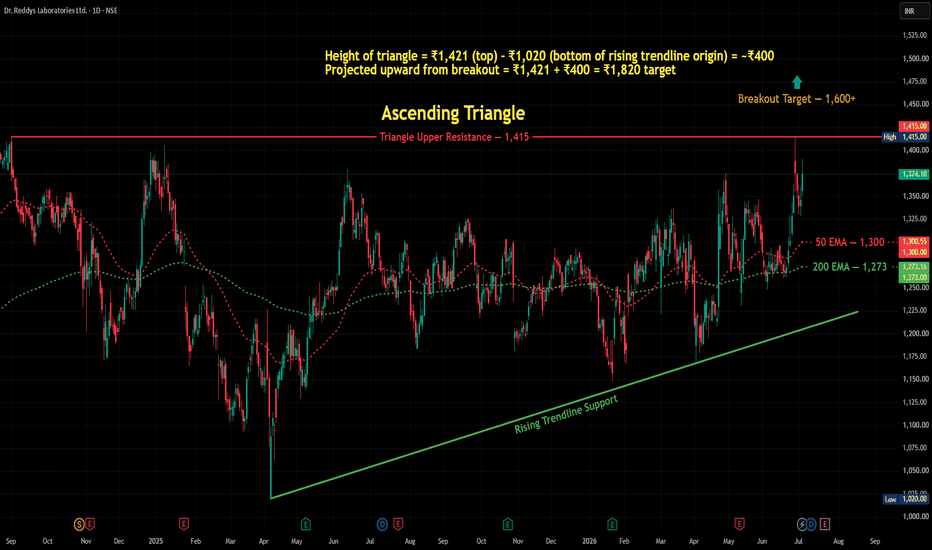
INDUSINDBK Ascending Triangle Breakout & 52-Week High📊 IndusInd Bank: Daily Technical Snapshot – Ascending Triangle Breakout & 52-Week High
📊 STWP Technical Analysis
________________________________________
MARKET STRUCTURE SNAPSHOT | NSE: INDUSINDBK | DAILY
Closing Price: 974.35 (+30.85 | +3.27%)
Core Trend: Strong Uptrend
Market State: Confirmed Breakout in Progress
Price Structure: Price has broken above an Ascending Triangle and is trading near a fresh 52-week high, indicating continued bullish strength.
________________________________________
OPERATIONAL PRICE GRID & KEY REFERENCE LEVELS
Model Reference Level: 978.40
Hard Invalidation Level: 879.45
Structural Risk: 98.95 (10.11%)
Resistance Levels: R1 987.80 | R2 1,001.25 | R3 1,024.10
Support Levels: S1 951.50 | S2 928.65 | S3 915.20
Range Structure: Immediate Trading Range 879.45 – 1,024.10
Higher Timeframe Observation: Sustained acceptance above 988–1,001 may strengthen the trend towards the 1,024 region.
________________________________________
MOMENTUM, PARTICIPATION & CPR DATA
Volume Profile: 3.82 Million Shares
Volume Character: High Relative Participation
RSI: 64.59 (Strong Momentum Zone)
ADX: 21.61 (Trend Development Phase)
ROC: +3.79%
MACD: Strong Positive Momentum Structure
CCI: +128.27 (Strong Bullish Momentum)
Stochastic: 94.82 (Extended Momentum Zone)
Current Bias: BUY ON PULLBACKS
CPR State: Bullish Zone | Wide Projected CPR
Today's CPR: Pivot 940.00 | Top 941.75 | Base 938.25
Tomorrow's Projected CPR: Pivot 964.95 | Top 969.65 | Base 960.25
________________________________________
📚 EDUCATIONAL OBSERVATION
IndusInd Bank has delivered a strong bullish breakout by moving above an Ascending Triangle, a continuation pattern that typically reflects sustained buying interest after a period of consolidation. The breakout is further reinforced by a move towards a fresh 52-week high, indicating improving market sentiment and strengthening price structure.
The pattern is characterised by a series of higher lows, reflecting increasing buyer aggression, while repeated tests of the horizontal resistance eventually resulted in a decisive breakout. Such formations often indicate that demand has gradually absorbed available supply before prices expand higher.
Several technical factors are currently aligned in support of the prevailing trend:
Ascending Triangle Breakout
52-Week Breakout
Strong Bullish Candle
RSI Breakout
Bollinger Band Expansion
Strong Price-Volume Confirmation
Buyers' Dominance
Relative Strength Outperforming NIFTY
Momentum indicators continue to paint a constructive picture. The RSI at 64.59 reflects healthy bullish momentum without entering an extreme overbought condition. MACD remains firmly positive, while ADX at 21.61 suggests that the emerging trend is gaining strength. CCI at +128.27 highlights strong upside momentum, and the Stochastic reading of 94.82 confirms sustained buying pressure, although it also indicates that short-term pullbacks remain possible following a sharp advance.
The projected Central Pivot Range (CPR) for the next trading session has shifted higher, with the Pivot projected at 964.95. A rising and wide CPR generally indicates improving market acceptance of higher prices and often supports trend continuation when accompanied by healthy participation.
Immediate attention remains focused on the resistance zone between 988 and 1,001. A sustained move above this region could strengthen the existing bullish structure and bring the 1,024 area into focus for future market structure analysis. On the downside, 951.50 serves as the first important support, while the structural invalidation level remains at 879.45.
From a business perspective, IndusInd Bank is one of India's leading private sector banks, offering retail banking, corporate banking, vehicle finance, microfinance, treasury operations and digital banking services. Continued improvement in asset quality, steady credit growth and increasing digital adoption remain supportive factors for the bank's long-term business outlook.
Support and resistance levels should be viewed as observation zones rather than predictive targets. Chart patterns, price action, volume analysis, momentum indicators and CPR are educational tools intended to help market participants understand evolving market structure within a disciplined risk-management framework.
________________________________________
⚠️ Disclaimer
This analysis is provided strictly for educational and informational purposes.
It does not constitute financial, investment or trading advice and should not be interpreted as a recommendation to buy or sell any security.
Investments in the stock market are subject to market risks, including the possible loss of capital.
Historical performance, chart patterns and technical indicators do not guarantee future results.
Please conduct your own research and consult a SEBI-registered investment adviser before making investment decisions.
STWP assumes no responsibility or liability for any financial loss arising directly or indirectly from the use of this analysis.
 Long
Long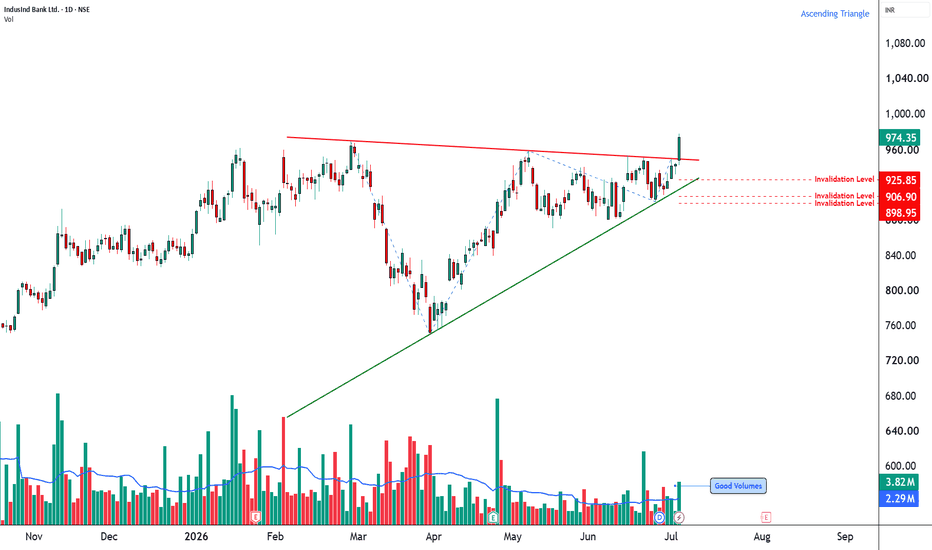
 Long
Long
Reading the Language of StagesMarkets don't move in straight lines. They rally, they rest, they rally again
Stage One: The Ascending Triangle and The Supply Zone
Marked in red is the supply zone, a ceiling the stock kept running into and failing at. Below it, an ascending triangle quietly formed: rising lows pressing up against that flat resistance, each push a little more deliberate than the last.
Now here's the honest part: ascending triangles give horizontal breakouts, and horizontal breakouts fail more often than they succeed. Roughly 30% of the time they do follow through with real momentum, and this was one of those times. Not the rule. The exception, the green trendlines drawn at a slightly steeper angle show something important: as the pattern matured, the angle of buying pressure was increasing.
Stage Two: The Rally
Once the breakout held and price sustained above the supply zone, flipping it from resistance into support, the stock entered its second stage. A clean, sustained rally. No complex reading needed here. Price simply did what price does after a long base finally gives way. It moved.
Stage Three: The Descending Parallel Channel
After the rally ran its course, the stock entered consolidation again, this time in the form of a down-trending parallel channel marked with white dotted lines. Lower highs, lower lows, contained within two parallel descending boundaries. This isn't necessarily a bearish signal in isolation. Within the context of a larger uptrend, a descending channel is often simply the market's way of digesting gains.
Disclaimer: This post is purely educational and observational in nature, based on historical price action on a monthly timeframe. It does not constitute financial advice, a forecast, or a recommendation to buy, sell, or hold any security.  Long
Long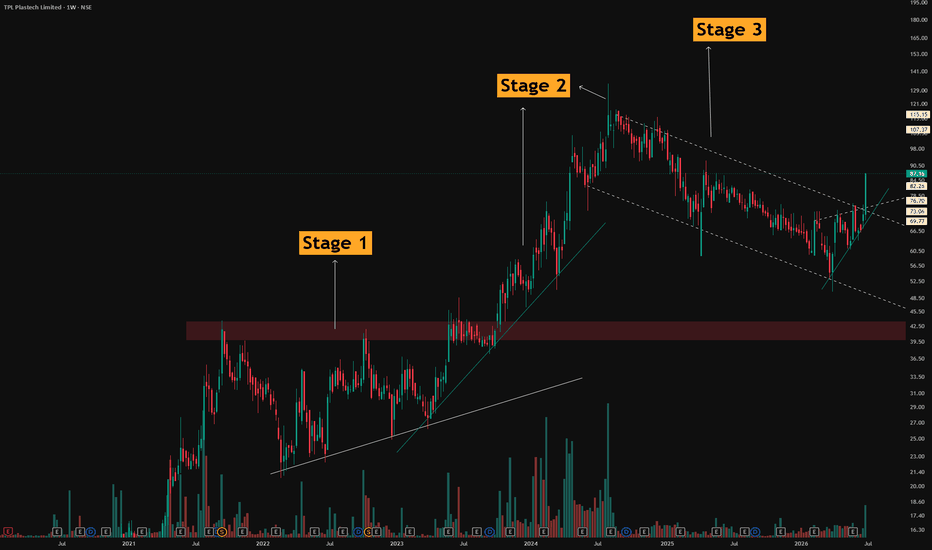
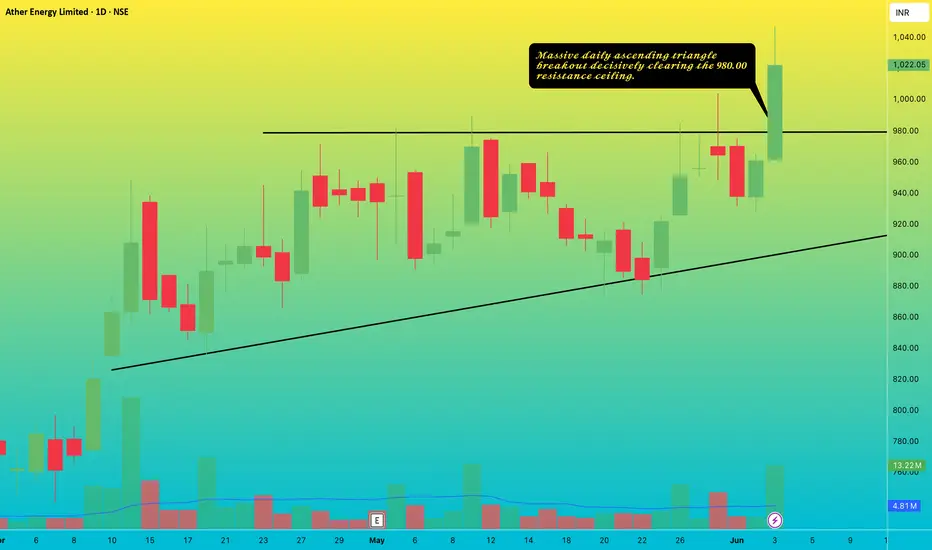
ATHERENERG: Daily Ascending Triangle Breakout1. The Macro Perspective: The Ascending Triangle Formation
I am taking a LONG bias on Ather Energy Limited (ATHERENERG) on the daily (1D) timeframe.
When analyzing pure market structure on an EV sector leader, consolidation patterns like the Ascending Triangle are essential to absorb supply and build kinetic energy. Following a steady climb, the stock entered a multi-week digestion phase, carving out a textbook Ascending Triangle visible on the chart. This phase allowed institutional capital to systematically accumulate shares at steadily increasing valuations.
2. The Educational Setup: Horizontal Resistance & Dynamic Support
To understand the technical validity behind this macro launch, look closely at how the price structure interacted with its core boundaries:
The 980.00 Resistance Ceiling: The definitive line in the sand for a bullish structural breakout was the solid black horizontal resistance line drawn at 980.00. This level acted as a heavy supply zone that systematically rejected multiple breakout attempts throughout May.
The Ascending Trendline (Support): During the consolidation, buyers aggressively defended the structural floors, forming a solid ascending diagonal trendline. Every pullback was bought at a higher low, squeezing volatility directly beneath the 980.00 breakout zone and building immense kinetic energy.
3. Current Price Action: Breakout and Volatility Expansion
Look at the massive daily candle on the far right of the chart. The structural pressure cooker has officially exploded. Institutional buyers have stepped in with undeniable conviction, backed by a noticeable volume expansion. The stock printed a towering, full-bodied green candle that has vertically surged to close near 1,022.05. This explosive thrust has decisively obliterated the 980.00 ceiling. The stock has officially transitioned out of its accumulation base and back into a highly explosive markup trend into fresh price discovery territory.
Note: Always ensure the exchange's End of Day (EOD) data files have fully synchronized before confirming the final daily close shape. It is best practice to wait until after 9:00 PM to account for any delayed Indian market data synchronization, ensuring there are no visual discrepancies or data glitches before submitting final updates for management review.
4. The Trade Plan: Entries, Targets, and Risk Management
Entry Strategy: Momentum is exceptionally strong with the stock trading vertically out in the open above the breakout line. Chasing an extended daily breakout candle carries a minor risk of a short-term mean-reversion pullback. The highest-probability entry strategy involves waiting for the initial vertical excitement to cool off. Look to scale into long positions on a potential structural pullback that perfectly retests the broken 975.00 to 985.00 prior resistance zone. Letting old historical resistance prove itself as a concrete new support floor provides an unmatched risk-to-reward ratio.
Take Profit (Targets): We use a classical measured move strategy. By taking the depth of the triangle's base (roughly 150 points from the lowest structural touch near 830.00 up to the 980.00 resistance) and projecting it upward from the breakout point, our primary structural target sits comfortably in the 1,120.00 to 1,130.00 zone over the coming weeks.
Invalidation (Stop Loss): An explosive breakout thesis is completely invalidated if the price fails to hold its newly claimed structural floor and collapses back inside the core of the triangle boundary. A hard stop loss should be placed safely below the ascending trendline and recent swing lows, specifically around the 920.00 to 930.00 level. A definitive daily close completely back below 920.00 would act as a severe warning sign of a failed continuation breakout and a bull trap.
5. Time Horizon:
Because this technical setup is built on a 1-Day chart capturing a clear structural phase transition and a textbook ascending triangle breakout, this is a high-alpha swing trade designed to capture a rapid momentum markup phase over the coming weeks. Let the trend run!  Long
Long
MUFIN: Weekly Ascending Triangle Breakout1. The Macro Perspective: The Structural Accumulation
I am taking a LONG bias on Mufin Green Finance Limited (MUFIN) on the macro weekly (1W) timeframe. Over the past several quarters, the stock entered a highly constructive digestion phase. By continuously printing higher lows against a fixed horizontal resistance, the stock carved out a high-precision ascending triangle pattern. This structure is a classic footprint of institutional accumulation; buyers were willing to step in at progressively higher prices, continuously compressing the price action and coiling the spring before unleashing this fresh, secular markup phase.
2. The Educational Setup: Defining the Boundaries
To understand the technical validity behind this macro launch, look closely at how the price structure interacted with its core boundaries:
The 124.02 Upper Resistance: The definitive ceiling for a bullish structural shift was the black horizontal resistance line marked strictly at 124.02. This level acted as a major supply zone that capped upward momentum during the entire consolidation phase spanning late 2025 into mid-2026.
The Ascending Support Trendline: Complementing the resistance was a firm upward-sloping trendline connecting the higher lows originating from early 2025. This rising floor continuously compressed the price action against the 124.02 ceiling, building immense structural pressure.
3. Current Price Action: Breakout and Acceptance
The structural pressure cooker has successfully resolved to the upside. Looking at the right side of the chart, buyers stepped in with conviction to breach the 124.02 macro ceiling a few weeks ago. Crucially, instead of failing, the stock exhibited excellent post-breakout price acceptance, retesting the broken resistance and proving it as new support. This week, it is showing strong continuation, currently trading at 135.30. The stock has officially transitioned out of its accumulation pattern and into a highly explosive markup trend.
Note: Since it is currently Thursday, always wait for the final weekly close on Friday to confirm the ongoing momentum and ensure the candle remains strong.
4. The Trade Plan: Entries, Targets, and Risk Management
Entry Strategy: Momentum is firmly established. The highest-probability entry strategy is to look to scale into long positions on any minor structural pullbacks toward the 125.00 to 130.00 zone. Letting old historical resistance continue to act as a concrete new support floor provides an excellent risk-to-reward ratio.
Targets: By utilizing a classical measured move strategy based on the maximum structural depth of the triangle base (measuring from the deep swing lows near 65.00 up to the 124.02 ceiling), we project an expansion of approximately 55-60 points. Projecting this upward from the breakout point, our primary structural macro target sits comfortably in the 175.00 to 185.00 zone over the coming quarters.
Risk Management: This structural breakout thesis is invalidated if the price fails to sustain its newly claimed floor and collapses back deep inside the triangle pattern, breaking the ascending trendline. A hard stop loss should be placed safely below the recent minor swing low structure just prior to the breakout, specifically around the 110.00 to 115.00 level.
5. Time Horizon:
Because this technical setup captures a clean structural phase transition and a textbook ascending triangle breakout on the 1-Week chart, this is a position trade designed to capture a sustained secular markup phase. Let the trend run!  Long
Long
HINDUNILVR | 2-Year Symmetrical Triangle — Breakout Zone WatchOverview
Hindustan Unilever — one of India's most widely held FMCG stocks — has been forming a Symmetrical Triangle on the Daily chart spanning nearly 2 years. Price is currently sitting inside the triangle's breakout zone, with yesterday's strong +3% bullish candle adding momentum to the setup.
The next few sessions will be critical in determining whether this triangle resolves bullishly or bearishly.
The Symmetrical Triangle
A Symmetrical Triangle forms when price makes lower highs and higher lows simultaneously — compressing into a tighter range as neither buyers nor sellers gain control. The upper boundary connects a series of declining highs from the October 2024 peak, while the lower boundary connects a series of rising lows from early 2025.
Both lines are converging toward an apex — and price is currently sitting right inside this breakout zone.
Yesterday's Bullish Candle — +3%
On July 1, HINDUNILVR closed with a strong +3% bullish candle from the Support 1 area near ₹2,070. This candle:
Bounced strongly from the triangle's lower support boundary
Closed near the middle of the triangle range
Signals buyers stepping in aggressively at the lower boundary
This is the catalyst that makes today's price action particularly important.
Key Levels
🔴 Resistance 1 — 2,367 (Triangle Upper Resistance area)
🔴 Resistance 2 — 2,406
🔴 Resistance 3 — 2,477
🟡 Current Price — 2,182 (inside triangle)
🟢 Support 1 — 2,070
🟢 Support 2 — 2,006 (Swing Low)
Two Scenarios
🟢 Scenario A — Bullish Breakout
Price closes decisively above the Triangle Upper Resistance line (currently near ₹2,367) on a daily basis. This would confirm a bullish breakout from the 2-year triangle. Targets would be Resistance 2 at ₹2,406, then Resistance 3 at ₹2,477 progressively.
A breakout here would also signal potential sector rotation into FMCG — significant for the broader market.
🔴 Scenario B — Bearish Breakdown
Price fails to hold above Support 1 (₹2,070) and breaks below the Triangle Lower Support line. This would confirm a bearish breakdown from the triangle. Watch Support 2 at ₹2,006 (Swing Low) as the next key level.
⚪ Scenario C — Range Compression Continues
Price continues to compress inside the triangle between ₹2,070 and ₹2,367 for more sessions. In this case wait for a confirmed breakout in either direction with volume before acting.
Why Symmetrical Triangles Matter
A Symmetrical Triangle is one of the most reliable continuation or reversal patterns in technical analysis. It represents a period of indecision — energy building up before a decisive move. The longer the triangle forms, the more significant the eventual breakout tends to be.
With this triangle spanning nearly 2 years, the breakout — when it comes — is likely to be substantial in magnitude. Patience is required, but the setup is worth watching closely.
Conclusion
HINDUNILVR is at a technically significant junction. A 2-year Symmetrical Triangle is reaching its breakout zone, with yesterday's +3% candle suggesting buyers are defending the lower boundary. Watch the upper resistance at ₹2,367 closely — a daily close above this level would be a major breakout signal.
Do not predict — observe the close and react with confirmation.
For educational purposes only. Not financial advice. Always manage your risk. IndusInd Bank: The Ultimate Squeeze Ready for Wave (V)?Looking at the multi-decade chart of IndusInd Bank, we are witnessing a massive financial story unfold. The stock has respected the same geometric boundaries for nearly 30 years, and it is now approaching a major decision point.
Here is a simple breakdown of the macro picture:
1. The 28-Year Parallel Channel
Since its inception in the late 1990s, the stock has traded inside a giant ascending parallel channel .
The bottom line has always acted as a rock-solid floor.
The top line acts as the ultimate ceiling.
2. The 6-Year Rest Phase (Wave IV)
After hitting an all-time high of ₹2,038 in 2018, the stock entered a long, exhausting correction. On an Elliott Wave basis, this looks like a classic abcde contracting triangle :
Point a: The March 2020 COVID crash floor at ₹235.55. Interestingly, Point a bottomed out exactly at the 0.5 log retracement of the entire Wave (III) rise, showing how perfectly the market respected this geometry.
Point e (The Final Floor): The recent correction held the structural support line around ₹750.50 .
By holding this level, the stock proved that buyers are still defending the long-term trend.
The Current Setup: The Squeeze
Right now, the stock is trading at ₹941.60 , sitting right at the apex of this 6-year triangle.
The Trigger: It is currently testing the white descending resistance line connecting points b and d.
The Breakout: A strong, decisive close above this trendline will signal that the 6-year correction is officially over.
The Trade Plan
The Bullish Target (Wave V): If the breakout is confirmed, it opens the door for a brand-new, multi-year bull market. The ultimate goal for Wave (V) would be to reclaim the old highs of ₹2,038 and trend toward the upper half of the multi-decade channel.
The Risk (Invalidation): The entire bullish setup relies on the recent floor holding. If the price breaks below ₹750 , the triangle pattern fails, and the view must be revised.
Disclaimer: This post is for educational purposes only and is not financial advice. I am not a SEBI-registered analyst. Please do your own research and manage your risk carefully. Long 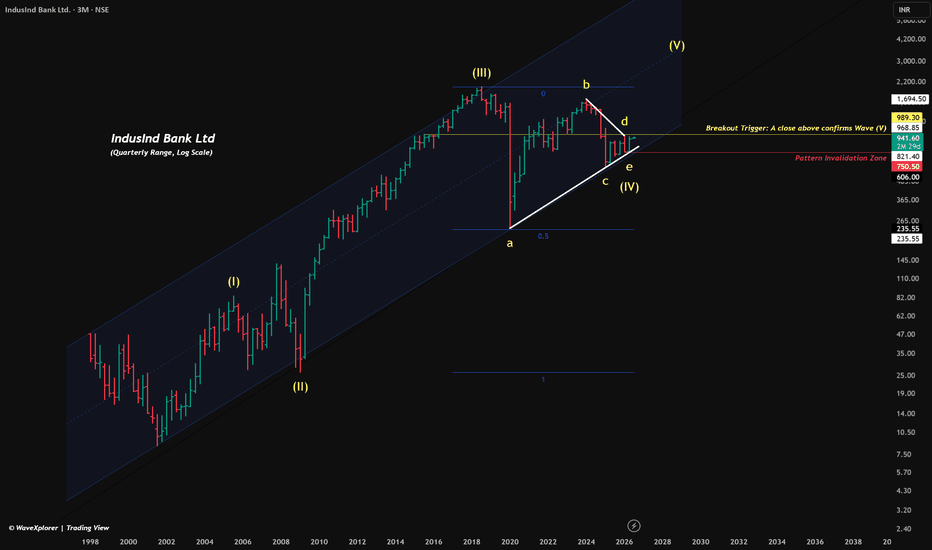
ICICIBANK Triangle + Falling Wedge Played Out—Apex Decision ZoneOverview
ICICIBANK has delivered a textbook multi-pattern setup on the Daily timeframe. Two classic chart patterns formed back to back — a Symmetrical Triangle spanning over a year, followed by a Falling Wedge within the correction — and both have now played out with price rallying over 120 points from the breakout zone.
The stock now sits at a critical Triangle Apex Zone — and the next move from here could be significant.
Pattern 1 — Symmetrical Triangle (April 2025 to March 2026)
A large symmetrical triangle formed over approximately 11 months on the Daily chart. The upper boundary connected a series of lower highs, while the lower boundary connected higher lows — classic converging structure indicating a period of indecision between buyers and sellers.
Price tested both boundaries multiple times before eventually breaking down in early 2026, leading to the correction phase.
Pattern 2 — Falling Wedge (April to June 2026)
During the correction, a Falling Wedge formed — two downward-sloping converging lines compressing price between approximately ₹1,380 and ₹1,186. The Falling Wedge is a bullish reversal pattern — it signals exhaustion of selling pressure.
Price broke out of the wedge at ₹1,265, confirmed the reversal, and rallied to a high of ₹1,404 — a move of approximately 139 points from the breakout level.
Where We Are Now
Price has pulled back slightly from the ₹1,404 high and is currently sitting at ₹1,387 — right at the Triangle Upper Band / Apex Zone near ₹1,393.
This is the most important level on the chart right now. The triangle's upper boundary, which previously acted as resistance for over a year, is now being tested from below.
Key Levels
🟡 Triangle Apex Resistance — 1,393
🟢 Falling Wedge Breakout Zone — 1,265
🟡 Next Resistance if triangle breaks — 1,500
🔴 Low of the move — 1,186
Two Scenarios Going Forward
🟢 Scenario A — Triangle Breakout Confirms
A daily close above ₹1,393–1,400 with good volume would confirm a breakout above the triangle upper band. This opens the path toward ₹1,500 — the measured resistance level above.
🔴 Scenario B — Rejection at Apex
If price fails to close above ₹1,393 and reverses, the triangle upper band has acted as resistance again. In this case watch ₹1,265 as the key support to hold the bullish structure.
What This Setup Teaches
Patterns within patterns are common in markets. A large triangle sets the broader context. A smaller falling wedge within the correction gives the entry signal. Understanding which pattern to trade and which to use as context is a key skill in technical analysis.
The triangle told us the structure. The falling wedge told us the timing.
Conclusion
ICICIBANK has completed a clean two-pattern sequence and is now testing a critical decision zone. The next daily close above or below ₹1,393 will define the next leg.
Watch the close carefully.
For educational purposes only. Not financial advice. Always manage your risk. The Elliott Wave Triangle PlaybookTriangles are a trader’s best friend and worst nightmare.
They are notorious for driving technical analysts crazy. Why? Because while a triangle is forming, it looks exactly the same whether the market is preparing for a massive bullish breakout or setting a deadly trap for buyers.
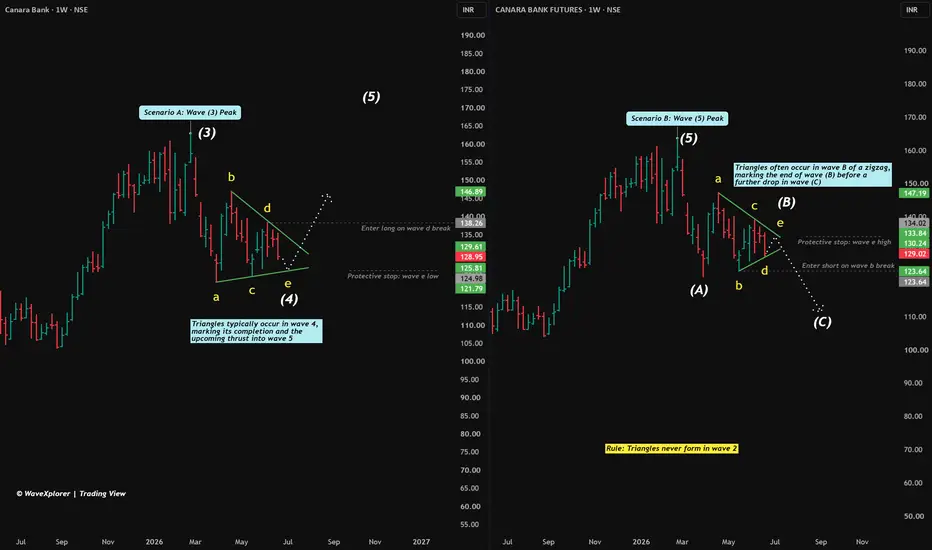
To have different triangle notations, I have used Canara Bank spot chart on the left panel and the Futures chart on the right panel.
Look at the chart. We have a tightening squeeze with five sub-waves ( a-b-c-d-e ). It looks identical on both sides, but it can play out in two completely opposite ways.
Let’s break down the two faces of the triangle—and exactly how to trade them without guessing the direction.
The Two Faces of the Triangle
Scenario A: The Wave Four Launchpad (Bullish)
In a healthy uptrend, a triangle often shows up as Wave Four .
The Story: The market just made a powerful run ( Wave Three ) and needs to catch its breath. Big players are slowly accumulating shares without pushing the price too high.
The Result: Once the triangle finishes at wave e, the price violently explodes upward to make a brand-new high ( Wave Five ).
Scenario B: The Wave B Bull Trap (Bearish)
Sometimes, the big upward trend is already over ( Wave Five peak), and the market is entering a major correction.
The Story: The market drops hard ( Wave A ). Then, a triangle forms as Wave B . This is a deceptive sideways move designed to trick retail traders into thinking the bull market is back.
The Result: Once wave e finishes, the floor drops out, and the price crashes into a punishing Wave C decline.
The Golden Exclusion Rule
Before you look for a triangle, remember this core rule: Triangles never form in Wave Two. If you see a triangle right after a major trend begins, it is not a Wave Two. This rule alone will save you from countless bad trades.
How to Trade It: Stop Predicting, Start Trapping!
Don't waste your time or money trying to guess if Canara Bank is in Scenario A or Scenario B. Instead, react to the market by setting a trap on both sides.
Here is your mechanical, stress-free execution plan using key structural levels:
The Long Entry (Buying the Breakout)
The Trigger: Wait for the price to break above the wave d peak .
Why it works: Breaking this level proves the sequence of lower highs is broken. This officially triggers the move to Wave Five.
Safety Net (Stop Loss): Place it just below the wave e low .
The Short Entry (Buying the Crash)
The Trigger: Wait for the price to break below the wave b floor .
Why it works: Many traders get faked out by simple trendline breaks. By waiting for the actual wave b structural floor to snap, you confirm the entire triangle has collapsed into Wave C.
Safety Net (Stop Loss): Place it just above the wave e high .
Summary
By letting the market break wave d or wave b levels, you completely eliminate the guessing game.
Disclaimer: This post is for educational purposes only and is not financial advice.  Education
 Long
Long
 Long
Long
One Chart, Multi Patterns: Reading the Layers Hidden on 6MEvery candle on this chart represents six months — so what you’re looking at isn’t days or weeks of behavior, it’s years compressed into a single structure
A — The Symmetrical Triangle
Marked at point A is the upper resistance line of a symmetrical triangle, drawn as a dotted line converging downward.A symmetrical triangle forms when buyers and sellers gradually compress price into a tightening range — highs get lower, lows get higher, and volatility contracts. On a six-month-per-candle chart, this isn’t a short-term squeeze; it’s a multi-year contraction, which makes the eventual resolution of this pattern far more significant than it would be on a lower timeframe.
B — The Lower Support, and the Hidden Parallel Channel
Point B marks the lower boundlary of that same symmetrical triangle — but here’s the layer most people miss. Running parallel to this support line is a separate ascending channel, climbing alongside it. This is the real lesson of this chart: markets rarely respect just one pattern at a time. A symmetrical triangle and a parallel ascending channel can coexist within the same price structure, and recognizing both means you’re reading the chart’s full context, not just the most obvious shape on it. Location and structure layering matter more than spotting a single textbook pattern in isolation.
C — The Steep Trendline Beneath It All
Point C is a separate, much steeper trendline — a solid line acting as a foundational support for the entire structure above it.
Disclaimer: This post is for educational and informational purposes only. It does not constitute financial advice, a forecast, or a recommendation to buy, sell, or hold any security  Long
Long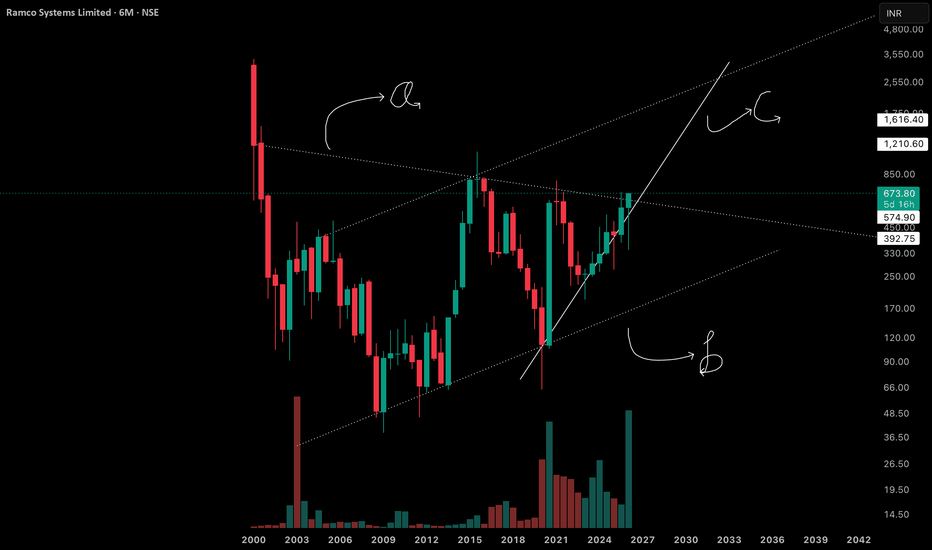
 Long
Long
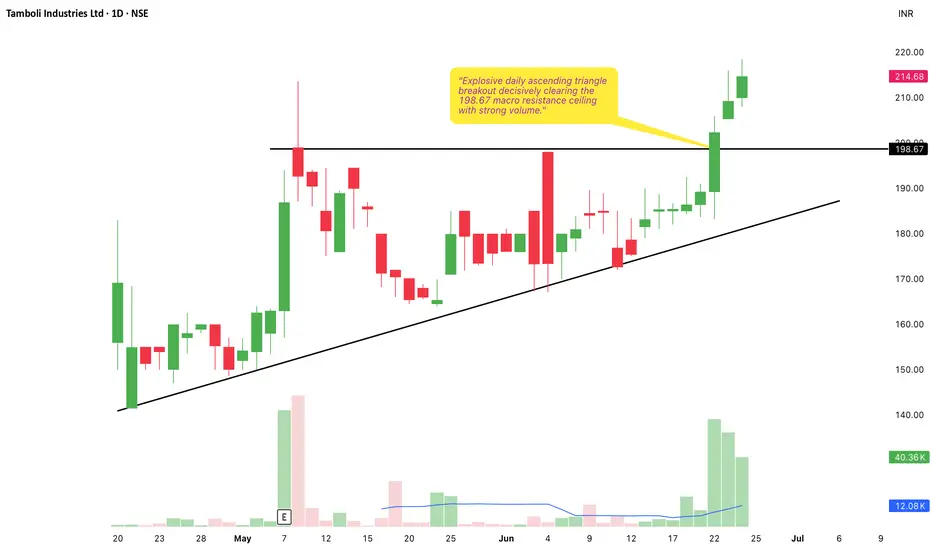
TAMBOLIIN: Explosive Daily Triangle Breakout1. The Macro Perspective: The Structural Breakout
I am taking a LONG bias on Tamboli Industries Ltd (TAMBOLIIN) on the daily (1D) timeframe. Following a period of volatility earlier in the year, the stock entered a highly constructive digestion phase. By continuously printing higher lows against a fixed horizontal resistance over the past two months, the stock carved out a high-precision ascending triangle pattern. This structure is a classic footprint of institutional accumulation; buyers were willing to step in at progressively higher prices, coiling the spring tightly before unleashing this week's highly aggressive markup phase.
2. The Educational Setup: Defining the Boundaries
To understand the technical validity behind this macro launch, look closely at how the price structure interacted with its core boundaries:
The 198.67 Upper Resistance: The definitive ceiling for a bullish structural shift was the black horizontal resistance line marked strictly at 198.67. This level acted as a major supply zone that capped the previous prominent peaks in early May and early June.
The Ascending Support Trendline: Complementing the resistance was a firm upward-sloping trendline connecting the higher lows since late April. This rising floor continuously compressed the price action against the 198.67 ceiling, building immense structural pressure.
3. Current Price Action: Breakout and Volume Expansion
The structural pressure cooker has officially exploded. Looking at the far right of the chart, buyers have stepped in with overwhelming conviction, supported by a significant expansion in daily trading volume that towers over the preceding consolidation phase. The stock printed a series of powerful green expansion candles that decisively obliterated the 198.67 macro ceiling. It is showing excellent continuation and is currently trading exceptionally strong at 214.68. The stock has officially transitioned out of accumulation and into a highly explosive, momentum-driven markup trend.
4. The Trade Plan: Entries, Targets, and Risk Management
Entry Strategy: Momentum is currently extreme. Chasing extended daily expansion candles carries a significant risk of a rapid lower-timeframe mean-reversion pullback. The highest-probability entry strategy is to exercise patience and look to scale into long positions on a potential structural pullback to retest the broken 195.00 to 200.00 prior resistance zone. Letting old historical resistance prove itself as a concrete new support floor provides an unmatched risk-to-reward ratio.
Targets: By utilizing a classical measured move strategy based on the maximum structural depth of the triangle base (measuring from the deep lows near 145.00 up to the 198.67 ceiling), we can project an expansion of roughly 50+ points. Projecting this upward from the breakout point, our primary short-term structural target sits comfortably in the 245.00 to 255.00 zone.
Risk Management: An explosive continuation breakout thesis is invalidated if the price fails to hold the breakout and collapses back deep inside the triangle pattern, breaking the ascending trendline. A hard stop loss should be placed safely below the recent minor swing low structure just prior to the breakout, specifically around the 180.00 to 185.00 level.
5. Time Horizon:
Because this technical setup captures a highly explosive momentum breakout and a textbook ascending triangle completion on the 1-Day chart, this is a swing-to-position trade designed to capture a rapid, sustained markup phase. Trail your stop losses tightly as it runs!  Long
Long
Long 
 Long
Long
KRISHNADEF: Weekly Macro Triangle Breakout1. The Macro Perspective: The Structural Breakout
I am taking a LONG bias on Krishna Defence and Allied Industries Limited (KRISHNADEF) on the macro weekly (1W) timeframe. Zooming out to view the wider macro structure, we can see the stock has been respecting a massive ascending support trendline originating all the way back in early 2024. By continuously printing higher lows against a fixed horizontal resistance, the stock carved out a textbook multi-year ascending triangle pattern. This extended basing period allowed institutional capital to completely absorb overhead supply and build immense structural pressure before initiating this fresh, secular markup phase.
2. The Educational Setup: Defining the Boundaries
To understand the technical validity behind this move, look closely at how the price structure interacted with its core boundaries:
The 1,131.90 Upper Resistance: The definitive ceiling for a bullish structural shift was the horizontal black resistance line strictly marked at 1,131.90. This macro supply zone capped upward momentum during the entire 2024/2025 consolidation phase, acting as the absolute lid on the pressure cooker.
The Ascending Support Trendline: Complementing the resistance was a firm, long-term upward-sloping trendline connecting the macro higher lows. Institutional buyers consistently stepped in at progressively higher prices, continuously compressing the price action and coiling the spring for the breakout.
3. Current Price Action: Breakout Confirmation and Continuation
The structural pressure cooker has successfully resolved to the upside. Looking at the right side of the chart, buyers stepped in with overwhelming conviction a few weeks ago, printing a powerful breakout candle. The stock decisively obliterated the 1,131.90 macro ceiling and is now showing excellent continuation, currently trading exceptionally strong at 1,370.20. The price action confirms that the stock has officially transitioned out of its lengthy accumulation structure and into a highly explosive markup trend into fresh territory.
4. The Trade Plan: Entries, Targets, and Risk Management
Entry Strategy: Momentum is firmly established. While chasing an extended weekly move carries a minor risk of a short-term lower-timeframe mean-reversion pullback, the highest-probability strategy is to look to scale into long positions on any potential structural retest of the broken 1,100.00 to 1,150.00 prior resistance zone. Letting old historical resistance prove itself as a concrete new support floor provides an unmatched risk-to-reward ratio.
Targets: By utilizing a classical measured move strategy based on the structural depth of the massive triangle base (measuring from the trendline support up to the 1,131.90 ceiling), we project significant upside. Projecting this massive depth upward from the breakout point, our primary structural macro target sits comfortably in the 1,650.00 to 1,750.00 zone over the coming quarters.
Risk Management: This structural breakout thesis is invalidated if the price fails to sustain its newly claimed floor and collapses back deep inside the pattern, breaking the ascending trendline on a closing basis. A hard stop loss should be placed safely below the recent weekly consolidation cluster that preceded the breakout, specifically around the 950.00 to 1,000.00 level.
5. Time Horizon:
Because this technical setup captures a clean structural phase transition and a massive multi-year ascending triangle breakout on the 1-Week chart, this is a long-term position trade designed to capture a sustained secular markup phase. Let the trend run!  Long
Long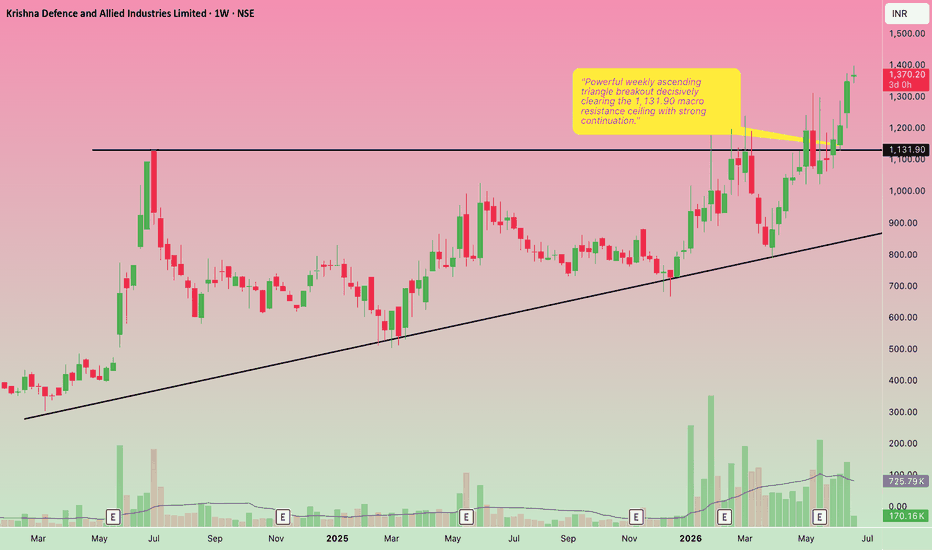
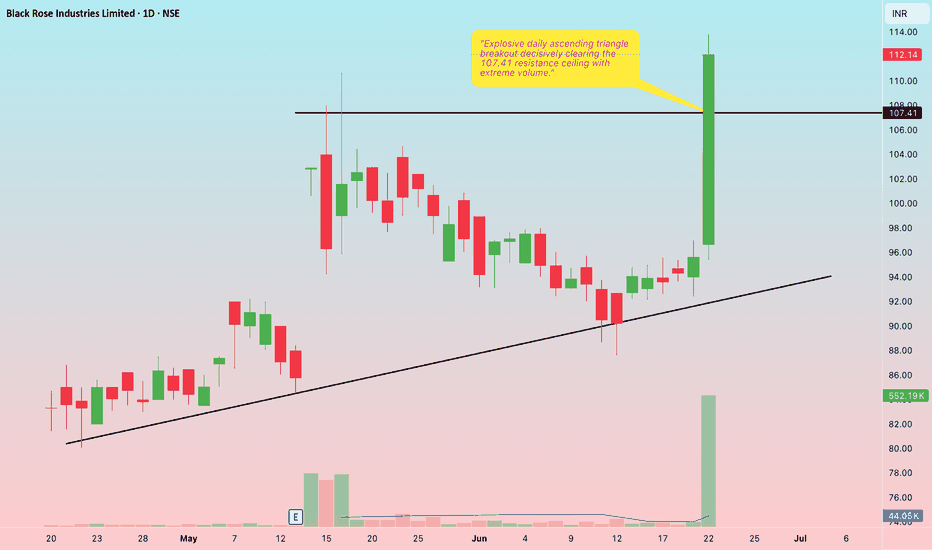
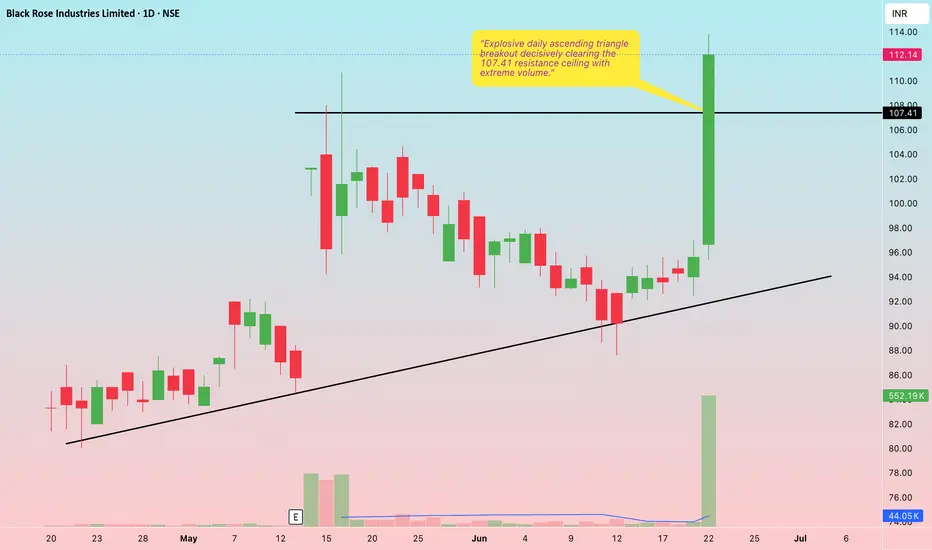
BLACKROSE: Explosive Daily Triangle Breakout1. The Macro Perspective: The Structural Consolidation
I am taking a LONG bias on Black Rose Industries Limited (BLACKROSE) on the daily (1D) timeframe. Following a period of initial momentum, the stock entered a necessary digestion phase over the past two months. By continuously printing higher lows against a fixed horizontal resistance, the stock carved out a high-precision ascending triangle pattern. This structure clearly demonstrates institutional accumulation; buyers were willing to step in at progressively higher prices, coiling the spring tightly before unleashing today's highly aggressive markup phase.
2. The Educational Setup: Defining the Boundaries
To understand the technical validity behind this macro launch, look closely at how the price structure interacted with its core boundaries:
The 107.41 Upper Resistance: The definitive ceiling for a bullish structural shift was the black horizontal resistance line marked strictly at 107.41. This level acted as a major supply zone that capped the previous peak in mid-May.
The Ascending Support Trendline: Complementing the resistance was a firm upward-sloping trendline connecting the higher lows since late April. This rising floor continuously compressed the price action against the 107.41 ceiling, building immense structural pressure.
3. Current Price Action: Breakout and Extreme Volume Expansion
The structural pressure cooker has officially exploded. Looking at the far right of the chart, buyers have stepped in with overwhelming conviction, supported by a massive expansion in daily trading volume that absolutely dwarfs previous sessions. The stock has printed a towering vertical green expansion candle—surging over 17% today—that decisively obliterated the 107.41 macro ceiling. It is currently trading exceptionally strong at 112.14. The stock has officially transitioned out of accumulation and into a highly explosive, momentum-driven markup trend.
4. The Trade Plan: Entries, Targets, and Risk Management
Entry Strategy: Momentum is currently extreme. Chasing a +17% daily expansion candle carries a significant risk of a rapid lower-timeframe mean-reversion pullback. The highest-probability entry strategy is to exercise patience and look to scale into long positions on a potential structural pullback to retest the broken 105.00 to 108.00 prior resistance zone. Letting old historical resistance prove itself as a concrete new support floor provides an unmatched risk-to-reward ratio.
Targets: By utilizing a classical measured move strategy based on the structural depth of the triangle base (measuring from the beginning of the trendline near 82.00 up to the 107.41 ceiling), we can project an expansion of roughly 25 points. Projecting this upward from the breakout point, our primary short-term structural target sits comfortably in the 130.00 to 135.00 zone.
Risk Management: An explosive continuation breakout thesis is invalidated if the price fails to hold the breakout and collapses back deep inside the triangle pattern, breaking the ascending trendline. A hard stop loss should be placed safely below the recent minor swing low structure inside the triangle, specifically around the 92.00 to 95.00 level.
5. Time Horizon:
Because this technical setup captures a highly explosive momentum breakout and a textbook ascending triangle completion on the 1-Day chart, this is a swing-to-position trade designed to capture a rapid, sustained markup phase. Trail your stop losses tightly as it runs!  Long
Long