Cotton: possible double bottom, longCotton has been falling since the 93.74 top in late August. The first low came at 77.05 on October 2, the bounce stalled at 82.25, and the second leg down made a marginally lower low at 76.47 on November 4. That new low didn’t hold for even a day: price reversed straight back above 77.05, so the bre
Peers for comparison
Cotton: higher low at 79.23, long above 81.81The September slide in cotton ended at 77.05 on October 2, just above the 75.25 to 74.76 double level (daily 1/4 of the range and quarterly ATL/H 3/4). The rebound reached 81.81, the pullback held at 79.23 on October 9 for a higher low, and price is back pressing the October 6 high. A break of 81.81
Cotton: failed at 84.18, short below 80.66Cotton topped at 93.74 at the end of August after a 54% rally from the February low. The top came with a weekly key reversal, and the daily swing chart has been stepping down since: a sharp drop, a lower high near 89 below the 88.70 level (3/8 of the range), then a slide to the 80.80 swing low on Se
Are Hidden Water Costs Driving Global Cotton Futures?Investors often misunderstand the true volatility of global cotton futures. They typically blame erratic weather patterns or sudden trade tariffs. A new Chatham House study, "The Water Footprints of Global Textiles Trade," points to a deeper catalyst. Every textile carries what researchers call a hi
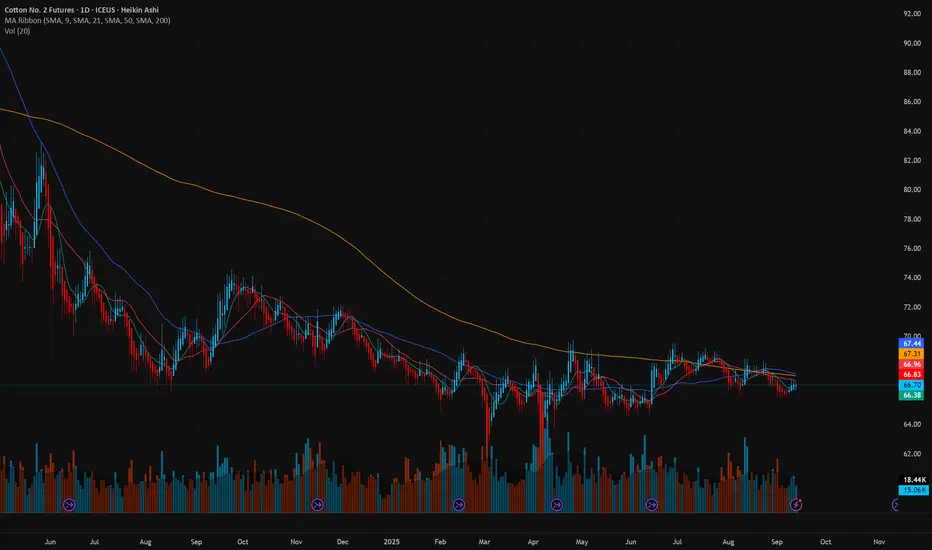
Will Global Supply Shocks Explode Cotton Prices?Cotton sits at a genuine inflection point, but the case for a durable bottom is more mixed than the headlines suggest. Prices have actually declined roughly 4% over the past month even as they ticked modestly higher into July, and the most recent independent analysis available called the bears still
Cotton LONGBack at historic support and holding.
Hit its .886 Fib level.
Highest volume ever last month.
Rising oil prices may increase demand for cotton as costs for synthetics increase.
Commodity cycle is in full swing.
Enter now
3 take profits
You can access this trade by finding your regional cotton ETF/
Long Cotton📌 Cotton Futures: Seasonality, Market Drivers & How to Trade
For more than 7,000 years, cotton has been one of humanity’s most important raw materials. Once spun by hand and woven into basic cloth, today cotton is at the core of the global textile industry, used in apparel, home furnishings, indust
See all ideas
A representation of what an asset is worth today and what the market thinks it will be worth in the future.
Displays a symbol's price movements over previous years to identify recurring trends.
Frequently asked questions
One way to gain exposure to CTN2022 is through a broker that offers futures. Before trading, make sure you understand how the product works and the risks involved.
You can trade CTN2022 directly from TradingView:
– Choose a broker: Explore our supported trading partners and pick one that fits your needs
– Compare options: View available brokers side by side to evaluate fees and features
– Connect your account: Open Supercharts, click "Trade", select your broker, and log in
– Start trading: Place orders directly from the chart
Tip: If you're new to trading, try paper trading first — it lets you practice strategies in real market conditions without risking funds.
You can trade CTN2022 directly from TradingView:
– Choose a broker: Explore our supported trading partners and pick one that fits your needs
– Compare options: View available brokers side by side to evaluate fees and features
– Connect your account: Open Supercharts, click "Trade", select your broker, and log in
– Start trading: Place orders directly from the chart
Tip: If you're new to trading, try paper trading first — it lets you practice strategies in real market conditions without risking funds.
The nearest expiration date for CTN2022 is Jul 7, 2022.
Futures contracts expire on predetermined dates. As expiration approaches, many traders roll positions into the next contract to maintain exposure to the market.
Key metrics to watch near expiration:
• Volume and liquidity: Trading activity often shifts to the next contract month
• Open interest: Falling open interest may signal positions being closed or rolled forward
• Forward curve: Differences between contract prices can help identify market structure, including contango and backwardation
Explore the CTN2022 chart to monitor active contracts and contract-month activity.
Futures contracts expire on predetermined dates. As expiration approaches, many traders roll positions into the next contract to maintain exposure to the market.
Key metrics to watch near expiration:
• Volume and liquidity: Trading activity often shifts to the next contract month
• Open interest: Falling open interest may signal positions being closed or rolled forward
• Forward curve: Differences between contract prices can help identify market structure, including contango and backwardation
Explore the CTN2022 chart to monitor active contracts and contract-month activity.