XAUUSD Weekly Outlook — Breakout Needs a Retest
Gold is sitting around 4,378 after breaking the H4 descending trendline.
The structure is improving, but price is now testing the 4,385–4,405 immediate resistance area.
The simple read
A pullback toward 4,290–4,320 would be the cleaner test for buyers.
If this zone holds, Gold may recover toward 4,400 first, followed by the major 4,485–4,510 resistance.
A clean break above 4,510 could later expose the H4 resistance around 4,630.
If 4,290 fails, the major swing support near 4,235 becomes important again.
Key price zones
4,385–4,405 — immediate resistance
4,290–4,320 — key pullback support
4,235 — major swing low
4,485–4,510 — major resistance
4,630 — H4 resistance
The trendline break is encouraging, but I prefer a retest before continuation.
Do not chase the breakout.
Wait for the zone.
Can buyers defend 4,30x and open the path toward 4,500?  Long
Long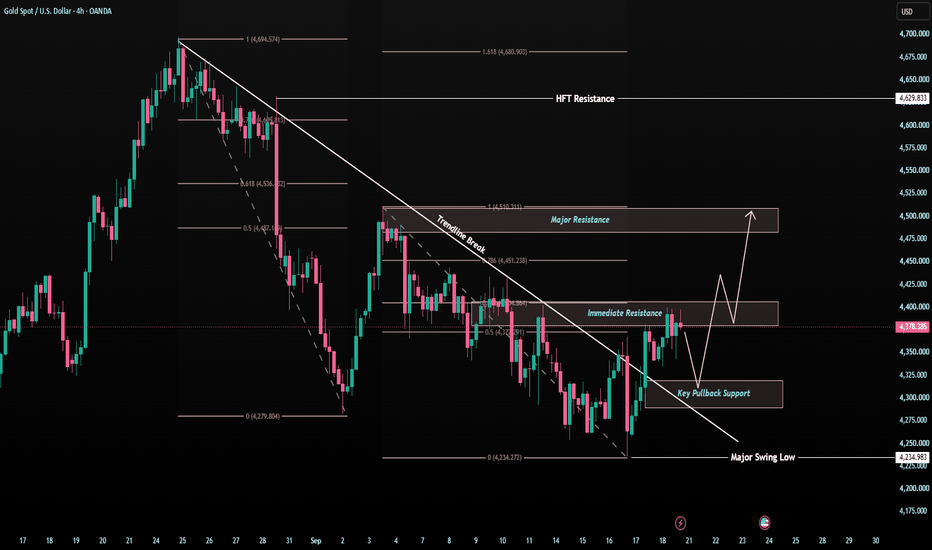
Long 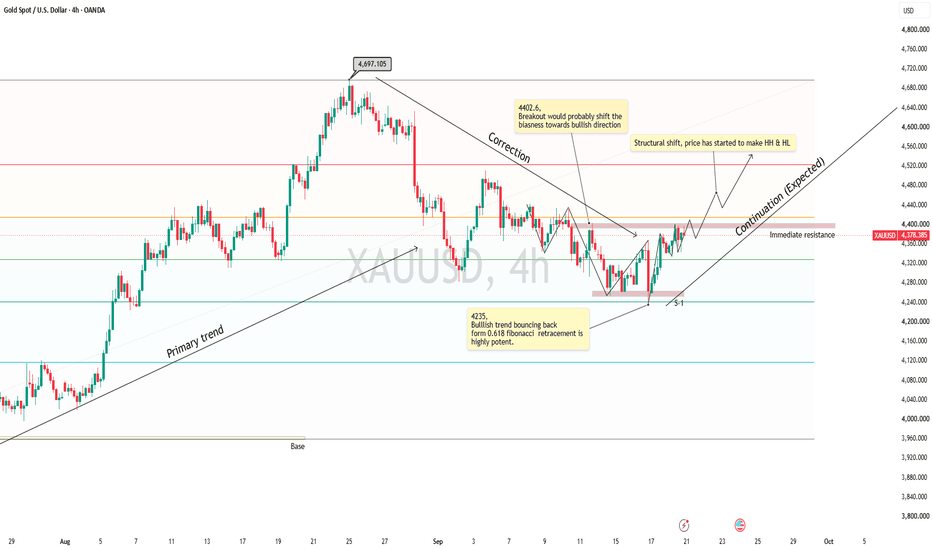
XAUUSD — Bullish Recovery Toward 4,410Gold is showing a bullish recovery after reacting strongly from the lower liquidity area. From Kelly’s view, the chart suggests that XAUUSD may be forming a new upside Elliott Wave structure after breaking out from the lower side of the previous bearish channel.
The key idea is simple: if gold continues to hold above the Buy zone liquidity, the recovery structure can continue toward the next resistance levels.
⟡ Market structure
Gold is currently trading around 4,310–4,318, after bouncing from the Buy zone liquidity near 4,275–4,290. This reaction shows that buyers are trying to defend the lower support area and build a new bullish base.
The first resistance to watch is around 4,340–4,355, marked as the short-term sell scalping area. If gold breaks above this zone, the next important level is the strong resistance near 4,367.
A clean move above 4,367 would strengthen the bullish structure and open the way toward the 4,405–4,415 Resistance done wave 5 zone. If momentum continues, the larger upside target remains near 4,485–4,500.
➤ Key levels
◌ Current price area: 4,310–4,318
◌ Buy zone liquidity: 4,275–4,290
◌ Short-term resistance: 4,340–4,355
◌ Strong resistance: 4,367
◌ Main wave 5 target: 4,405–4,415
◌ Extended bullish target: 4,485–4,500
◌ Bullish invalidation: below 4,255
⌁ Elliott Wave view
The chart shows a possible bullish Elliott Wave recovery.
Wave (1) may have started from the lower liquidity area and pushed price toward 4,317.
Wave (2) may have completed after the retest near 4,275–4,290.
If this buy zone holds, wave (3) may continue toward 4,340–4,355 and 4,367.
Wave (4) could create a short pullback after testing resistance.
Wave (5) may then extend toward 4,405–4,415.
If buyers remain strong above that area, gold may later attempt the larger resistance zone around 4,485–4,500.
▸ Trading scenario
Preferred bullish scenario
Entry: Buy around 4,275–4,290 if price gives bullish confirmation from the liquidity zone
Stop Loss: Below 4,255
Take Profit 1: 4,340–4,355
Take Profit 2: 4,367
Take Profit 3: 4,405–4,415
Take Profit 4: 4,485–4,500
Alternative entry
If gold breaks above 4,340–4,355 and retests this area as support, buyers may look for continuation toward 4,367 and 4,405–4,415.
◌ Invalidation
The bullish view becomes weaker if gold breaks below 4,255 and fails to reclaim the buy liquidity zone. In that case, the recovery structure may fail and price could return to the lower bearish channel.
⌁ Kelly’s view
Kelly’s main view is bullish while gold holds above 4,275–4,290. The market is showing a strong reaction from the lower liquidity area, and the current pullback may only be preparation for the next upside wave.
If buyers defend the buy zone and price breaks above 4,340–4,355, gold may continue toward 4,367, then 4,405–4,415. The larger bullish target remains near 4,485–4,500 if momentum expands.
Do you think gold will break above 4,367 first, or retest the buy zone once more before the next rally? Long 
XAUUSD — Sell Pressure Below 4,300XAUUSD — Sell Pressure Below 4,300
Gold is still trading with a bearish intraday structure after failing to reclaim the upper liquidity zone. From Kelly’s view, the chart suggests that XAUUSD remains under selling pressure, and the current rebound is likely just a temporary pause before price continues lower.
The key idea is simple: as long as gold stays capped below the 4,290–4,300 sell zone, the market may continue rotating down toward the 4,254 support, then extend lower into the 4,235 area and possibly the final wave target near 4,160–4,170.
⟡ Market structure
Gold is currently trading around 4,290, right below the short-term liquidity sell zone. The recent price action keeps printing lower highs, which tells us that sellers still control the structure.
The area around 4,290–4,300 is important because it acts as immediate resistance. If price continues rejecting from this zone, the market may retest 4,254 first. A break below that support would likely expose the next reaction zone around 4,235–4,245.
From the Elliott Wave view, the chart still supports a bearish continuation. The current movement looks like a corrective wave before another downside leg develops. If sellers stay in control, the market may complete the next push lower toward the 4,160–4,170 target zone.
➤ Key levels
◌ Current price area: 4,290
◌ Sell zone liquidity: 4,288–4,300
◌ Intraday resistance: 4,300–4,310
◌ Strong support: 4,254
◌ Buy scalping wave 4 zone: 4,235–4,245
◌ Main bearish target: 4,160–4,170
◌ Bearish invalidation: above 4,310
⌁ Elliott Wave view
The chart shows a bearish Elliott Wave continuation structure.
Price is struggling below the sell liquidity zone, which may be the ceiling for the current recovery attempt.
If gold cannot break above 4,300, the next move may be a decline toward 4,254.
After that, a short rebound from the 4,235–4,245 wave 4 support zone may appear.
But if the broader bearish structure stays intact, the next selling leg could extend toward 4,160–4,170 to complete the downside wave sequence.
This is why Kelly is still prioritizing the bearish scenario while price remains below resistance.
▸ Trading scenario
Preferred bearish scenario
Entry: Sell around 4,288–4,300 if price shows bearish rejection
Stop Loss: Above 4,310
Take Profit 1: 4,254
Take Profit 2: 4,235–4,245
Take Profit 3: 4,160–4,170
Alternative scenario
If gold breaks above 4,300 and holds above that zone, short-term downside pressure may weaken. In that case, price could recover higher first before sellers return.
◌ Confirmation
Bearish confirmation comes if price continues rejecting below 4,300 and breaks down through 4,254.
◌ Invalidation
The bearish view becomes weaker if gold closes above 4,310 with strong momentum. That would suggest the market is no longer respecting the current sell zone.
⌁ Kelly’s view
Kelly’s main view remains bearish while gold stays below the 4,288–4,300 liquidity zone. The chart still favors selling rallies rather than chasing buys at the current level.
If sellers defend resistance, gold may continue lower toward 4,254, then 4,235–4,245. A deeper extension could later complete near 4,160–4,170.
Do you think gold will reject directly from this sell zone, or make one more small bounce before the next leg down? Short 
XAUUSD — Bearish Channel Toward 4,175XAUUSD — Bearish Channel Toward 4,175
Gold is still moving inside a clear bearish channel after failing to reclaim the upper resistance trendline. From Kelly’s view, the chart suggests that XAUUSD remains under downside pressure, and the current recovery may only be a short correction before the next bearish wave continues.
The key idea is simple: gold is trading near the sell zone, and if buyers fail to break above this area, sellers may push price back toward lower support and the final target zone.
⟡ Market structure
Gold is currently trading around 4,333, right below the short-term sell zone near 4,335–4,350. This area is important because it sits close to the descending trendline and may act as the next rejection zone.
The broader structure is still bearish. Price is forming lower highs inside the downtrend channel, while each recovery remains limited under resistance. If gold rejects from the current sell zone, the first downside area to watch is the strong support zone around 4,285–4,300.
A clean break below this support may open the next move toward the 4,235–4,245 buy scalping area. If bearish momentum continues, the final target remains near 4,170–4,180.
➤ Key levels
◌ Current price area: 4,333
◌ Sell zone: 4,335–4,350
◌ Strong support: 4,285–4,300
◌ Buy scalping zone: 4,235–4,245
◌ Main bearish target: 4,170–4,180
◌ Bearish invalidation: above 4,360–4,380
⌁ Elliott Wave view
The chart shows a possible bearish Elliott Wave continuation.
Wave (1) may have started after price rejected from the upper channel area.
Wave (2) created a corrective rebound but failed below the downtrend resistance.
Wave (3) may now continue lower toward 4,235–4,245.
Wave (4) could create a short recovery from the buy scalping area.
Wave (5) may complete the bearish structure near 4,170–4,180.
This is why Kelly is not chasing buys at the current price. The cleaner plan is to watch the sell zone and wait for bearish confirmation before following the next downside leg.
▸ Trading scenario
Preferred bearish scenario
Entry: Sell around 4,335–4,350 if price gives bearish rejection
Stop Loss: Above 4,380
Take Profit 1: 4,285–4,300
Take Profit 2: 4,235–4,245
Take Profit 3: 4,170–4,180
Alternative entry
If gold breaks below 4,285 and retests it weakly, sellers may look for continuation toward 4,235–4,245 and then 4,170–4,180.
◌ Invalidation
The bearish view becomes weaker if gold breaks above 4,360–4,380 and holds above the descending trendline. In that case, the current bearish wave structure may be delayed, and price could attempt a stronger recovery first.
⌁ Kelly’s view
Kelly’s main view remains bearish while gold stays below the 4,335–4,350 sell zone and the descending trendline. The market is still moving inside a downward structure, so rebounds are more likely to be watched for rejection than chased as bullish continuation.
If sellers defend the sell zone, gold may continue toward 4,285–4,300, then 4,235–4,245, with the larger target near 4,170–4,180.
Do you think gold will reject from the sell zone first, or retest strong support before the next wave lower? Short 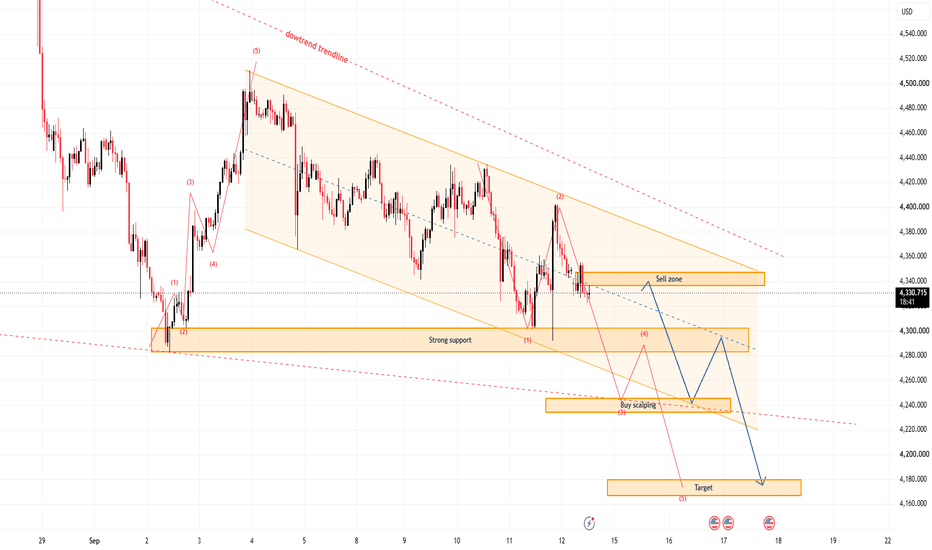
XAUUSD — Medium-Term Bearish Wave Toward 3,836
Gold is showing a medium-term bearish Elliott Wave structure after failing to recover above the descending channel resistance. From Kelly’s view, the chart suggests that XAUUSD is still moving inside a broader downside trend, and the current rebound may only be a correction before the next bearish wave continues.
The key idea is simple: gold may retest support first, then create a short recovery, but as long as price stays below the descending trendline and resistance structure, the priority scenario remains bearish for next week.
⟡ Market structure
Gold is currently trading around 4,349, still below the main descending channel. The previous bullish trendline has already been weakened, and price is now moving under bearish pressure.
The first important level to watch is the 4,282–4,300 strong support area. If gold breaks below this zone, the next downside path may open toward 4,230, then the 4,090–4,110 Buy zone wave 4.
For the medium-term structure, if sellers continue to control the market, gold may extend lower toward the final Done wave 5 area near 3,836–3,850.
➤ Key levels
◌ Current price area: 4,349
◌ Short-term resistance: 4,360–4,390
◌ Strong support: 4,282–4,300
◌ Next downside level: 4,230
◌ Buy zone wave 4: 4,090–4,110
◌ Main bearish target: 3,836–3,850
◌ Bearish invalidation: above 4,430–4,450
⌁ Elliott Wave view
The chart is showing a possible bearish continuation structure.
Wave (1) started after price rejected from the upper zone.
Wave (2) created a corrective rebound but failed below the descending resistance.
Wave (3) may now continue lower toward 4,230 and 4,096.
Wave (4) could later create a short recovery from the lower buy zone.
Wave (5) may complete the larger bearish cycle near 3,836–3,850.
This is why Kelly does not treat the current bounce as a confirmed bullish reversal. The recovery is still under resistance, and the market needs a strong breakout above the trendline before the bearish wave count becomes weaker.
▸ Trading scenario
Preferred bearish scenario
Entry: Sell on rejection around 4,360–4,390, or after price breaks below 4,282 and retests weakly
Stop Loss: Above 4,450
Take Profit 1: 4,282–4,300
Take Profit 2: 4,230
Take Profit 3: 4,090–4,110
Take Profit 4: 3,836–3,850
Alternative scenario
If gold breaks above 4,430–4,450 and holds above the descending trendline, the bearish setup becomes weaker. In that case, price may attempt a stronger recovery before the next sell setup appears.
◌ Invalidation
The bearish view becomes weaker if gold reclaims 4,430–4,450 with strong bullish momentum. A clean hold above this zone would suggest that the current downside wave is losing strength.
⌁ Kelly’s view
Kelly’s main view for next week remains bearish while gold stays below the descending channel resistance. The structure still favors selling rebounds rather than chasing buys.
If sellers break 4,282–4,300, gold may continue toward 4,230, then 4,090–4,110. The larger Elliott Wave target remains near 3,836–3,850 if bearish momentum extends.
Do you think gold will break strong support next week, or create one more rebound before wave (5) continues lower? Short 
XAUUSD — Bullish Retest Toward 4,425XAUUSD — Bullish Retest Toward 4,425
Gold is showing a short-term bullish recovery after completing the previous downside wave near the lower support area. From Kelly’s view, the current chart suggests that XAUUSD may be forming a corrective bullish structure, with price now reacting from the 4,334–4,340 buy retest support zone.
The key idea is simple: if gold holds above this support, the next recovery leg may continue toward the 4,420–4,435 strong resistance area.
⟡ Market structure
Gold recently completed a bearish 5-wave sequence and is now trying to rebuild from the lower zone. Price is trading around 4,351, slightly above the buy retest support.
The current structure looks like a possible ABC recovery. Buyers are trying to defend the 4,334–4,340 area, while the next major upside target remains the strong resistance zone near 4,420–4,435.
However, gold is still trading below the descending trendline, so the bullish setup needs confirmation. A clean move above 4,380–4,400 would strengthen the recovery and open the way toward the upper resistance.
➤ Key levels
◌ Current price area: 4,351
◌ Buy retest support: 4,334–4,340
◌ Key support: 4,300–4,315
◌ First bullish confirmation: above 4,380
◌ Main resistance: 4,420–4,435
◌ Strong breakout confirmation: above 4,435
◌ Bullish invalidation: below 4,300
⌁ Elliott Wave view
The chart suggests that the previous bearish wave may have already completed near the 4,300 area.
After that, gold started to form a short-term bullish recovery:
Wave A may be the first rebound from the low.
Wave B may be the retest into 4,334–4,340.
If this support holds, wave C may push price toward 4,420–4,435.
This is why Kelly is watching the current retest zone carefully. The bullish idea is valid only if buyers continue to defend support and price starts to break above the short-term resistance levels.
▸ Trading scenario
Preferred bullish scenario
Entry: Buy around 4,334–4,340 if price gives bullish confirmation
Stop Loss: Below 4,300
Take Profit 1: 4,380
Take Profit 2: 4,400
Take Profit 3: 4,420–4,435
Alternative entry
If gold breaks above 4,380–4,400 and retests this area as support, buyers may look for continuation toward 4,420–4,435.
◌ Invalidation
The bullish view becomes weaker if gold breaks below 4,300 and fails to recover back above the buy retest support. In that case, the recovery structure may fail and sellers could regain control.
⌁ Kelly’s view
Kelly’s main view is cautiously bullish while gold holds above 4,334–4,340. The market is showing signs of recovery, but price still needs to confirm strength above 4,380–4,400.
If buyers defend the current support, gold may continue toward 4,420–4,435, where the next key decision zone is waiting.
Do you think gold will complete wave C toward resistance, or retest the lower support one more time first? XAUUSD — Bullish Wave 3 From Buy Zone
Gold is building a bullish recovery structure after completing the previous bearish wave near the lower area. From Kelly’s view, the current chart suggests that XAUUSD may be preparing for a new upside continuation while price is holding around the Buy zone wave 3.
The key idea is simple: gold may be forming wave (2) correction now, and if buyers defend the current buy zone, wave (3) can start pushing toward the upper liquidity levels.
⟡ Market Structure
Gold reacted strongly from the previous low near 4,280–4,300, showing that sellers lost momentum and buyers started to rebuild structure.
Price is now trading around 4,411, right above the Buy zone wave 3 near 4,390–4,410. This zone is important because it may act as the base for the next bullish impulse.
If this support holds, gold may continue higher toward 4,441, 4,476, and the strong liquidity zone near 4,510. A clean break above 4,510 would strengthen the bullish continuation toward the Resistance Fibonacci + FVG / Sell zone wave 4 around 4,585–4,605.
➤ Key Levels
◌ Current price area: 4,411
◌ Buy zone wave 3: 4,390–4,410
◌ First liquidity: 4,441
◌ Second liquidity: 4,476
◌ Strong liquidity: 4,510
◌ Resistance Fibonacci + FVG: 4,585–4,605
◌ Final wave 5 target: 4,725–4,740
◌ Bullish invalidation: below 4,360
⌁ Elliott Wave View
The chart shows a possible bullish Elliott Wave recovery.
Wave (1) formed after gold bounced from the lower demand area.
Wave (2) is now correcting back into the 4,390–4,410 buy zone.
If this zone holds, wave (3) may push price toward 4,510 and then 4,585–4,605.
After that, wave (4) may create a short pullback.
The final wave (5) target remains near 4,725–4,740.
This is why Kelly is not chasing buys too late. The cleaner plan is to wait for confirmation around the buy zone, then follow the bullish structure step by step.
▸ Trading Scenario
Preferred bullish scenario
Entry: Buy around 4,390–4,410 if price gives bullish confirmation from the Buy zone wave 3
Stop Loss: Below 4,360
Take Profit 1: 4,441
Take Profit 2: 4,476–4,510
Take Profit 3: 4,585–4,605
Take Profit 4: 4,725–4,740
Alternative entry
If gold breaks above 4,510 and retests this level as support, buyers may look for continuation toward 4,585–4,605.
◌ Invalidation
The bullish view becomes weaker if gold breaks below 4,360 and fails to reclaim the buy zone. In that case, wave (2) may extend lower and the bullish setup needs more confirmation.
⌁ Kelly’s View
Kelly’s main view remains bullish while gold holds above 4,390–4,410. The market is showing a recovery structure, and the current pullback may be only a correction before wave (3) continues higher.
If buyers defend the buy zone, gold may continue toward 4,441, 4,510, then the larger upside zone around 4,585–4,605. The bigger Elliott target remains near 4,725–4,740.
Do you think gold will start wave (3) from this buy zone, or retest lower before the next rally? Long 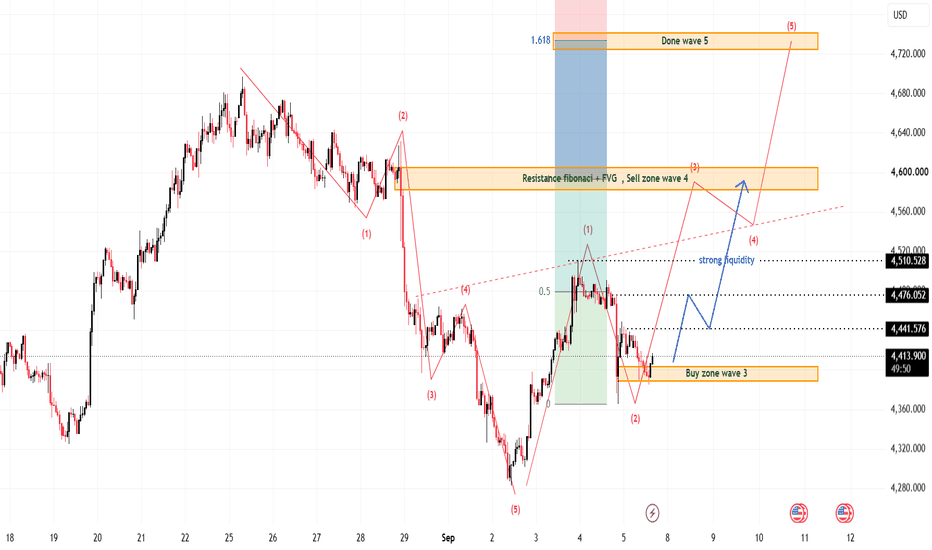
 Long
Long
XAUUSD — Bullish Setup From 4,425XAUUSD — Bullish Setup From 4,425
Gold is building a bullish recovery structure after completing the previous bearish wave 5 near the lower demand zone. From Kelly’s view, the current chart suggests that XAUUSD may be preparing for another upside leg if buyers continue to defend the End wave C / Buy zone.
The key idea is simple: gold may correct slightly first, but as long as price holds above the buy zone, the bullish structure remains valid toward the upper liquidity area.
⟡ Market Structure
Gold reacted strongly from the 4,280–4,300 area, where the previous downside wave appears to have completed. After that, price created a new bullish impulse and is now consolidating around 4,472–4,488.
The most important support is the 4,420–4,430 Buy zone. This zone is marked as the potential end of wave C. If price pulls back into this area and buyers defend it, gold may start a new bullish wave.
The first confirmation area is around 4,488–4,500. A clean break above this zone would support stronger upside continuation toward 4,525–4,550, then the major liquidity target near 4,615–4,630.
➤ Key Levels
◌ Current price area: 4,472–4,488
◌ End wave C / Buy zone: 4,420–4,430
◌ Bullish confirmation: above 4,500
◌ First upside target: 4,525–4,550
◌ Main liquidity target: 4,615–4,630
◌ Bullish invalidation: below 4,400
⌁ Elliott Wave View
The chart shows that the previous bearish wave 5 may have already completed around 4,280–4,300.
From that low, gold is now forming a new recovery structure. The current pullback may be part of an ABC correction before the next bullish wave develops.
If wave C ends around 4,420–4,430, buyers may push price higher again. The next upside sequence can target 4,500, then 4,550, and finally the liquidity zone around 4,615–4,630.
This is why Kelly is not chasing buys at the current price. The cleaner plan is to wait for price to confirm support or break above the short-term liquidity level.
▸ Trading Scenario
Preferred bullish scenario
Entry: Buy around 4,420–4,430 if price gives bullish confirmation from the End wave C / Buy zone
Stop Loss: Below 4,400
Take Profit 1: 4,500
Take Profit 2: 4,525–4,550
Take Profit 3: 4,615–4,630
Alternative entry
If gold breaks and holds above 4,500, buyers may look for continuation toward 4,525–4,550 without waiting for a deeper pullback.
◌ Invalidation
The bullish view becomes weaker if gold breaks below 4,400 and fails to reclaim the buy zone. In that case, the recovery structure may need more correction before a new bullish setup appears.
⌁ Kelly’s View
Kelly’s main view is bullish while gold holds above 4,420–4,430. The market has already reacted strongly from the lower demand area, and the current movement looks more like a correction before continuation.
If buyers defend the buy zone and price breaks above 4,500, gold may continue toward 4,550 and the main liquidity zone near 4,615–4,630.
Do you think gold will retest the buy zone first, or break above 4,500 directly? Long 
XAUUSD — Elliott Wave Recovery From 4,286 XAUUSD — Elliott Wave Recovery From 4,286
Gold is showing a strong Elliott Wave recovery after completing the previous bearish wave 5 near the 4,286–4,300 demand area. From Kelly’s view, the current chart suggests that XAUUSD has shifted into a short-term bullish correction structure, but price is now approaching an important Fibonacci sell zone where a pullback may appear first.
The key idea is simple: gold may push higher to complete the current upside wave, then correct into the buy zone before continuing toward the next higher Fibonacci target.
⟡ Market Structure
Gold reacted strongly from the done wave 5 area near 4,286–4,300, showing that buyers defended the lower liquidity zone. After that reaction, price built a bullish impulse and is now trading around 4,437.
The current upside structure looks like a developing 5-wave recovery. Price may still have room to test the 4,475–4,490 area, marked as the Done wave 5 / Sell zone Fibonacci. This zone is important because buyers may take profit there, and a short ABC correction can appear.
If price rejects from this Fibonacci zone, the next clean support to watch is the End wave C / Buy zone around 4,385–4,395. If this zone holds, gold may start another bullish leg toward the upper target near 4,520–4,530.
➤ Key Levels
◌ Current price area: 4,437
◌ Done wave 5 / Sell zone Fibonacci: 4,475–4,490
◌ Upper Fibonacci target: 4,520–4,530
◌ End wave C / Buy zone: 4,385–4,395
◌ Strong lower support: 4,286–4,300
◌ Bullish invalidation: below 4,365
⌁ Elliott Wave View
The chart suggests that the previous bearish wave 5 may have already completed around 4,286–4,300.
From that low, gold appears to be building a new bullish recovery:
Wave (1) started from the lower demand zone.
Wave (2) corrected back but held above the recent low.
Wave (3) pushed price higher with stronger momentum.
Wave (4) may create a short pullback.
Wave (5) could finish near 4,475–4,490.
After wave (5) completes, gold may form an ABC correction into 4,385–4,395 before buyers try to continue toward 4,520–4,530.
▸ Trading Scenario
Preferred bullish scenario
Entry: Buy around 4,385–4,395 if price gives bullish confirmation from the End wave C / Buy zone
Stop Loss: Below 4,365
Take Profit 1: 4,475–4,490
Take Profit 2: 4,520–4,530
Alternative scenario
If gold breaks above 4,490 and holds above this zone, the bullish structure may continue directly toward 4,520–4,530 without a deep correction.
◌ Invalidation
The bullish recovery becomes weaker if gold breaks below 4,365 and fails to reclaim the buy zone. In that case, the ABC correction may extend lower, and the bullish continuation setup needs to be delayed.
⌁ Kelly’s View
Kelly’s main view is bullish after the strong reaction from 4,286–4,300, but buying directly into the Fibonacci sell zone is not the cleanest plan.
The better setup is to wait for price to complete the current wave near 4,475–4,490, then watch for an ABC pullback into 4,385–4,395. If buyers defend that zone, gold may continue toward 4,520–4,530.
Do you think gold will complete wave (5) first, or correct into the buy zone before the next rally? Long 
XAUUSD — Bearish Wave 5 Toward 4,286
Gold is still trading inside a bearish Elliott Wave structure after the strong selloff from the upper area. From Kelly’s view, the current chart suggests that XAUUSD may be forming a wave (4) correction under resistance before continuing lower into wave (5).
The key idea is simple: gold is still below strong resistance, and if buyers fail to reclaim the upper zone, the next bearish target remains around 4,286.
⟡ Market Structure
Gold is currently trading around 4,429, right near the upper side of the FVG support area. After the sharp drop, price has been moving sideways and building a small corrective structure.
The important resistance zone is around 4,455–4,470. This area may act as the wave (4) rejection zone. If price cannot break above it, sellers may continue to control the short-term structure.
Below the current price, the key support is near 4,397. If gold breaks below this level, the bearish wave (5) scenario becomes stronger, opening the way toward the lower liquidity area around 4,286–4,300.
➤ Key Levels
◌ Current price area: 4,429
◌ Strong resistance / wave (4): 4,455–4,470
◌ FVG support zone: 4,365–4,430
◌ Key support: 4,397
◌ Main bearish target: 4,286–4,300
◌ Extended support zone: 4,270–4,310
◌ Bullish invalidation: above 4,507
⌁ Elliott Wave View
The chart is showing a possible bearish 5-wave sequence.
Wave (1) started after the first rejection from the top.
Wave (2) created a recovery bounce but failed to make a stronger continuation.
Wave (3) pushed sharply lower into the FVG support zone.
Wave (4) is now forming as a sideways correction below resistance.
If sellers reject this area again, wave (5) may continue lower toward 4,286–4,300.
This is why Kelly is not chasing buys at the current level. The cleaner plan is to wait for rejection below resistance or a confirmed breakdown below 4,397.
▸ Trading Scenario
Preferred bearish scenario
Entry: Sell around 4,455–4,470 if price gives bearish rejection from strong resistance
Stop Loss: Above 4,507
Take Profit 1: 4,397
Take Profit 2: 4,340–4,320
Take Profit 3: 4,286–4,300
Alternative entry
If gold breaks below 4,397 with strong bearish momentum, sellers may look for continuation toward 4,286 without waiting for a deeper pullback.
◌ Invalidation
The bearish view becomes weaker if gold breaks above 4,507 and holds above that level. In that case, the wave (4) correction may extend higher and the wave (5) downside setup would need to be delayed.
⌁ Kelly’s View
Kelly’s main view remains bearish while gold stays below the strong resistance zone. The current movement still looks more like a correction than a real bullish reversal.
If price rejects 4,455–4,470 or breaks below 4,397, gold may continue the wave (5) move toward 4,286–4,300.
Do you think gold will complete wave (5) first, or will buyers try to defend the FVG support again? Short 
 Long
Long
XAUUSD — Wave 4 Rebound Before Wave 5XAUUSD — Wave 4 Rebound Before Wave 5
Gold is showing a clear bearish Elliott Wave structure after the strong rejection from the upper area near 4,620–4,640. From Kelly’s view, the current chart suggests that XAUUSD may have already completed wave (3) into the 4,400–4,425 zone, and the market could now build a corrective wave (4) before continuing lower into wave (5).
The key idea is simple: gold may rebound first, but as long as the recovery stays below the sell FVG zone, the larger short-term structure still favors another bearish leg.
⟡ Market Structure
Price is currently trading around 4,421, right inside the Resistance Fibonacci wave 4 area. This zone is important because it may decide whether gold continues lower immediately or makes a temporary recovery first.
The recent selloff was strong and impulsive, which supports the idea that sellers are still controlling the market. However, after such a sharp drop, a short correction toward the upper FVG area is possible before the next bearish continuation.
The main sell reaction zone on the chart sits around 4,500–4,530, marked as the FVG Sell wave 5 area. If gold rebounds into this zone and fails to break higher, sellers may step in again for the next downside move.
➤ Key Levels
◌ Current price area: 4,421
◌ Resistance Fibonacci wave 4: 4,400–4,425
◌ FVG Sell wave 5 zone: 4,500–4,530
◌ Key sell reaction level: 4,507
◌ Main downside target: 4,280–4,300
◌ End wave 5 level: around 4,286
◌ Bullish invalidation: above 4,540
⌁ Elliott Wave View
The chart is showing a bearish 5-wave sequence.
Wave (1) formed after the first rejection from the top.
Wave (2) created a corrective rebound near 4,620–4,640.
Wave (3) pushed strongly lower into the 4,400–4,425 Fibonacci zone.
Wave (4) may now create a corrective rebound toward 4,500–4,530.
If that zone rejects price, wave (5) may continue lower toward 4,280–4,300.
This is why Kelly is not chasing sells at the current low. The cleaner setup is to wait for either a weak rebound into the sell FVG zone or a clear breakdown below the current support structure.
▸ Trading Scenario
Preferred bearish scenario
Entry: Sell around 4,500–4,530 if price gives bearish rejection from the FVG Sell wave 5 zone
Stop Loss: Above 4,540
Take Profit 1: 4,400–4,425
Take Profit 2: 4,340–4,320
Take Profit 3: 4,280–4,300
Alternative entry
If gold fails to recover and breaks below 4,400 with strong bearish momentum, sellers may look for continuation toward 4,286 without waiting for a deeper pullback.
◌ Invalidation
The bearish view becomes weaker if gold breaks above 4,540 and holds above the FVG sell zone. In that case, the wave (4) correction may extend higher and the wave (5) downside scenario would need to be delayed.
⌁ Kelly’s View
Kelly’s main view remains bearish, but not to sell blindly at the current price. Gold is sitting near an important Fibonacci reaction zone, so a short rebound can happen first.
If price pulls back into 4,500–4,530 and rejects, the bearish wave 5 setup becomes cleaner, with the main target near 4,280–4,300.
Do you think gold will retest the FVG sell zone first, or continue directly toward wave (5)? Short 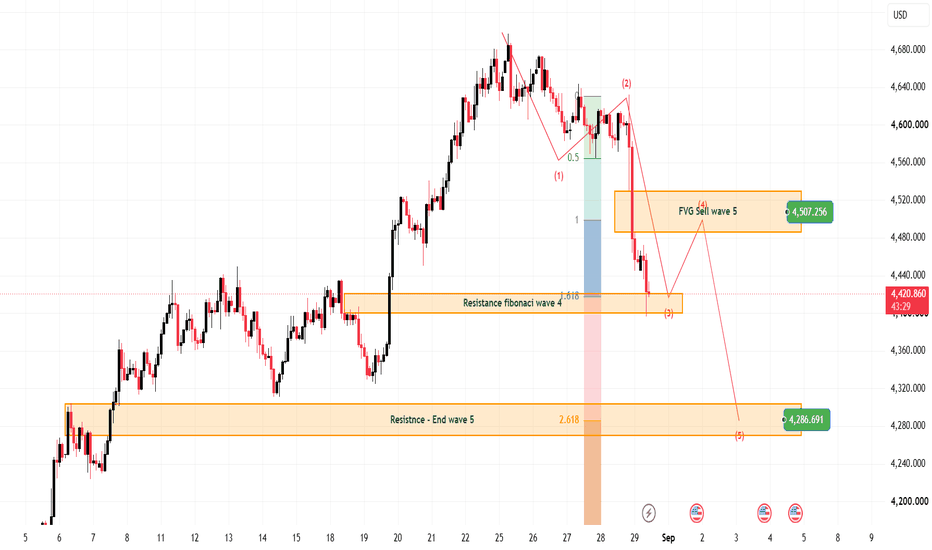
XAUUSD — Bearish Structure Below 4,600XAUUSD — Bearish Structure Below 4,600
Gold is starting to lose upside momentum after rejecting from the upper side of the rising channel. From this chart, the latest rebound still looks corrective, which keeps the short-term bias tilted to the downside and supports the idea of one more bearish leg.
⟡ Market structure
Price previously advanced inside an ascending channel, but after peaking near the upper boundary, momentum faded and the market began to print a weaker lower-high sequence. The Elliott Wave structure on the chart suggests wave (3) has already pushed down, wave (4) is forming as a recovery bounce, and wave (5) may still develop lower if sellers stay in control.
The first important reaction area is around 4,579–4,585, which is acting as a key decision zone. Below that, the next liquidity level sits near 4,564.602. If this level breaks cleanly, gold could continue toward the 4,520–4,525 area, where the chart marks the projected Elliott wave 5 completion and Fibonacci 1.618 target.
➤ Key levels
◌ Current price area: 4,598
◌ Reaction / decision zone: 4,579–4,585
◌ Liquidity support: 4,564.602
◌ Main bearish target: 4,520–4,525
◌ Extension target if selling accelerates: around 4,433
◌ Invalidation resistance: 4,630–4,640
⌁ Trading scenario
Entry: Sell on bearish rejection around 4,598–4,605, or after price drops back below 4,585 and retests it weakly.
Stop Loss: Above 4,640
Take Profit 1: 4,564.602
Take Profit 2: 4,520–4,525
Take Profit 3: around 4,433 if wave 5 extends further
This setup stays valid while gold remains capped below the recent lower-high area and fails to reclaim bullish momentum.
◌ Invalidation
If buyers push price back above 4,630–4,640 and hold there, the bearish wave count becomes weaker. In that case, the current downside scenario may be delayed or invalidated.
▸ Final view
Kelly’s main view remains bearish for now. The chart still supports a corrective bounce first, followed by another move lower toward liquidity and the projected wave 5 completion zone. As long as gold stays below the recent swing-high resistance, rallies are still more likely to be sold than chased higher.
Do you think gold will complete wave (5) first, or can buyers defend the structure and force a stronger recovery? Short 
XAUUSD – Bearish Wave Toward 4,500XAUUSD – Bearish Wave Toward 4,500
Gold is showing a short-term bearish Elliott Wave structure after failing to extend higher from the recent top. From Kelly’s view, price is now reacting under the wave 3 sell zone, which keeps the downside scenario active. If sellers stay in control, gold could continue lower, first into the liquidity buy zone, then deeper toward the end wave 5 area.
⟡ Market Structure
The current structure suggests gold may be building a fresh downside leg after the rejection near the upper resistance area. Price is now trading around 4,631, while the chart still shows pressure below the 4,638–4,646 sell zone.
As long as gold remains below this zone, the bearish wave sequence stays valid. The first area to watch on the downside is the dotted support near 4,595. If that level gives way, price may continue toward the 4,565–4,578 liquidity zone, where a short corrective bounce could appear before the next leg down.
If the bearish structure continues cleanly, the final downside target remains the 4,498–4,505 end wave 5 zone.
➤ Key Levels
◌ Current price: 4,631
◌ Sell zone wave 3: 4,638–4,646
◌ Intermediate support: 4,595
◌ Buy zone liquidity: 4,565–4,578
◌ End wave 5 target: 4,498–4,505
⌁ Trading Scenario
Primary bearish scenario
Entry: Sell around 4,638–4,646
Stop Loss: Above 4,655
Take Profit 1: 4,595
Take Profit 2: 4,565–4,578
Take Profit 3: 4,498–4,505
This setup follows the idea that gold is still moving inside a bearish wave sequence. A break below 4,595 would strengthen the move toward the lower liquidity area, and a deeper selloff could complete wave 5 near 4,500.
◌ Invalidation
The bearish view becomes weaker if gold reclaims and holds above 4,646–4,655, because that would suggest the current wave-down structure is failing and buyers are regaining control.
▸ Final View
For now, Kelly’s preferred view stays bearish. Gold is still trading under the wave 3 sell zone, so the path of least resistance remains lower unless buyers can reclaim resistance. The cleaner plan is to watch for rejection around the sell zone, then follow the move toward 4,595, 4,565–4,578, and potentially 4,498–4,505.
Do you think gold will complete wave 5 this week, or will buyers defend the liquidity zone first? Short 
XAUUSD: Bearish ABC Correction From Sell Zone
Gold is still trading inside a strong higher-timeframe recovery, but the current short-term structure is showing correction risk. From Kelly’s view, price has reacted near the upper area after completing a bullish wave, and the next move may develop as an ABC pullback before buyers return again.
The key idea is simple: gold may rise slightly first into the sell zone, then continue lower to complete wave C.
⟡ Market structure
Gold is currently trading around 4,636 after rejecting from the upper resistance area. The chart shows price is holding below the 4,650–4,665 Sell wave B zone, while the stronger bullish confirmation is still far above near 4,697.
As long as gold stays below this resistance, the short-term structure favors a corrective move lower.
The first support to watch is 4,618. If this level breaks, price may continue towards the buy scalping zones around 4,600–4,610 and 4,570–4,580. The deeper target is the End wave C zone around 4,535–4,545.
➤ Key levels
◌ 4,650–4,665: Sell wave B zone
◌ 4,636: current price area
◌ 4,618: strong support
◌ 4,600–4,610: first buy scalping area
◌ 4,570–4,580: second buy scalping area
◌ 4,535–4,545: End wave C target zone
◌ 4,697: bullish confirmation / invalidation area
⌁ Elliott Wave view
Gold may have completed a short-term bullish wave 5 near the recent high. After that, the current move is likely forming an ABC correction.
Wave A may be the first decline from the top.
Wave B may retest the 4,650–4,665 resistance zone.
Wave C may continue lower towards 4,535–4,545 if sellers remain in control.
This means Kelly is not chasing buys near the current price. The cleaner view is to wait for price reaction at resistance and follow the corrective structure lower.
▸ Trading scenario
Preferred scenario: wait for gold to retest the Sell wave B zone and show bearish confirmation.
Sell zone: 4,650–4,665
Stop loss: above 4,697
Take profit 1: 4,618
Take profit 2: 4,570–4,580
Take profit 3: 4,535–4,545
Alternative scenario: if gold breaks above 4,697 and holds strongly, the bearish ABC correction may fail. In that case, the market may continue the bullish structure instead of dropping into wave C.
⌁ Kelly’s view
For Kelly, the main short-term scenario is bearish correction. Gold is still near resistance, and the ABC structure is not complete yet.
If 4,650–4,665 holds as resistance, gold may continue lower towards 4,618 first, then 4,535–4,545 to complete wave C.
Share your view below. Short 
XAUUSD — 4,591 Breakout, 4,646 Next Test?
Gold is showing a very strong bullish structure after breaking above the previous resistance area.
Price is now trading around 4,590 - 4,600, right above the 1.0 Fibo zone near 4,591.
This is a powerful breakout.
But after a strong move, I still do not want to chase the candle blindly.
The simple read
The key level now is 4,591.
If gold holds above 4,591, buyers may try to continue toward the next Fibo extension zone around 4,646.
That 4,646 area is important because it can become the first major sell reaction / profit-taking zone.
If momentum stays strong above 4,646, the medium-term upside area near 4,735 becomes the next zone to watch.
But if gold fails to hold above 4,591, a pullback can appear first.
The first buy retest area is around 4,572 - 4,557.
Below that, the stronger buy zone sits around 4,531 - 4,539.
Key price zones
Current price area: 4,590 - 4,600
Breakout confirmation zone: 4,591
First buy retest zone: 4,572 - 4,557
Main buy zone: 4,531 - 4,539
Previous resistance support: 4,450
First Fibo extension target: 4,646
Medium-term goal: 4,735
Trading plan
Bullish continuation scenario
If gold holds above 4,591:
The breakout structure remains strong.
Price may continue toward 4,646 first.
If 4,646 breaks with confirmation, the next upside area becomes 4,735.
Pullback buy scenario
If gold pulls back from the current price:
I will watch 4,572 - 4,557 first.
A clean reaction from this area may support another bullish continuation attempt.
If this zone fails, 4,531 - 4,539 becomes the deeper buy reaction zone.
Resistance reaction scenario
If gold reaches 4,646:
I will watch price action carefully.
This is a Fibo extension zone, so the market may slow down or reject before choosing the next move.
No rejection = no forced sell.
Tiara’s View
Gold is bullish, but the market is now moving after a strong breakout.
4,591 is the level buyers need to protect.
4,646 is the next major reaction zone.
4,572 - 4,557 is the first retest area.
4,531 - 4,539 is the deeper buy zone.
The clean plan is simple:
Do not chase the breakout late.
Wait for 4,591 to hold.
Or wait for the retest reaction.
Reaction first.
Confirmation second.
Trade last.
No confirmation = no trade.
Do you think gold can hold above 4,591 and push toward 4,646, or will the market retest 4,572 first?
Long 
XAUUSD — 4,500 Is the Gate to 4,650?🌸 XAUUSD — 4,500 Is the Gate to 4,650?
Gold is showing a strong bullish structure after breaking above the previous resistance zone.
The market pushed sharply from the lower support area and is now trading around 4,480 - 4,500, right under the short-term breakout line.
This is where the chart becomes very interesting.
The trend is bullish.
But after a strong move, I still do not want to chase the candle.
I want to see if buyers can defend the new structure.
The simple read
4,500 is the first important gate today.
If gold breaks and holds above 4,500, buyers may try to push price toward the weekly high around 4,524 - 4,527.
That area is important because it aligns with the 1.618 Fibo reaction zone.
If momentum remains strong above 4,527, the medium-term target zone around 4,650 becomes the next major area to watch.
But if gold fails to hold above 4,500, a pullback may appear first.
The key buy zone is around 4,475 - 4,490.
If buyers defend this OB area, the bullish continuation plan remains healthy.
Below that, 4,450 is the previous resistance zone and can become an important retest support.
Key price zones
Current price area: 4,480 - 4,500
Breakout gate: 4,500
Weekly high / Fibo reaction: 4,524 - 4,527
Medium-term goal: 4,650
Buy zone OB: 4,475 - 4,490
Retest support: 4,450
Bullish continuation improves above: 4,500
Short-term structure weakens below: 4,450
Trading plan
Bullish continuation scenario
If gold breaks and holds above 4,500:
The bullish structure becomes stronger.
Price may continue toward 4,524 - 4,527 first.
If buyers keep control above that area, 4,650 becomes the medium-term reaction target.
Pullback buy scenario
If gold rejects from 4,500:
I will watch the 4,475 - 4,490 buy zone.
A clean reaction from this area may support another bullish attempt.
If this zone fails, 4,450 becomes the next important support to watch.
Deeper retest scenario
If 4,450 breaks clearly:
Gold may need more correction before the next bullish setup.
In that case, I would wait for a new reaction instead of forcing entries.
Tiara’s View
Gold is bullish, but the market is now near a breakout gate.
4,500 is the key level.
4,524 - 4,527 is the first upside reaction zone.
4,650 is the medium-term goal if buyers keep control.
4,475 - 4,490 is the first buy zone to defend.
The clean plan is simple:
Do not chase the top.
Wait for 4,500 confirmation.
Or wait for the OB buy zone reaction.
Reaction first.
Confirmation second.
Trade last.
No confirmation = no trade.
Do you think gold can break 4,500 and open the road toward 4,650, or will it retest the buy zone first?
Long 
 Long
Long