Novartis is back in an ascending trend after a false breakout
Technical Analysis of Novartis
Note: Technical analysis is a forecast of future price movements, and price momentum indicators change over time.
Novartis is trading within an ascending trend channel, which is supported to some extent by the moving averages, RSI 21 and volume. The share price is now above a red Ichimoku cloud. According to the indicator's current projection, the cloud is expected to turn green around November 25.
On September 8, the share price broke down from a REC and the t
R&S Group Holding AG Pref Class AE Swiss Exchange1. General Overview
Ticker: R&S Group Holding AG Pref Class A
Exchange: SIX Swiss Exchange
Current Price: 18.63 CHF (as of the chart's timestamp: Oct 31, 2026)
Timeframe: 1 Day (1D)
Current Daily Change: -0.56 CHF (-2.92%), indicating continued bearish pressure.
Primary Tool: An automated Elliott Wave counting indicator (evident from the wave labels, forecast boxes, and the data panel on the right).
2. Elliott Wave Analysis
The system indicates that a Bearish Impulse wave structure has rec
Ticker: Huber + Suhner AGE Swiss Exchange1. General Overview
Ticker: Huber + Suhner AG
Exchange: SIX Swiss Exchange
Current Price: 161.2 CHF (as of the chart's timestamp: Oct 31, 2026)
Timeframe: 1 Day (1D)
Current Daily Change: -7.6 CHF (-4.50%), indicating a strong bearish session pushing the price down toward the recent lows.
Primary Tool: An automated Elliott Wave counting indicator (evident from the wave labels, forecast boxes, and the data panel on the right).
2. Elliott Wave Analysis
The system identifies a completed Beari
Richemont — Sell Side | 150Richemont is developing a bearish price configuration, with the current structure pointing toward a potential decline to the 150 level. The recent market behavior suggests that upside momentum is losing strength, creating room for a broader downside phase.
The selling setup is focused on a deterioration in price structure, where continued weakness could allow sellers to progressively move the stock into lower territory. Rather than treating the decline as a short-lived pullback, the broader tec
Nestlé: In the Target ZoneShortly after Nestlé reached our green Target Zone (CHF 76.47–CHF 73.58), the price initially recovered. However, the stock soon came under downward pressure again and recently slipped deeper into our zone. In our primary scenario, we anticipate a bottom within our green Target Zone (CHF 76.47–CHF 73.58). We then expect the uptrend to continue past resistance at CHF 91.72. Alternatively, the stock could imminently slide further to the downside. If the price falls below support at CHF 69.90, it w
Nestlé — Bullish Buying Setup | Target 90Nestlé is maintaining a constructive bullish structure, with buyers showing increasing influence across the current price action. The buy-side setup is focused on a potential continuation toward the 90 target, which remains the primary upside objective. 📈🔥
The analysis is based on the broader market structure, momentum and signals generated through my trading methodology. Rather than focusing on short-term fluctuations, the setup is built around the developing directional bias and the possibili
Partners Group: Deeply Oversold, Cheapening Fast — But the Turn Partners Group Holding ( SIX:PGHN ) has undergone a major valuation reset.
After trading above CHF 1,400 in 2025, the stock has fallen into the CHF 700–750 area. That brings it close to levels not seen since the 2022 correction — while the underlying business remains fundamentally attractive.
Partners Group is one of Europe’s leading private-markets asset managers, investing across private equity, private debt, infrastructure and real estate. Its economics are driven largely by recurring manag
PGHN: Record fundraising & Redemption Pressure: A Bottom to watcSIX:PGHN has fallen from above CHF 1,600 to around CHF 730, a drawdown of roughly 55%.
That reset is becoming interesting: fundraising remains strong, the valuation has compressed sharply, and monthly momentum is deeply oversold.
But the Master Buy Scanner V2 still says WATCH.
Master Buy Scanner V2 — Monthly
Score: 2/3
Action: WATCH
BUY state: NO EVENT
Entry quality: OK — 50%
Position size: NONE — 0%
WT cross: NO
Band 1: RED
Combined: GREEN 7/10
Bands synchronized: NO
Cycle: ACTIVE
WT1 / WT2
Kuehne Raised Its Guidance: Why Does My Scanner Still Say WATCHKuehne+Nagel International ( SIX:KNIN ) has just reported a strong second quarter, raised its full-year earnings guidance and confirmed that its operational recovery is gaining momentum.
The stock has also rebounded from approximately CHF 160 to above CHF 200.
This sounds bullish—so why does my Master Buy Scanner V2 currently recommend a 0% position?
Because a strong company and an attractive entry are not necessarily the same thing.
The scanner detected the recovery near the bottom. Seven m
ABBN | The $100 Trillion Automation OpportunityA Global Automation Leader Positioned for the AI Industrial Revolution
ABB Ltd is one of the world’s leading industrial technology companies, specializing in electrification, automation, robotics, and motion technologies. The company operates at the intersection of several powerful long term trends, ai, industrial automation, renewable energy, electric vehicles, and smart manufacturing.. As companies worldwide invest heavily in improving efficiency and reducing labor costs, ABB is positioned a
UBS Warns of Increasing Market FragilityUBS Warns of Increasing Market Fragility Despite Calm VIX as Earnings Season Begins
[/b ]Ion Jauregui – Analyst at ActivTrades
The apparent stability reflected by the VIX volatility index may be concealing an increase in risk in the U.S. equity market, according to a UBS report, which warns of elevated dispersion among individual stocks at a time when the corporate earnings season is beginning. The Swiss bank said that its proprietary Turbu-lens indicator has reached a level of 0.9, its highes
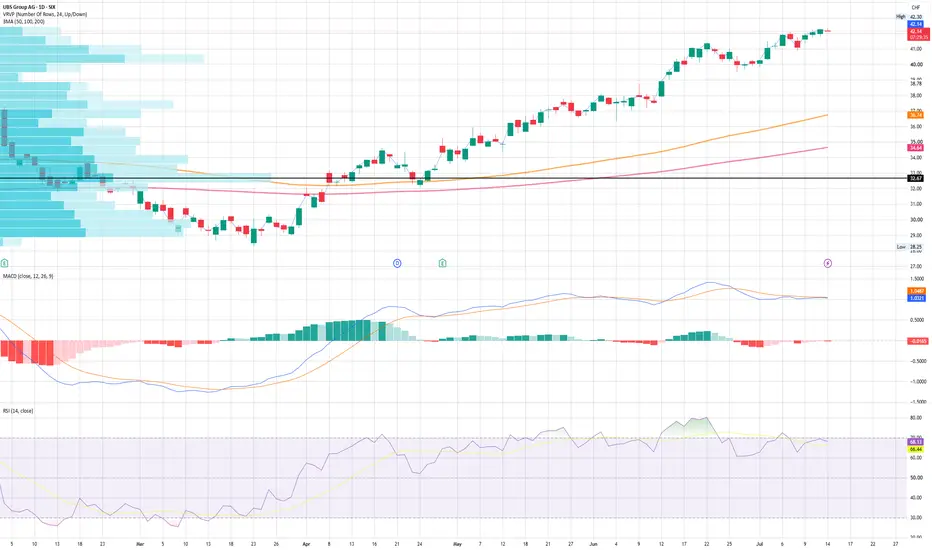
UBS: The Coil Before the Spring (Quality FInancial)UBSG (UBS Group AG) - Resistance Turned Launchpad: A Multi-Year Technical Setup
Timeframe: 1W (Weekly) | Exchange: SIX Swiss Exchange | Bias: Bullish
OVERVIEW
UBS Group AG is presenting one of the most technically compelling setups in European financials right now. A multi-year ascending channel, a critical resistance-turned-support test at CHF 33, a Bollinger Band bounce from the lower band now testing the middle basis, and a MACD trajectory pointing toward a bullish cross are all convergin
CSW Industrials (CSWI): A High-Quality Compounder That CurrentlyExecutive Summary:
Margin-of-safety verdict: CSWI appears to be a high-quality niche industrial compounder, but current valuation suggests the stock trades materially above conservative intrinsic value estimates, leaving little downside protection for long-term investors.
CSW Industrials is a specialized industrial manufacturer focused on HVAC, plumbing, coatings, sealants, lubricants, and maintenance consumables used throughout the repair, renovation, and maintenance economy. Over the past dec
Nestlé: RangeboundNestlé shares have continued to trade sideways recently. Within the current range, the stock initially gained ground, but in recent days, it has come under increasing downward pressure. We expect the upward move to continue, pushing above resistance at CHF 91.72. After that, a significant sell-off is likely. Alternatively, the stock could soon continue its slide. If it falls below support at CHF 69.90, it may initially set a new low before the anticipated upward move occurs (probability: 36%).
GEBN - 9 months HEAD & SHOULDERS══════════════════════════════
Since 2014, my markets approach is to spot
trading opportunities based solely on the
development of
CLASSICAL CHART PATTERNS
🤝Let’s learn and grow together 🤝
══════════════════════════════
Hello Traders ✌
After a careful consideration I came to the conclusion that:
- it is crucial to be quick in alerting you with all the opportunities I spot and often I don't post a good pattern because I don't have the opportunity to write down a proper didactical comment;
- sin
Nestle (Don't miss out)Nestlé has broken out of the falling wedge pattern on both the price chart and the MACD. On the MACD, it successfully retested the previous resistance level, which has now turned into support, and has since proceeded to form higher highs and higher lows, a clear sign of strengthening momentum.
Based on this technical confirmation, we are officially initiating coverage of Nestlé as a Buy, with the expectation that it can deliver strong long-term returns.
For a deeper explanation of why we selec
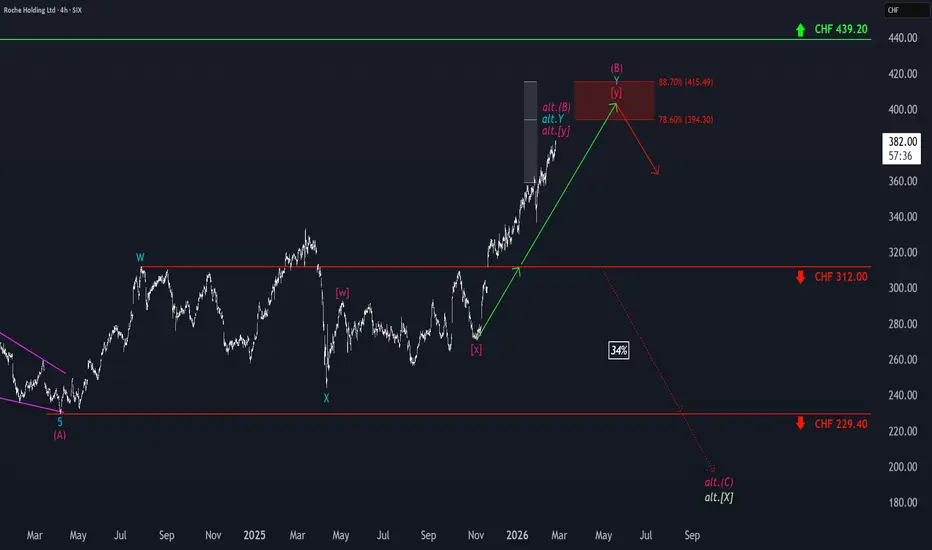
Roche Holding: Further UpwardRoche Holding shares have recently continued to rise. In our primary scenario, we see price continuing to head toward our red Short Target Zone between CHF 394.30 and CHF 415.49. We expect the magenta wave (B) to peak within this zone. We then anticipate a significant downward movement in the form of the subsequent wave (C). Alternatively, however, there is a chance that price will sell off significantly beforehand. In this case, the stock would fall directly below the support level at CHF 312.0
Nestlé NESN Daily Levels: Defensive Giant Leaning Into CoffeeNestlé S.A. on the SIX (NESN) is holding up as a classic defensive play while management pivots harder into four higher‑growth pillars: coffee, pet care, nutrition, and food & snacks, aiming to re‑accelerate real internal growth from around 0.7% in 2025 toward 2% in 2026 with a modest EBIT margin recovery.
With inflation headwinds expected to ease and rate‑cut expectations supporting demand for stable dividend payers, I’m focusing on daily support and resistance bands as areas to position with
Nestle SHOULD be in your portfolio!!!Nestlé has traded within a well-defined ascending channel since 2001, respecting both support and resistance with remarkable consistency over multiple market cycles. Recently, the stock lost support and broke below the rising channel, transitioning into a falling wedge formation, a pattern that is historically bullish, with an approximate 70% probability of an upside breakout.
At present, Nestlé is trading near the Value Area High (VAH) on the Volume Range Visible Profile (VRVP), a level that o
Nestlé is showing accumulation signs. Uptrend starting?SIX:NESN or NASDAQ:NESR is showing accumulation signs. Volume rise is not where I'd want to see it yet. But nevertheless with geopolitical turmoil going on investing in behemoths like Nestlé, especially using Swiss Francs, seems like a solid choice.
Furthermore a continued downtred seems to be coming to an end here with increased volatility and whipsaw, often used to shake-out traders. For further confirmation I'd like to see this move back to the top of the range. Ideally this will give a c
SMG turns up?It seems like SMG broke the first two resistances.
In green the support area which I oversaw in the previous idea.
If SMG now moves above the white/orange box, the first levels to look out for in the new red box. This doesnt mean that it will end its way up there, but it could have the first major reaction inside that box. Meaning slow down or break a bit down with still the potential for stronger moves upside.