

 Long

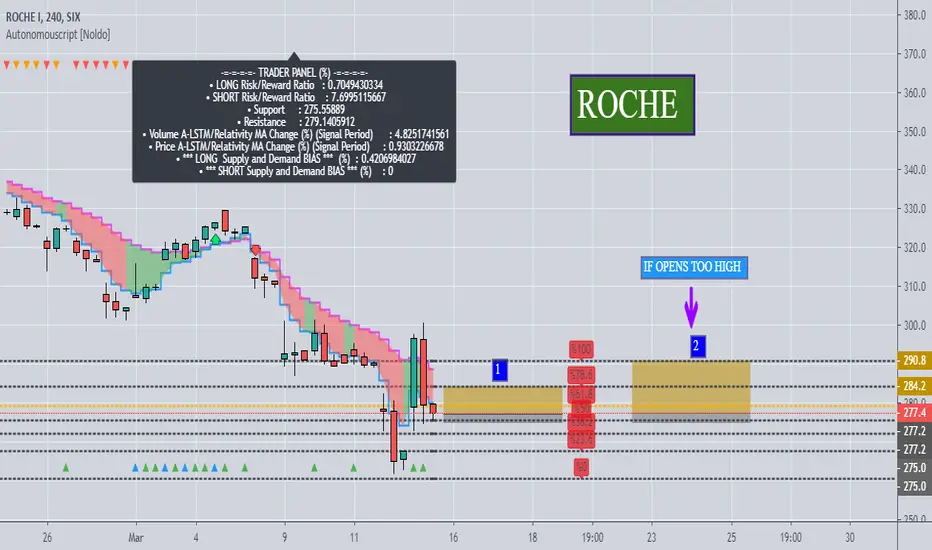
RO Long : +% 2.53 - % 4.91Parameters :
Position Size : %1
Risk/Reward Ratio : 3
Stop-Loss : 275
Goal : 284.2
*** NOTE : If opens too high , Goal is 290.8.
 Long
ADECCO big pictureFor those who are interested in this Swiss share I provide a big picture so you can get the best entry (buy zone in green) and exit (sell zone in red). Good luck!
 Short

AMS Stock - Looking nastyA family member asked me, if he shall buy AMS at 38$.
My first look at the chart was just a "WOW", what an incredibly massive Head and Shoulders. I told him to short the market rather than longing it.
And what I recently understood... Even though people are able to short the market, people just love to long the markets and they mostly dislike to short it... Must be something with human nature... Being the black sheep on the other side probably doesn't feel as great as being part of a community
 Short

NESTLE (NESN): Breakout of Key Support
Nestle broke and closed below key 101.0 structure support.
looking left we see that the next structure is lying much much lower.
the stock has enormous potential for a further bearish continuation:
The next key levels are 93.0 and 82.0
good luck!!
 Short

Richemond - Sell for high exposure to tourists and chinaChina consumers make for 45% of sales, while tourism sale smake for 50% of sales.
It will also be important to monitor the evolution of coronavirus. The scientific community is still learning about the virus and there is still a lot of unknown. Financial market’s belief that the disease has been contained may be over-optimistic.
Sell with a stop at $78
 Short

Swatch breach fresh 10 year low: SellSwatch already suffering sales growth will hav eto overcome naother choc with the corona virus.
According to UBS Swatch is most at risk with 50% exposure to chinese consumers, and 50% exposure to global tourism
Sell with stop above the 61.8% level at 266
 Short

NESTLE (NESN): Bearish ABCD + Fibonacci Short
on nestle, we have a perfect convergence of multiple reversal clues.
first of all the market has recently reached a key level of resistance on the left.
this resistance matches perfectly with 618 retracement of a major bearish impulse.
+ on 4H the market has formed a double top pattern and we see a formation of a bearish ABCD pattern.
it is enough to short the stock expecting a bearish continuation at least to 105.5 level.
for the second target, we can aim at 103.0 level
Short
Richemont (CHF)If Coronavirus spread continues at current infection growth rate, then minimum target is CHF64 (-11%) and likely to target bottom of channel at CHF53 (-26%)

Stadler Rail has air upwards, although may lose some momentumBullish Signs on Weekly
- General upward movement
- SRAIL is making higher lows while repeatedly attacking the price range of 49.00 - 50.00 CHF
- Green TI countdown
- EMA30 acts as support (Nisons PB&Strategy)
Bullish Signs on 4H / Daily:
- Ascending triangle (green)
- Bearish momentum stalling
Bearish Signs on Weekly:
- MACD loses momentum
- Some resistance at 47.50 CHF
News:
- This week, some news sites in Switzerland reported some minor problems with new trains form Stadler Rail. However,
 Long

 Long

Buy opportunity - Kaufgelegenheit SIKA Jan/2020(German version below)
Hi guys
In my first post ever on here I'd like to show a possible long idea for SIKA.
In the next few days SIKA might have some buy opportunities at around CHF 174. Price targets for this long idea would be at CHF 185 for target #1 and CHF 195 at target #2.
Thanks very much for leaving a comment or feedback!
Hallo zusammen
In meinem ersten Post auf dieser Seite möchte ich euch eine Long Idee für SIKA zeigen.
SIKA könnte in den nächsten Tagen Kaufgelegenheiten im Preisbere
 Long

MEYER BURGER N: The Perfect Buy OpportunityI would like to say - it is the perfect market for buying.
The market has been falling for 1 year. It reached the bottom. We got a confirmed trend reversal signal. The market started a new uptrend.
Now the price is at the uptrend line and it gives us a very interesting buy opportunity.
Stop orders must be placed below the uptrend line. Profit targets should be at the resistance levels.
It is a good market for the medium and long term trading. Just don't forget about proper money management
MLong
 Long

Nestle on the way downHey guys, let's take a look at the Nestle shares.
As we can clearly see here, the nestle stocks have
after the all-time highs, started to correct.
With a VERY neat bearish sequence the up to
Target level correlated. The market gave us 7 times
the chance to enter (m30). In ABC correction forms
even a second sequence, which is also processed.
At the target level on the 50s, the market reacted PERFECTLY,
with just 7 pips drowdown and rose to the retail level.
Here we expect the markets to conti
Short
K

mobilezone switzerland just for funthought of a friend who works there, by accident saw that they're listed on SIX, and did a quick 7min monthly, weekly, daily PA-workdown
the long setup was developed in the last 5secs of this challenge, the short R/R shown was just an addition before publishing this. the closely overbought/exhausted indicator condition gave me the impulse


NOVARTIS - Trend Trade Idea SIX:NOVN
- Price has retraced to the major trendline & 200ma
- A break of the daily downtrend would confirm a good entry to get on the trend
- MANAGE YOUR RISK -
Disclaimer: All ideas are my opinion and should not be taken as financial advice.
 Long

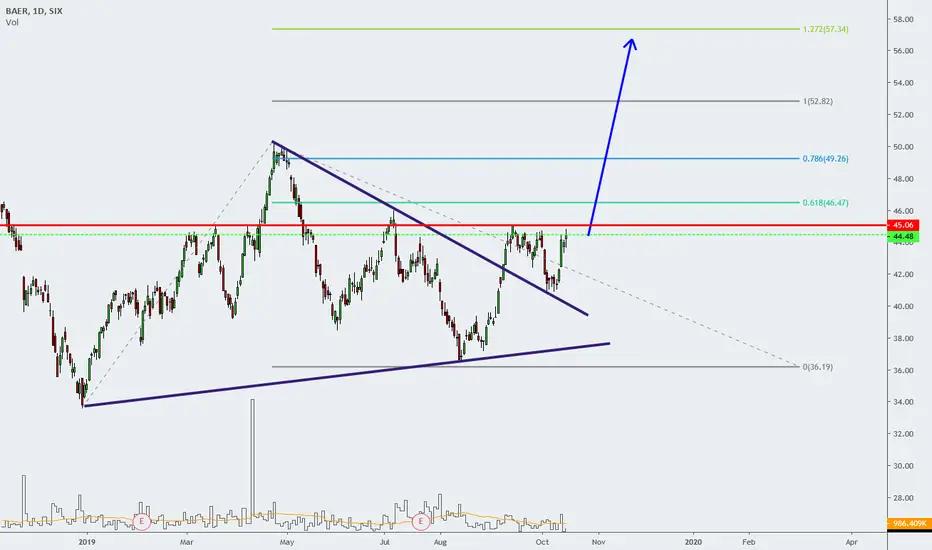
BAERbreakout and pull back possible entry now or wait breakout 45 CHF for more confirmation. target fibs extension level.
 Long
NESN - Pullback mensal para ir LONG!
Primeiro pullback depois de uma subida continua no grafico mensal.
Em direcao a Fibo mensal de 50%-61.8%
Testa FIBO e segue UP TREND LONG!
Short
Swiss Penny Stock - Rather neutral, could surge but...RSI showing bullish sign, but nothing show the bulls are accumulating positions according to Net volume and Aroon....
Should check fudamentals too...
********DISCLAIMER********
Hello guys, posting these analysis publicly to share my trading ideas with my classmates.
These ideas are normally made for my own usage and published as private, but I'm posting them publicly
as part of a group work about stock trading...
At no moment ever are my comments and/or charts claiming to be accurate ad
R
