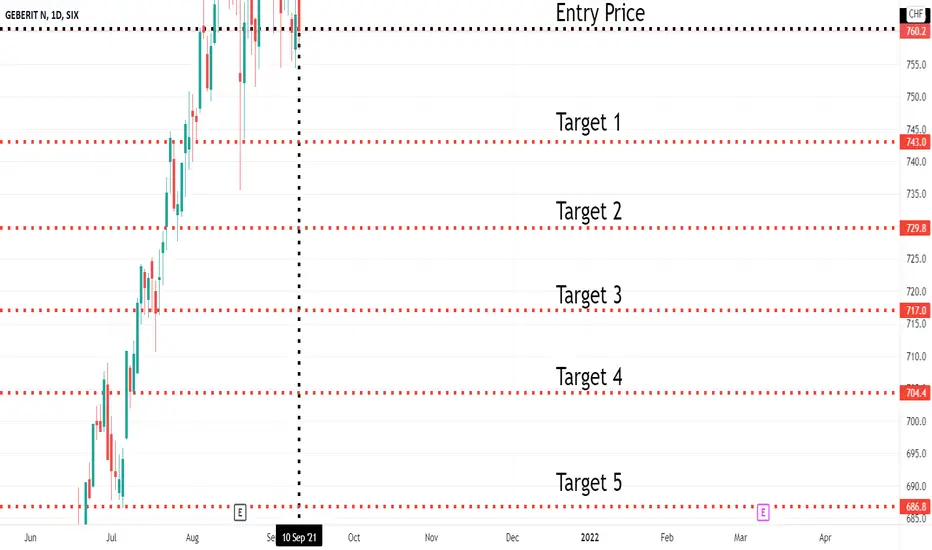
GEBN Daily TimeframeSNIPER STRATEGY
This magical strategy works like a clock on almost any charts
Although I have to say it can’t predict pullbacks, so I do not suggest this strategy for leverage trading.
It will not give you the whole wave like any other strategy out there but it will give you huge part of the wave.
The best timeframe for this strategy is Daily, Weekly and Monthly however it can work any timeframe above three minutes.
Start believing in this strategy because it will reward believers with huge profit.
There is a lot more about this strategy.
It can predict and also it can give you almost exact buy or sell time on the spot.
I am developing it even more so stay tuned and start to follow me for more signals and forecasts.
UBS Group AG (UBSG.vx)We can found a technical figure Triangle in the Swiss company UBS Group AG (UBSG.vx) on a daily chart. UBS Group AG is a Swiss multinational investment bank and financial services company founded and based in Switzerland. UBS client services are known for their strict bank–client confidentiality and culture of banking secrecy. The Triangle has broken through the support line on 09/09/2021. If the price holds below this level, you can have a possible bearish price movement with a forecast for the next 12 days towards 14.595 CHF. According to the experts, your stop loss should be around 15.485 CHF if you enter this position.
Risk Disclosure: Trading Foreign Exchange (Forex) and Contracts of Difference (CFD's) carries a high level of risk. By registering and signing up, any client affirms their understanding of their own personal accountability for all transactions performed within their account and recognizes the risks associated with trading on such markets and on such sites. Furthermore, one understands that the company carries zero influence over transactions, markets, and trading signals, therefore, cannot be held liable nor guarantee any profits or losses.
Novartis AG (NOVN)The Swiss-based drugmaker missed consensus expectations on both earnings and sales in the first quarter, the results were hurt by a historically weak cough and cold season. Novartis’ cornerstone innovative medicines division turned in with sales +4%. Stock is currently pegged to underperform the broader market and our 18-month projections reflect below-average upside potential. But as said in the chart, a "buy and hold" strategy give a 3.50% dividend yield in CHF.
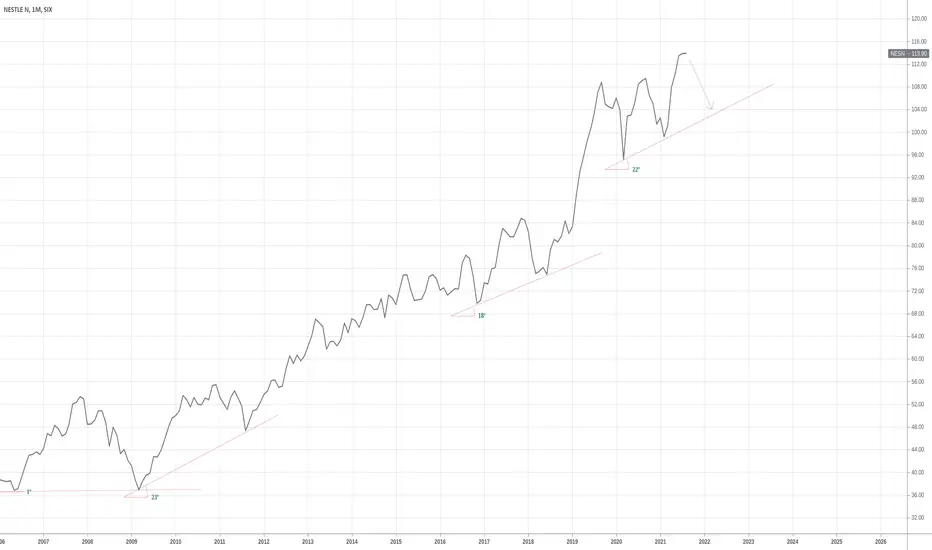
Working with anglesWorking with angles is something I see myself doing more often lately, meaning they have proven some reliability to me over time. When exactly is still quite intuitive and this publication is also an idea to further explore by other traders and so develop a competitive edge, and therefore should remain secret how to apply in further detail.
Here I look at Swiss company Nestle which always has been a high performer, at least since last recession. It price made a double bottom over the course of 2006-2009 with a top in December 2007.
From that 2009 onwards it delivers a good opportunity for bullish investors. When I see it touching an imaginary trendline I draw a line using the "Trend Angle" drawing tool. Often I discover that certain angles persist although with an offset up or down in price. Here I have drawn a 23 and 22 degree trendline with almost 10 years between them.
Long persistent trend angles objectively tell me something about strength and trend line reliability. For example, it would add weight to my decision for going short or long at this point in time.
Not saying I would go short here. This is where you can add your variables to make your own decision as a trader.
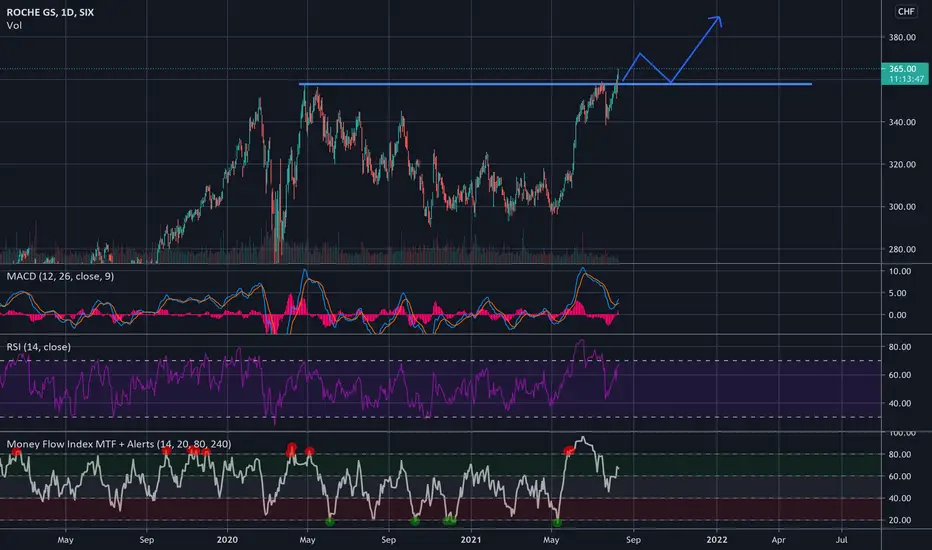
ROG Breakout. Broke its all time high.Good news combined with a perfect breakout at 357. Just needs a bit more volume.
RLong
Swiss Re AG bullish scenario:We have technical figure Triangle in Swiss company Swiss Reinsurance Company Ltd (SREN.vx) at daily chart. Swiss Re AG is a reinsurance company based in Zurich, Switzerland. It is the world's largest reinsurer, as measured by net premiums written. The Triangle has broken through the resistance line on 17/06/2021, if the price holds above this level we can have possible bullish price movement with a forecast for the next 15 days towards 89.50 CHF. Our stop loss order should be placed at 83.10 CHF if we decide to enter this position.
Meyer Burger - Bottom - LongChart painting from the early 21st century, artist Maxi Scalibusa. No investment advice or a recommendation to buy or sell any securities. This is entertainment. Start 0.4992 CHF
MLong
Meyer Burger Update to previous chart.ADDITION TO MAIN PUBLICATION, LINKED ON THE BOTTOM.
As said before, the trend remains bullish. We found a good support on the Weekly combined with the middle of the Uptrend Channel since march 2020.
Trend remains bullish as of now.
Retest of the Monthly at 0.458 would now make sense.
MLong
Meyer Burger Rejection, 1 CHF or a 40% retrace?!MBTN recently rejected a few levels. Yearly horizontal, 0.236 Fib and the "local" monthly combined were acting as a huge resistance. Combined with the massive run since March 2020 Crash, a retrace made sense and is healthy.
A retrace to 0.25 Chf would make sense, that's where I initially entered the trade and also bought Call Options.
Although it would make sense technically, a 40% retrace seems unlikely to me in the current environment with green energy, MBTN's new business plan and ambitions.
If I was looking for an entry into MBTN, I'd observe the latest resistance I lined out above.
Once claimed, it can see a healthy run up to 0.66 (Key-Resistance/Support) and up to 1 Chf which is the Golden Pocket pulled from the last high.
The trend remains bullish, no need to think otherwise until proven wrong.
MLong
M
Roche reversalRoche making higher lows inside a descending broadening wedgem, while showing signs of accumulation with a sell wall at 326.85$. The bullish engulfing candles on Jan 11 and the Marubozu on Feb 4 show that the demand for this asset is high at the previous Peak back in December 2014. The fact that there is also MACD hidden bullish divergence on the daily and the monthly strengthens the argument for a reversal and a break out of this structure in the coming weeks or months.
RLong
NOVN Long TradeNovartis showin higher lows or/and a inverse head shoulder, inside a right angled broadening wedge, with a partial decline, while showing hidden bullish divergence on all three oscilators MACD, RSI and Stochastic on the Daily timeframe.
Its at the perfect spot for entry a long entry.
Target 1: 94$
Target 2: 103$
Target 3: 115$
RLong
Swiss National Bank (SNBN)It is like holding a risk-free of default US equity market fund denominated in CHF with a total return of 0.3%. It's an interesting business: print money and buy stocks.
As at 31 December 2020, the key asset allocation data for the foreign exchange reserves and the Swiss franc bond investment portfolio were as follows: USD 36%, EUR 40%, JPY 8%, GBP 6%.
Their last reported 13F filing for Q3 2020 included $127,874,338,000 in managed 13F securities and a top 10 holdings concentration of 24.15%. Swiss National Bank's largest holding is Apple Inc. with shares held of 67,699,096.
Equities are managed on a purely passive basis, whereby broad market indices of advanced and emerging economies are replicated. Exchange rate and interest rate risks are managed using derivative instruments such as interest rate swaps, interest rate futures, forward foreign exchange transactions and foreign exchange options. In addition, futures on equity indices are used to manage the equity investments.