LongLong
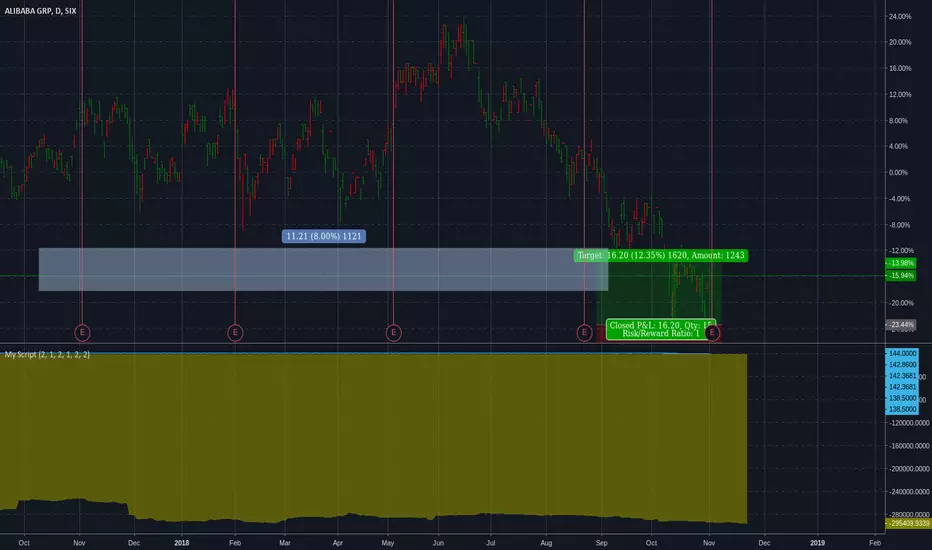
Alibaba: 2 Month TargetAlibaba for the next week or so may have some small negative correlations due to concerns over trade in China and the recent effects tariffs and political decisions had on Asian markets. That being said, it is coming in on a strong for positive correlations when looking at a 2 month time period. An expectancy of a $150 price tag should occur within January and it seems to have strong stock potential for a very long term hold.
BLong
Julius Baer Grouppe gave me a nice early weekend gift.Yesterday Julius Baer went to its lowest point since 2016 and resisted to move lower
That signaled that it may be the beginning of a small uptrend.
This morning entered a trade on the bell.
Mid day made a nice 1.8% return.
Have a nice weekend.
Entry: 43 CHF
Exit: 43.78 CHF
Return: 1.8%
 Long
Long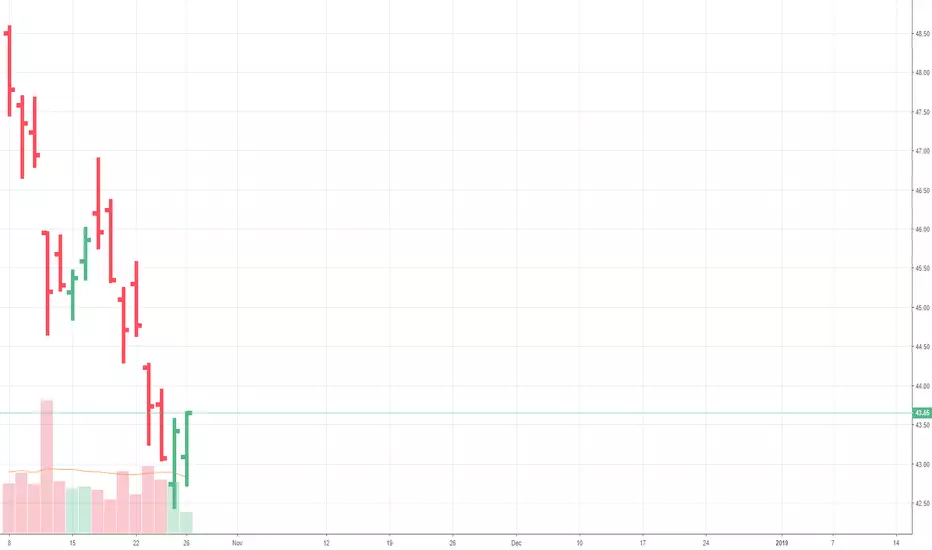
IDORSIA CATCHING THE FALLING KNIFE WITH THE BULLISH CONFIRMATIONIt was the 6 februar and as a inexperienced trader, without any concept of resistence and support I was racking my brain trying to find a bottom to ethereum. Trendline were like butter cutted by a hot knife, people were screeming it will go to Zero but I was sure that there was an end to the sell off.
I tryed to find a logic behind the possible point of reversal and I found it in the bullish confirmation.
The bullish confirmation is nothing more than the basis of a second bullish impulse. This level is like a touch down. The coin or share says you: my value is above this level. I don't want to go more down. Here is a strong support.
all these points are necessary to confirm a potential bullish coonfirmation:
1) bullish impulse
2) bear trap (pull back)
3) second bullish impulse
The bullish confirmation is exactely where the bear trap was revealed (the basis of the second bullish impulse).
Here a low time frame chart on ethereum showing you how I catched 3 times Ethereum thanks to this trick.
and here a small time frame on this structure
In the case of Idorsia is a little bit more tricky because the bullish confirmation or basis of second impulse is at 18.9 (basis of the bullish impulse) and not 18.3 ( basis of the pullback)
Confirming the hypothesis of a reversal point at this level there is also the support trendline of this orange downtrend channel.
As Idorsia is a very volatile share I see this level as a likely reversal point even if the SMI is not over with his corrective phase.
As I believe in Idorsia and I want to increase the number of share and I'm shorting since 23.6 Chf I can allow me to put a buy order at this level and decide in a second moment If I have to short more or not.
BIO


 Short
Short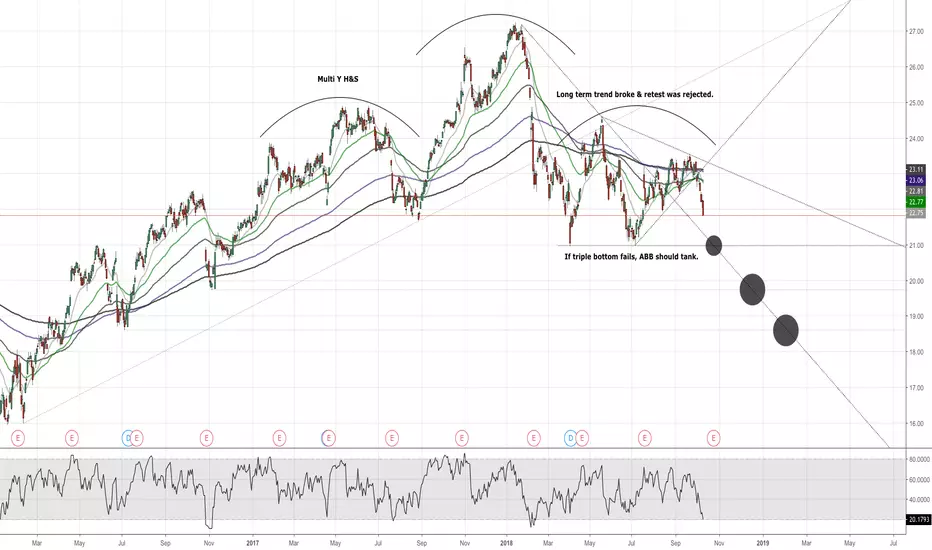
5th test, is it one more upside ?ABBN, the support has hold 4 times already. We are one the 5th time and it seems that buyers are coming.
Validation if we end the week above the support. We will have the answer friday at the closing bell.
Long
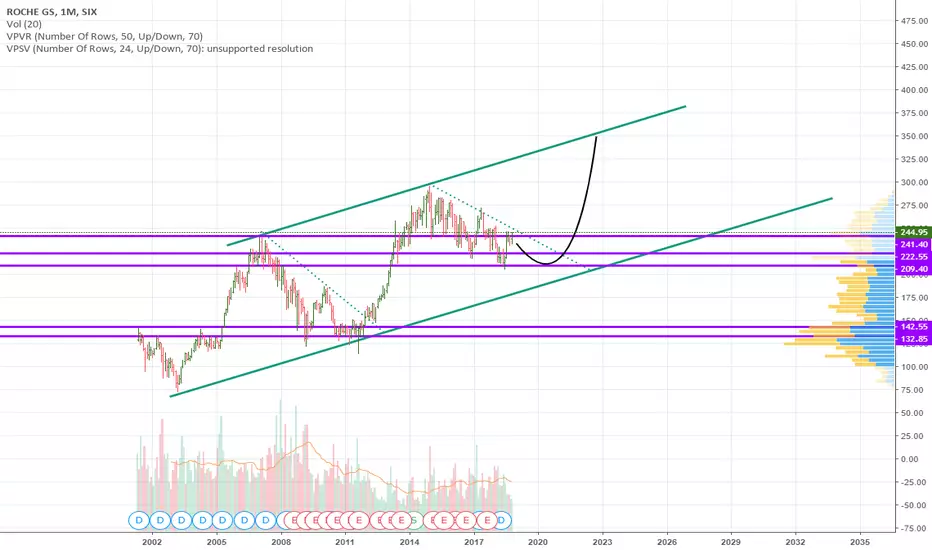
Roche GroupOn a large time frame. Roche is on a steady uptrend. Currently it is at the support which brings in very good opportunity for a buy in for Long term holdings (20years)
RLong
ALIBABA (BABA) - What next we do ?BABA has fall down very dramatically, and it also affected by the dumping of World Stock Market each last several days ago.
We have 2 BUY ZONE 1 and 2 for investing middle and long term.
Good luck guys !
B

Nestle hit bottom yesteday, today produced fruit.Nestle hit bottom yesterday, to the point of no return.
Today morning, anybody who opened position and will close it end of the day made money. Good day
Entry: 78.88 CHF (16/10)
Exit: 79.90 CHF (16/10)
Return: 1.3%
 Long
Long
Long bitcoin & stock market -> Long Swissquote $SQNSIX:SQN announced on the 14th of July 2017 a partnership with Bitstamp to trade BITSTAMP:BTCUSD on their platform.( press release ) At this time the price was at the limit to break the long downtrend from the all time high from the financial crisis of 2008. It's was the first online bank in Europe to offer bitcoin investing. Much more the first online bank regulated by the Swiss Financial Market Supervisory Authority (FINMA) and listed on a major stock exchange (SIX:SQN).
For those they do not know Swissquote, they offers different online services like Trading, Forex and Robo-Advisory. In addition to a low-cost service for private clients, Swissquote also offers specialized services for independent asset managers and corporate clients. At the end of 2017, they had 309,286 accounts compared to the 3 million and more of Bitstamp. They are presented in Europe and Asia with offices in Switzerland, London, Malta, Dubai and Hong Kong.
For 2017 (July to December), the volume of Crypto ( BITSTAMP:BCHUSD , BITSTAMP:XRPUSD , BITSTAMP:ETHUSD , BITSTAMP:LTCUSD ) traded on the platform was CHF 0.9 billion and the revenue was at CHF 5.6 million.
As the year of 2018, the year of regulation on the crypto sphere. As we could see with Coinbase or Circle buying companies and applying for licenses. Swissquote is well positioned and fully regulated to take up their share on the crypto market. Private and institutional investors can be attracted by a fully regulated swiss actor. On volume and number of customers in the crypto market, they have space to increase their marketshare in Europe and even in Asia. Even on their traditional business with a bull market, they can performed well. Look at one of the biggest broker in America Charles Schwab ( NYSE:SCHW who has less customers than Coinbase.
Definitely LONG
31.07.2018 -> Results for the first half of 2018
What do you think about the trend ? Please, share in comments
( Annual report 17 )
 Long
Long
 Short
Short
KUDELSKI ONE DAY ON THE MOON TOGHETERBut before we have to spot the bottom.
Cybersecurity is the big actual/ next thing. all what goes with cybersecurity is to watch with real attention.
I have great feelings and I know that with kudelski one day we will be togheter on the top spraying in the air a bottle of dom perignon.
The road for the top, goes through the bottom.
My impression is that 5.30 in 2012 was the bottom.
We are clearly in a big negative channel that goes directly to bankruptcy but…
The general impression is that we are entering in a more mature phase. Bounces are more slow as well the falls. This in my opinion is a first sign of trend change.
25 July the price stopped at the high of the right shoulder. this is for me now the major supply zone. Breakout above it means bull market.
Now we are retesting the right shoulder of the inverse head and shoulder of 2012. If kudelski manage to stay above this level, the bottom is served.
If it goes more down is sad.
If it stays above this level, price could range between supply and demand for some time and we can swing with it untill the break out arrive.
BIO
 Long
Long
LET INSPIRE FROM SPECULATIVE MOUVEMENTJust looked at IPO in switzerland this year. After a speedy scroll I was captured by two projects. Medartis and Sensirion.
Sensirion just mooned and if I had a little more time for stock market it was a clear buy for me.
Now let analyse Medartis.
IPO are tricky. There are differents movement after an IPO and you can enter in a golden egg goose but you can easily be trapped in a bad affair.
Now we can identify some important similarities.
let look at sensirion right.
1) post IPO speculative push
2) overbought corrective sell off
3) shy afflux of investor with a growth within the channel
4) break out of the top.
5) consolidation on the old top
6) explosion $$$$
left Medartis
1-4 are done.
felt 5) consoldation and 6) explosion
Now. I noticed it yesterday and I was concerned to buy or not.
Now is approaching the superior resistance of the channel and is inside a small rising wedge with some bearish divergence on indicators on higher timeframe.
So I decided to stay out and buy a pull back, and I will protect me inbetween with a stop above the channel.
Will it work what I'm telling you?
Maybe. There is a clear difference between this two ideas
Sensirion growth so fast in less time, as sign of strong interest. Medartis is growing but more slowly.
Even if this two movement are similar you can see that in august there were 3 big spike (first before the break out), signaling that someone passed big buy orders.
Medartis is more shy but the break out put him in an interesting situation and the pullback would be for me a clear buy opportunity that I won't miss. From there reevaluation of what happens with easy to place stop loss.
High Reward/Risk ratio
BIO
 Long
Long
 Long
Long
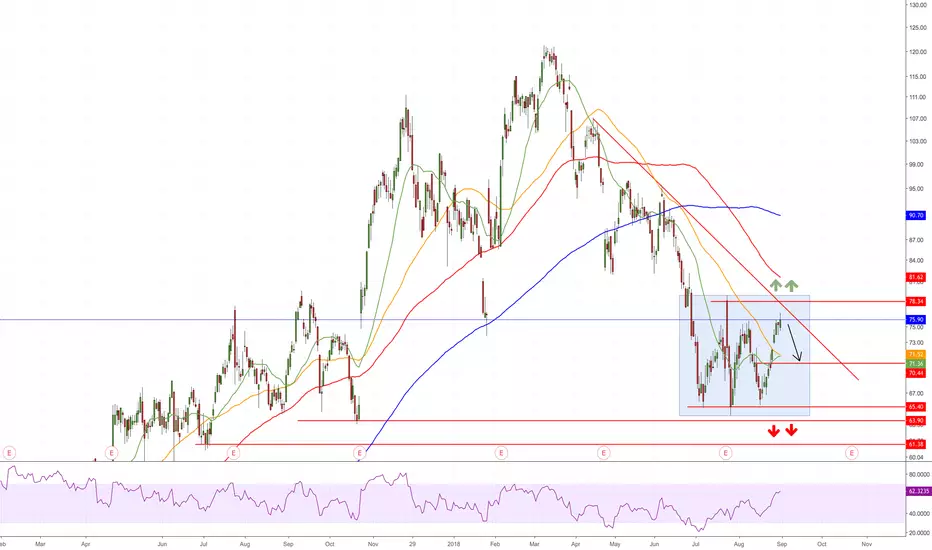
Still in a RANGEWithout a clear break of the 79.50 region
AMS can comme back to re-test the lows around 65.00
I stay neutral until the range in blue is not broken
 Short
Short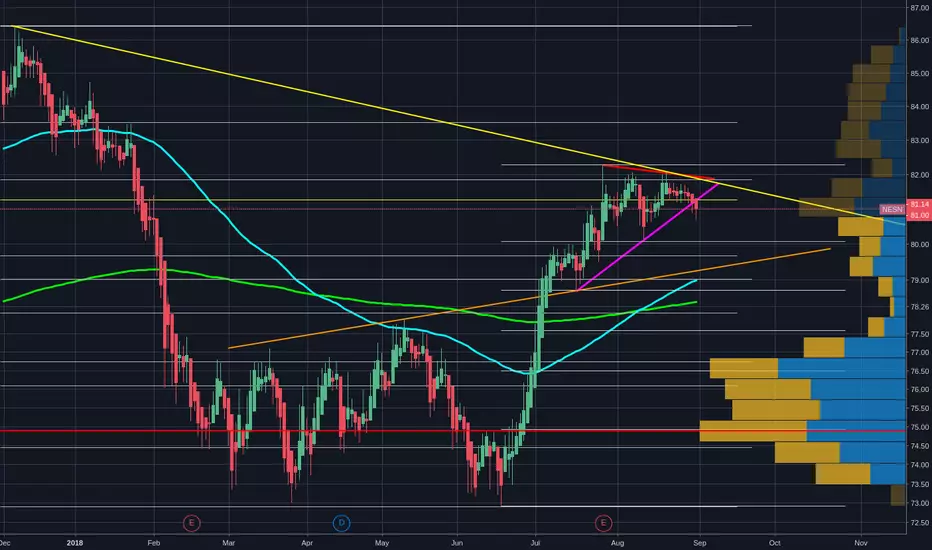
Bearish Triangle in short term, long term more bullishCLN X is consolidating its advanced bearish triangle for recent months. I expect that it end will be a move to the downside, approx. 19.50 or 20.00, that signs the beginning of a new trend to the upside. Currently this analysis isnt likely, but the Dow and so the S&P with its "exhausting peak" could break, because of the trade war with china. the october is also a weak month for the stock market. So understand me right please, for a short term I am short for Clariant, but after this there could be a big rebound.
 Short
Short
SNB - a new move down is ready to startThe Swiss National Bank is presenting a very interesting chart.
After a long period of 5 Waves up, it has entered into a correction phase.
We had the first move down (a) we most probably saw the reaction (b) and a new move down (maybe a sharp one) will follow (c).
This for me is a nice Short candidate.
Note: Maybe some investors do not know it, but SNB has a portfolio of stocks.
As of June 30 2018, the portfolio was as follows (just click the link)
www.nasdaq.com
 Short
Short
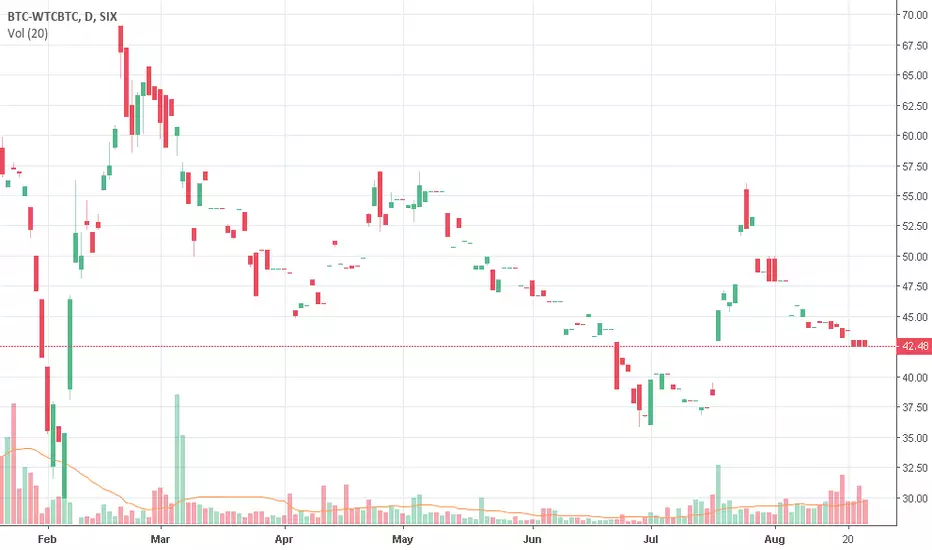
Arbitrage BTC-WTC Arbitraging idea for BTC-WTC
24h volume:
Binance -467.044 BTC
HitBTC - 2.6378 BTC
buy: HitBTC | 0.00045000
sell: Binance | 0.00046060
profit: 3.111 %
Wallets are open on both exchanges (for deposit/withdrawal)
HitBTC: BTC-WTC
commission for withdrawal - BTC: 0.001, WTC: 0.75
B
AMS SIX - BUY2 times RSI below 30 stock went Up
AMS is a semiconductor company but is only going a down at the moment because of other semiconductor like Nvidia, but that has to do with Crypto mining.
Austrian chipmaker AMS, mainly known as a supplier of sensors for Apple's iPhone X, aims to expand further into the fast-growing business of making sensors for self-driving cars.
It's envolved in a lot of areas and has a lot of products:
3D Sensing
The rapidly growing field of 3D sensing is currently addressed by the following 3D camera technologies: stereoscopic imaging, time-of-flight (ToF) sensing, and structured light.
Audio
ams provides Active Noise Cancelation (ANC) solutions and also offers power and communication interfaces for smart earbuds
CMOS Imaging Sensors
CMOS imaging sensors from ams feature global and rolling shutter capability, low noise, high dynamic range and high frame rates.
Environmental Sensors
ams provides a range of off-the-shelf environmental sensor solutions
Flow Sensing
ams ultrasonic flow converters for flow metering applications
LIDAR is a remote sensing technology that measures distance by illuminating a target with a laser and analyzing the reflected light.
Light Sensors
ams provides the industry’s broadest portfolio of high-performance and high-sensitivity digital discrete and integrated module optical sensors.
Medical & Health
High-performance sensors and sensor interface solutions from ams provide for more precise and accurate diagnostic information while exposing the patient to a lower dose of radiation.
Position Sensors
ams offers a broad range of high-performance position sensors which are suitable for use in industrial, medical, robotics, automotive and consumer applications.
Power Management
ams supplies power management products for portable battery-powered devices
Precision Time Measurement
ams offers a family of standard high-performance time-to-digital converter (TDC) products for use in applications requiring extremely precise measurement of time intervals.
Sensor Interfaces
Sensor interface ICs enable a system to read out information from the input signal generated by complex sensors
Smart Light Management
Single-chip solutions enable IoT connectivity and precise control of smart lights and replacement lamps.
Wireless Sensor Nodes
Wireless technologies from ams are notable for their extreme high performance, low power consumption and small board footprint.
Long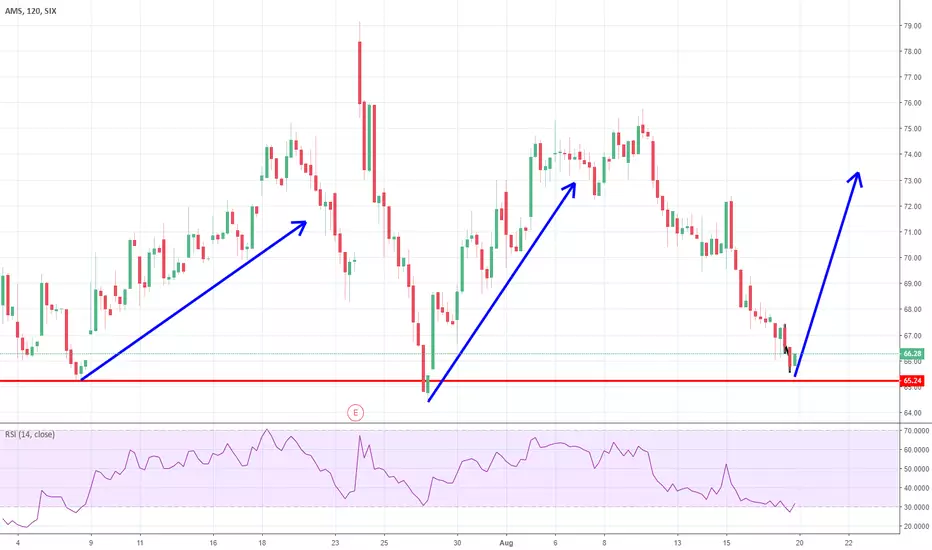
VAT update - Hidden Gem in uptrendHey guys, After VAT has come into the expected buying zone due to the correction, a new upward trend is starting now. I expect the first real resistance with a at 144-148 CHF followed by a small correction. The reason for the correction (double bottom at 118 CHF) from 170 CHF to 120 CHF was, on the one hand, the short-time work registered by VAT and, on the other hand, the unscrewing of the annual targets. But you should not forget the more than above-average results and fulfilled expectations from the last years. VAT is still the market leader in his business area and now again on track. RSI and MACD are very bullish which are good indicators.
 Long
Long
Novartis almost a buyPharmaceutical stocks represents a defensive asset when a positive market cycle is about to finish or when it is foreseen a cycle less positive than the previous one. In such context pharma stocks should have an advantage because of inelastic demand for such goods.
Novartis ($NVS,$NOVN) is one of the candidate to break up as the price is moving in a triangle since 2015. the stock doesn't not have an high volatility as other stocks but is one of the main represented of INDEX STOCK HEALTH CARE. There are nice technical indications on the chart that a breakout might happen in the next weeks. At the moment I am expecting a price pullback, where at the end it will be possible to go for an entry long.
Conclusions
At the moment price is consolidating and some other days to reduce RSI value will be needed. It's possible either to open positions at the end of the pullback or when price breaks out the downtrend (2015). Possibility to have it in CHF or $.


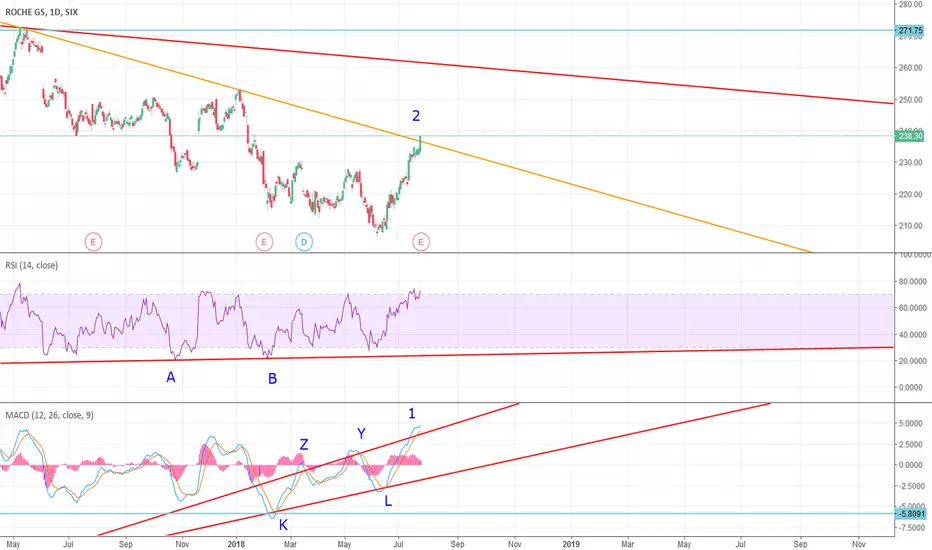
Roche primary trenline analysis (RSI, MACD, price) [Daily]Hello Everyone,
I would like to share with you my idea regarding Roche. This is not a trade advice.
There are signs that stock price may increase for Roche SIX:ROG
RSI (14)
There is a strong primary trendline A-B on RSI, support trendline
- Point A (25/Oct/2017) was the lowest RSI (14) low since 10/Aug/2011 making it very significant RSI low (6+ years)
- Point B (06/Feb/2018) was consecutive RSI low after A. Primary RSI trendline A-B is established.
MACD (12,26,9)
There is a strong primary trendline K-L on MACD, support trendline
- Point K (14/Feb/2018) lowest MACD cross-over since 12/Feb/2015 very significant MACD low (3+ years)
- Point L (19/Jun/2018) was consecutive MACD cross-over after K. Primary MACD trendline K-L is established.
MACD (12,26,9)
There are also MACD highes Z and Y. However, these are not significant as they are only local MACD highes and trendline Z-Y is not primary.
Nevertheless, fact that MACD lines crossed from bottom the trendline Z-Y in point 1 was a sign of strength. This trendline is not a support.
Price line
- There is primary trendline (RED) linking all-time-high from 05/Dec/2014 with high from 09/May/2017. This trenline is upper resistance.
- There is non-primary trendline (ORANGE) linking high from 09/May/2017 with high from 08/Jan/2017 (none of the point is 52-week high 3-yrs high or all-time-high).
Nevertheless, fact that price line crossed over ORANGE trendline in point 2 was a sign of strength. This trenline is not a support.
Let's hope that Earning Report will be favorable.
Please share your thoughts with me.
Ziza23456
RLong