Long
Long
 Long
Long
Partners Group: Deeply Oversold, Cheapening Fast — But the Turn Partners Group Holding ( SIX:PGHN ) has undergone a major valuation reset.
After trading above CHF 1,400 in 2025, the stock has fallen into the CHF 700–750 area. That brings it close to levels not seen since the 2022 correction — while the underlying business remains fundamentally attractive.
Partners Group is one of Europe’s leading private-markets asset managers, investing across private equity, private debt, infrastructure and real estate. Its economics are driven largely by recurring management fees, performance fees and the long-term expansion of private-market allocations.
That makes PGHN structurally interesting, but also cyclical: weaker fundraising, fewer exits and lower transaction activity can pressure sentiment and earnings expectations even when the underlying portfolio remains healthy.
Fundamentals are holding up
The scanner still sees a strong underlying business:
Business Quality: GREEN
Quality score: 2/3
Return on capital: 33.9%
Profit + cash: 54.8% / 52.1%
The main weakness is the margin trend at -2.14%, suggesting some deterioration in operating momentum.
Valuation, however, has become much more appealing after the decline:
Valuation score: 6.5/7 — GREEN
Cash yield: 7.52%
Cash-flow price: 18.96 — GREEN
Earnings price: 15.47 — GREEN
Profit/share metric: 48.45 — GREEN
The business-price metric at 16.44 remains orange, so I would call the stock attractive rather than outright cheap.
Growth is also respectable rather than spectacular. Three-year sales growth sits around 10.2%, while three-year profit growth is approximately 7.4%. Future profit growth at only 2.2% is one reason I would not treat this simply as a deep-value slam dunk.
Technically, this is where things get interesting
Long-term momentum is now extremely depressed:
WT1 / WT2: -58.36 / -56.33
That puts PGHN deep into the historical oversold area.
The broader scanner also shows:
Top recent: YES
Combined: GREEN 7/10
False bottom: OK
But important confirmation pieces remain absent:
WT cross: NO
Band 1: RED
Bands sync: NO
That's why the overall signal is still:
WATCH — 2/3
The recent bounce from roughly CHF 670 toward CHF 750 is encouraging, but technically it is still only a rebound inside a damaged trend.
What I’m watching
PGHN is becoming increasingly interesting because valuation, business quality and extreme oversold conditions are finally aligning.
What is missing is momentum confirmation.
A bullish WT crossover combined with improving band synchronization would materially strengthen the setup. If that happens while the CHF 650–700 region continues to hold, this could evolve into a much higher-conviction recovery trade.
For now I would rather watch the turn develop than chase the first bounce.
Verdict: WATCH — attractive valuation and extreme oversold conditions, but confirmation still missing.
Not financial advice.  Long
Long
Long 
PGHN: Record fundraising & Redemption Pressure: A Bottom to watcSIX:PGHN has fallen from above CHF 1,600 to around CHF 730, a drawdown of roughly 55%.
That reset is becoming interesting: fundraising remains strong, the valuation has compressed sharply, and monthly momentum is deeply oversold.
But the Master Buy Scanner V2 still says WATCH.
Master Buy Scanner V2 — Monthly
Score: 2/3
Action: WATCH
BUY state: NO EVENT
Entry quality: OK — 50%
Position size: NONE — 0%
WT cross: NO
Band 1: RED
Combined: GREEN 7/10
Bands synchronized: NO
Cycle: ACTIVE
WT1 / WT2: -54.61 / -45.48
This is a classic bottoming setup without confirmation.
Momentum is already extremely depressed and the Combined signal has improved to 7/10, but the WT cross and band synchronization are still missing.
Fundamentals remain attractive
Partners Group reported $16B of new client commitments in H1 2026, versus $12B a year earlier, while assets under management reached $186B.
The main concern is the evergreen platform, where redemptions have increased materially. Those outflows are expected to reduce near-term net AuM growth and remain the biggest issue the market needs to see stabilize.
Still, the broader franchise remains highly profitable across private equity, private credit, infrastructure and real estate.
The valuation has changed dramatically
The scanner gives PGHN a strong 6.5/7 valuation score:
Cash yield: 7.7%
Cash-flow multiple: 18.96
Earnings multiple: 15.12
Profit/share: CHF 48.45
Business quality also remains attractive:
Return on capital: 33.93%
Profitability: 54.8%
Cash generation: 52.13%
So unlike at CHF 1,500+, valuation is now becoming a genuine part of the bull case.
The risk
The advanced scanner is still cautious:
Lifecycle: CAPITULATION
Conviction: C — 49%
Recovery: NO
Relative strength: weak
That fits the chart well.
The stock may be cheap, but the market has not yet demonstrated that sellers are finished.
Key technical levels
Support: CHF 680–700
Major support: CHF 630–650
First resistance: CHF 760–800
Recovery confirmation: CHF 840–880
Major resistance: CHF 950–1,000
A monthly WT cross combined with a move above roughly CHF 800 would make the setup much more compelling.
My classification: VALUE WATCH
PGHN offers an increasingly attractive combination of valuation, profitability and deeply oversold momentum.
But technically:
No WT cross. No synchronized bands. No BUY event.
So for now:
WATCH — wait for capitulation to turn into accumulation.
What would you do?
A) Start small around CHF 730
B) Wait for the scanner BUY
C) Wait for confirmation above CHF 800
Master Buy Scanner V2:
Not financial advice. Long 
Kuehne Raised Its Guidance: Why Does My Scanner Still Say WATCHKuehne+Nagel International ( SIX:KNIN ) has just reported a strong second quarter, raised its full-year earnings guidance and confirmed that its operational recovery is gaining momentum.
The stock has also rebounded from approximately CHF 160 to above CHF 200.
This sounds bullish—so why does my Master Buy Scanner V2 currently recommend a 0% position?
Because a strong company and an attractive entry are not necessarily the same thing.
The scanner detected the recovery near the bottom. Seven monthly bars later, it now considers the setup too extended to chase.
THE CURRENT SIGNAL
The monthly scanner shows:
• Overall status: WATCH
• Score: 2/3
• Action: WATCH
• Decision: WATCH
• Buy state: NO EVENT
• Entry quality: OK — 45%
• Setup maturity: CHASE
• Model position size: NONE — 0%
• Combined technical score: GREEN — 5/10
• Technical cycle: FIRED
• Bars since BUY: 7
• Bands synchronized: NO
Several technical components remain positive, but the current risk-to-reward ratio is no longer strong enough for a fresh entry.
This is exactly the kind of situation where a disciplined scanner should stop investors from confusing improving fundamentals with perfect timing.
THE ORIGINAL OPPORTUNITY HAS ALREADY MOVED
Kuehne+Nagel produced a BUY signal close to its 2026 low, when sentiment was considerably weaker and the stock was trading around CHF 160.
Since then:
• The bottoming process has been confirmed
• The monthly technical cycle has fired
• Momentum has turned positive
• The stock has recovered toward CHF 200–215
• The latest results have validated part of the recovery thesis
However, the stock is now approaching an important resistance area.
The scanner therefore classifies the setup as CHASE rather than offering a new entry.
THE FUNDAMENTAL RECOVERY
Kuehne+Nagel delivered an impressive second quarter:
• Net turnover: CHF 6.6 billion, up 8%
• Constant-currency turnover growth: 11%
• EBIT: CHF 381 million, up 11%
• Constant-currency EBIT growth: 17%
• Earnings: CHF 276 million, up 10%
• Group conversion rate: 17%
Management subsequently raised its 2026 recurring EBIT guidance to CHF 1.35–1.55 billion.
The results demonstrate that Kuehne+Nagel is successfully improving efficiency while gaining market share in several strategically important categories.
This is a meaningful improvement—but it follows several years of declining post-pandemic revenue and profit comparisons.
WHY AIR LOGISTICS MATTERS
Air Logistics was the strongest contributor during the quarter:
• Turnover: CHF 2.2 billion, up 20%
• EBIT: CHF 154 million, up 35%
• Conversion rate: 31%
• First-half air-freight volume: 1.1 million tonnes
Performance was supported by a better customer mix and market-share gains, particularly in technology.
Kuehne+Nagel is benefiting from demand connected to:
• Semiconductors
• Cloud infrastructure
• Data centres
• High-value technology equipment
• End-to-end logistics solutions
The company highlighted its work transporting Google cloud-infrastructure equipment between Asia and the United States.
That provides KNIN with exposure to the AI infrastructure cycle without requiring it to manufacture chips or operate data centres.
THE OTHER DIVISIONS ALSO IMPROVED
The recovery was not limited to air freight.
Sea Logistics:
• Turnover: CHF 2.2 billion
• EBIT: CHF 140 million
• Conversion rate: 29%
• First-half container volume: 2.1 million TEU
Road Logistics:
• Turnover: CHF 1.0 billion, up 14%
• EBIT: CHF 36 million, up 29%
Contract Logistics:
• Turnover: CHF 1.2 billion, up 2%
• EBIT: CHF 51 million, up 21%
Contract Logistics has also secured more than 300,000 square metres of new warehouse space dedicated to cloud providers.
This diversification is one of Kuehne+Nagel’s strengths. It can participate in air, sea, road and warehouse logistics while serving approximately 400,000 customers across close to 100 countries.
THE AI EFFICIENCY OPPORTUNITY
Kuehne+Nagel is accelerating the deployment of artificial intelligence throughout its organisation.
Management is using AI for:
• Operational-process optimisation
• Automation of repetitive workflows
• AI agents
• Customer-service improvements
• Network and capacity management
• Productivity and service-quality improvements
For a company with approximately 88,000 employees and more than 1,300 locations, even small productivity improvements can materially affect profitability.
AI may therefore support Kuehne+Nagel in two ways:
1. By reducing its internal cost base
2. By generating logistics demand from technology and cloud-infrastructure customers
THE SCANNER LIKES THE BUSINESS
Business quality remains GREEN:
• Quality score: 2.5/3 — 83%
• Return on capital: 18.27%
• Profitability: GREEN
• Cash generation: GREEN
• Recovery status: CONFIRMED
• False-bottom check: OK
• Value-trap check: OK
This is not a financially distressed logistics company.
Kuehne+Nagel is one of the world’s largest logistics providers, with leading positions in both air and sea freight forwarding.
The scanner’s advanced assessment gives the setup a B conviction rating of 72%.
The problem is not the company’s survival or overall quality.
The problem is the current entry.
VALUATION IS ATTRACTIVE—BUT NOT CHEAP EVERYWHERE
The valuation and debt section is GREEN, with a score of 5.5/7:
• Cash yield: 5.98%
• Business-price multiple: 12.97x
• Cash-flow multiple: 17.27x
• Earnings multiple: 27.68x
• Profit per share: CHF 7.29
• Debt-to-equity: 1.99
The cash yield and cash-flow valuation are reasonable, but the earnings multiple is not especially cheap for a cyclical logistics business.
Investors buying at approximately CHF 200 are already paying for a meaningful recovery in earnings.
That recovery is now becoming more plausible—but part of it may already be reflected in the share price.
THE DIVIDEND
Shareholders approved a gross dividend of CHF 6.00 per share for the 2025 financial year.
At a share price near CHF 202, that represents a historical yield of approximately 3%.
However, the dividend has declined from:
• CHF 14.00 for 2022
• CHF 10.00 for 2023
• CHF 8.25 for 2024
• CHF 6.00 for 2025
This reflects the normalization of profits after the exceptional pandemic-era logistics cycle.
The dividend remains useful, but KNIN should not be treated as a stable high-yield stock. Future distributions will remain connected to earnings and freight-market conditions.
WHY THE GROWTH SCORE IS STILL RED
Despite the strong latest quarter, the scanner’s historical growth assessment remains weak:
• Growth score: 1/4 — 25%
• Growth outlook: RED
• Expected profit growth: 5.45%
• Three-year profit growth: -30.44%
• Three-year sales growth: -14.67%
This apparent contradiction is important.
The latest quarter shows recovery, while the three-year data still reflects the normalization from extraordinary pandemic profitability.
KNIN may be moving from contraction into stabilization—but it has not yet established a new long-term growth trend.
The raised guidance is encouraging. Several additional quarters of consistent progress would be needed to turn that recovery into a durable growth thesis.
THE TECHNICAL SETUP
The monthly chart has recovered strongly from its 2026 low, but KNIN is now approaching resistance.
Key areas I am watching:
• CHF 190–195: immediate pullback zone
• CHF 175–185: stronger accumulation area
• CHF 155–165: major structural support
• CHF 210–215: immediate resistance
• CHF 230–240: secondary recovery target
• CHF 250–260: major long-term resistance
A monthly close above CHF 215 would provide stronger confirmation that the recovery can continue.
However, purchasing directly below this resistance creates an unattractive risk-to-reward profile.
A controlled pullback toward CHF 190—or ideally CHF 175–185—would offer a more interesting entry if the fundamental thesis remains intact.
THE BULL CASE
• Q2 turnover, EBIT and earnings all increased
• Full-year earnings guidance was raised
• Air Logistics EBIT grew 35%
• Road and Contract Logistics profitability improved
• Market share is increasing on important trade routes
• Technology and cloud infrastructure are becoming meaningful growth drivers
• AI deployment could improve productivity
• Return on capital remains strong
• The recovery has been technically confirmed
• The scanner’s value-trap and false-bottom checks remain positive
THE BEAR CASE
• The stock has already rallied considerably from the signal
• The scanner identifies the current setup as CHASE
• No new BUY event is active
• Technical bands are not synchronized
• Growth remains weak over a three-year horizon
• The earnings multiple is still relatively high
• European export activity remains subdued
• Freight profitability is highly cyclical
• Geopolitical disruptions can rapidly affect volumes, routes and costs
• The dividend has fallen substantially from its pandemic-era peak
• Failure below CHF 175 could reopen the path toward CHF 160
MY CURRENT PLAN
I would keep KNIN on the watchlist rather than open a full position at the current price.
My framework would be:
• Avoid chasing directly below CHF 210–215 resistance
• Watch for a constructive pullback toward CHF 190–195
• Prefer a stronger accumulation opportunity around CHF 175–185
• Consider a breakout entry only after a convincing monthly close above CHF 215
• Monitor whether Air Logistics can maintain its current momentum
• Track whether the raised EBIT guidance produces sustainable EPS growth
• Reassess the technical recovery below CHF 175
• Treat a sustained loss of CHF 155–165 as major invalidation
Kuehne+Nagel may be recovering—but the best entry may have already occurred.
That does not make the stock bearish. It makes patience part of the strategy.
TRY THE SCANNER
This setup illustrates why Master Buy Scanner V2 does not turn every improving chart into an immediate BUY.
The indicator evaluates:
• Technical timing
• Business quality
• Valuation and debt
• Growth outlook
• Entry quality
• Setup maturity
• Model position size
• False-bottom and value-trap risk
KNIN has quality, improving earnings and confirmed recovery—but the scanner still recommends 0% because the current entry is too extended.
Add Master Buy Scanner V2 to your own TradingView charts here:
Run it across your watchlist and comment with the next ticker you want me to analyse.
THE QUESTION
What would you do with KNIN around CHF 202?
A — Wait for a pullback toward CHF 190
B — Buy only after a confirmed breakout above CHF 215
C — Avoid because the valuation already reflects the recovery
Comment A, B or C—and share your Kuehne+Nagel thesis below.
This is not financial advice. Always conduct your own research and manage risk according to your investment horizon.
 Long
Long
ABBN | The $100 Trillion Automation OpportunityA Global Automation Leader Positioned for the AI Industrial Revolution
ABB Ltd is one of the world’s leading industrial technology companies, specializing in electrification, automation, robotics, and motion technologies. The company operates at the intersection of several powerful long term trends, ai, industrial automation, renewable energy, electric vehicles, and smart manufacturing.. As companies worldwide invest heavily in improving efficiency and reducing labor costs, ABB is positioned as a key supplier of the technologies needed for the next generation of industrial infrastructure
Unlike many pure technology companies, ABB benefits from real world demand across factories, energy networks, transportation, and infrastructure projects
Strong Business Model Built Around Automation and Electrification
ABB’s business is divided into four major segments: Electrification, Motion, Process Automation, and Robotics & Discrete Automation. The Electrification segment benefits from rising electricity demand, grid modernization, renewable energy expansion, and data center growth. Meanwhile, ABB’s automation and robotics businesses are gaining momentum as manufacturers increasingly adopt robots and intelligent systems to improve productivity. The company’s diversified global customer base reduces dependency on any single industry, allowing ABB to generate stable revenue streams across different economic cycles
AI, Robotics, and Smart Manufacturing: The Biggest Growth Drivers
The global shift toward automation is one of ABB’s strongest growth opportunities. With rising labor costs, aging populations, and increasing demand for efficiency, companies are accelerating investments in robotics and automated production systems. ABB’s robotic solutions are used in industries ranging from automotive and electronics to logistics and healthcare. The rise of AI powered factories could create another growth wave, as businesses integrate intelligent robots, predictive maintenance systems, and autonomous production lines. ABB is positioned to benefit as factories become more connected and data driven.
Financial Performance and Operational Strength
ABB has shown strong financial discipline in recent years, focusing on improving margins, simplifying its business structure, and increasing shareholder returns. The company has benefited from strong demand in electrification and automation while maintaining a healthy balance sheet. ABB has also pursued strategic portfolio optimization, including selling non-core businesses and focusing resources on higher growth areas. This approach has helped improve profitability and made ABB a more efficient company compared with previous years. Investors are watching revenue growth, operating margins, and order momentum as key indicators of future performance
ABB Delivers Record Orders and Strong AI Driven Growth
ABB’s latest Q2 2026 earnings showed strong momentum across its core businesses, reinforcing the company’s position as a major beneficiary of electrification and industrial automation trends. The company reported $9.475 billion in revenue, up 14% year over year, while comparable revenue increased 12%. Orders reached a record $12.042 billion, rising 30% year over year, highlighting strong demand from customers investing in automation, energy infrastructure, and AI related data center expansion. Operational EBITA increased 20% to $1.925 billion, with a margin of 20.2%, while basic EPS came in at $0.68, up 8% compared with the previous year. ABB also generated $1.15 billion in operating cash flow and achieved a strong 28.4% return on capital employed, showing improving efficiency and profitability
The company’s growth outlook was further strengthened by its announced $5.5 billion acquisition of Rotork, which aims to expand ABB’s automation and electrification portfolio and create additional long term growth opportunities. With record order momentum, exposure to AI infrastructure, and continued demand for industrial automation, ABB’s latest results suggest the company is well positioned for the next phase of global industrial transformation
Valuation, Industrial Cycles, and Global Competition
Despite its strong long term outlook, ABB faces several risks. Industrial companies are highly sensitive to economic cycles, and a slowdown in global manufacturing could reduce demand for automation equipment. Competition remains intense, especially from companies like Siemens, Schneider Electric, and other automation specialists plus ABB’s valuation must be justified by continued earnings growth, as investors have already priced in some optimism around automation and AI related industrial spending.
Any slowdown in orders or weaker guidance could create pressure on the stock price
ABB represents a unique investment opportunity because it combines traditional industrial strength with exposure to some of the biggest technological trends of the coming decade. The company is not simply a manufacturing equipment provider; it is becoming a key player in the transition toward smarter, more automated, and energy efficient industries. While short term volatility may appear due to economic uncertainty and valuation concerns, ABB’s leadership in electrification, robotics, and automation gives it strong long term growth potential.
For investors seeking exposure to the industrial AI revolution, ABBN remains a company worth closely watching as the world moves toward a more automated future. you in?
 Long
Long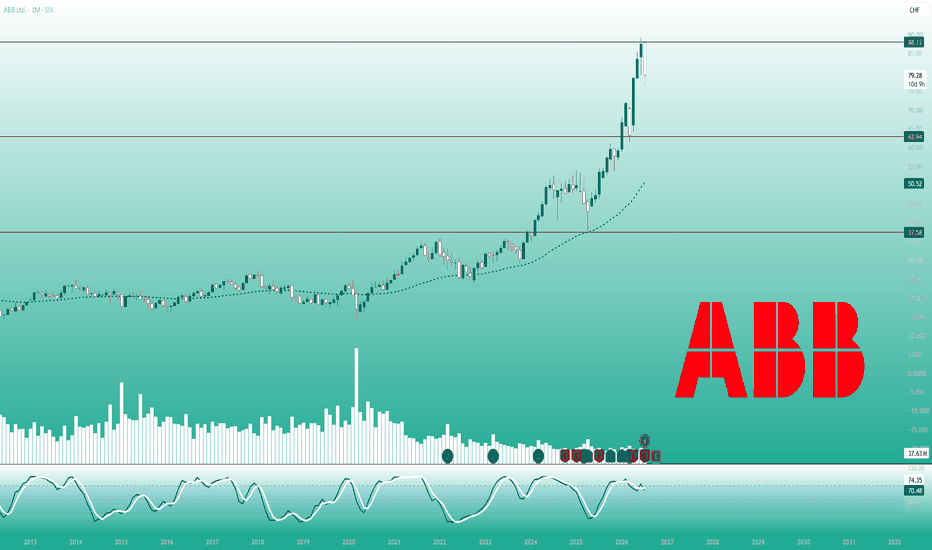
UBS Warns of Increasing Market FragilityUBS Warns of Increasing Market Fragility Despite Calm VIX as Earnings Season Begins
[/b ]Ion Jauregui – Analyst at ActivTrades
The apparent stability reflected by the VIX volatility index may be concealing an increase in risk in the U.S. equity market, according to a UBS report, which warns of elevated dispersion among individual stocks at a time when the corporate earnings season is beginning. The Swiss bank said that its proprietary Turbu-lens indicator has reached a level of 0.9, its highest since September 2025, a reading that points to a higher probability of volatility episodes even though the VIX remains at historically moderate levels.
The bank explained that the volatility recorded by individual stocks is currently three times higher than that observed for the index as a whole, a divergence that, in its view, reflects an apparently stable market, although with significant differences in the performance of individual companies.
The warning coincides with the start of the second-quarter earnings season in the United States, at a time when market consensus expects corporate earnings growth of around 24%. UBS believes that such elevated expectations leave little room for disappointment and increase the risk of sharp moves in stocks that fail to meet forecasts. The bank therefore recommends prioritizing hedging strategies on individual companies, particularly in the technology, energy and financial sectors, rather than relying on broad index hedges.
UBS Group AG, Switzerland's largest bank and one of the world's leading wealth managers following the integration of Credit Suisse in 2023, operates in investment banking, asset management and private banking, with a presence in more than 50 countries.
The divergence between the index's low volatility and the high dispersion among individual stocks reflects a market that is more vulnerable than traditional indicators suggest. In my view, such demanding earnings expectations leave little room for disappointment, which could translate into sharp price movements in companies that fail to meet forecasts. In this environment, selective hedging strategies may prove more effective than an approach based solely on index hedges.
UBS Technical Analysis
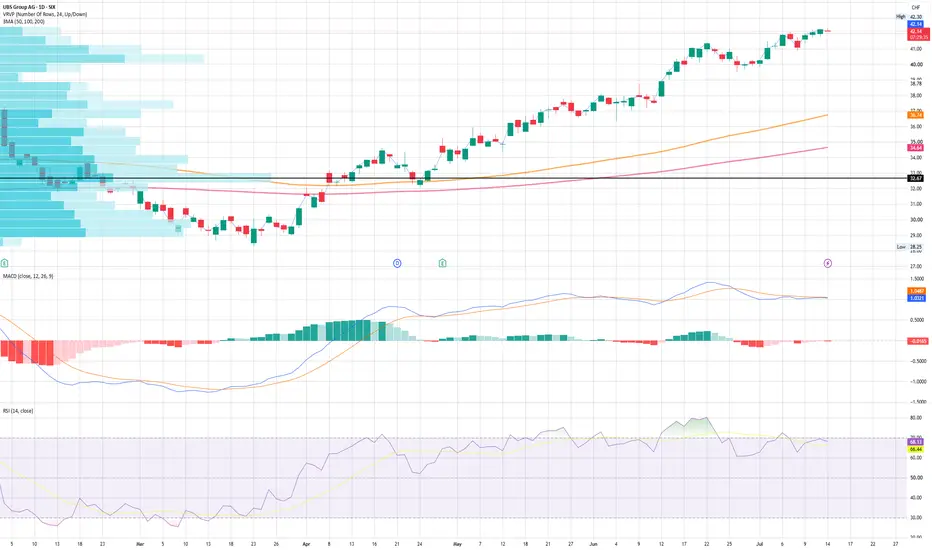
UBS shares, listed on the SIX Swiss Exchange, maintain a bullish long-term technical structure. After establishing support at CHF 32.12, the stock has developed a sequence of higher highs and higher lows since May, breaking through resistance levels at CHF 34.60, CHF 38.39 and CHF 41.42.
After consolidating the move with support around CHF 39.54, the stock was trading during the early hours of Tuesday's session in the CHF 42.20-42.25 range, extending its bullish momentum. From a technical indicator perspective, the RSI stands at 69.03, close to the overbought threshold, reflecting the strength of the rally that began in May. Meanwhile, the MACD remains in positive territory and is showing a phase of stabilization following the latest upward leg. The moving averages continue to display a bullish and expanding configuration, a pattern that keeps the primary uptrend intact as long as the price holds above the support levels established over recent weeks.
*******************************************************************************************
The information provided does not constitute investment research. The material has not been prepared in accordance with the legal requirements designed to promote the independence of investment research and such should be considered a marketing communication.
All information has been prepared by ActivTrades ("AT"). The information does not contain a record of AT's prices, or an offer of or solicitation for a transaction in any financial instrument. No representation or warranty is given as to the accuracy or completeness of this information.
Any material provided does not have regard to the specific investment objective and financial situation of any person who may receive it. Past performance and forecasting are not a synonym of a reliable indicator of future performance. AT provides an execution-only service. Consequently, any person acting on the information provided does so at their own risk. Political risk is unpredictable. Central bank actions can vary. Platform tools do not guarantee success.
UBS: The Coil Before the Spring (Quality FInancial)UBSG (UBS Group AG) - Resistance Turned Launchpad: A Multi-Year Technical Setup
Timeframe: 1W (Weekly) | Exchange: SIX Swiss Exchange | Bias: Bullish
OVERVIEW
UBS Group AG is presenting one of the most technically compelling setups in European financials right now. A multi-year ascending channel, a critical resistance-turned-support test at CHF 33, a Bollinger Band bounce from the lower band now testing the middle basis, and a MACD trajectory pointing toward a bullish cross are all converging simultaneously, precisely as the bank approaches a major fundamental catalyst with Q1 2026 earnings on April 29.
THE TECHNICAL STORY
Stage 1 - The Long-Term Ascending Channel
The most important structural feature on this weekly chart is the ascending channel that has defined UBS's price action for the past several years. The lower trendline has provided reliable support at every major pullback (marked by the green circles) while the upper trendline has acted as a natural resistance ceiling during periods of euphoria, marked by the red circles.
What makes this channel particularly powerful is its consistency. Each time price has touched the lower trendline, buyers have emerged with conviction, the bounce from CHF 14 in 2023, the recovery from CHF 21 in early 2024, and most recently the bounce from CHF 27.71 in 2025 all respected the same structural support. This is not coincidence, it reflects sustained institutional accumulation across the entire channel.
Stage 2 - Strong Resistance Level at CHF 33
The horizontal resistance level at CHF 33 has been the defining price point for UBS across multiple timeframes. This level first acted as major resistance in 2023, capping the initial post-Credit Suisse acquisition recovery rally, marked by the prominent red circle on the chart. Price was rejected there decisively.
However, and this is the critical observation, price has now returned to this exact level from below and is testing it as support rather than resistance.
The classic technical principle of resistance turning into support is playing out in real time. The green circle at the current price zone shows price bouncing from CHF 32.44 and closing the week at CHF 33.38, a +2.58% weekly candle, right at this pivotal level.
The fact that this CHF 33 level also coincides with the midpoint of the ascending channel adds a second layer of confluence, it is simultaneously horizontal support and channel midpoint support. Double confluence at a key level is one of the stronger setups in technical analysis.
Stage 3 - The Projected Move
If CHF 33 holds as support, which the current price action suggests, the measured move target points toward the upper channel trendline, currently situated around CHF 44-46. The green arrow on the chart illustrates this trajectory. At today's closing price of CHF 33.38, that implies approximately 32-38% upside to the channel top over the coming 12-18 months, which aligns almost perfectly with the 12-month analyst consensus target of CHF 45+.
BOLLINGER BANDS - LOWER BAND BOUNCE MEETS MIDDLE BAND RESISTANCE
This is where the Bollinger Band picture becomes particularly instructive and adds a third layer of technical confluence to the setup.
Price recently touched and bounced convincingly from the lower Bollinger Band near the CHF 27.71 low, a textbook lower band touch on the weekly timeframe. Lower band touches of this nature are historically powerful mean reversion signals, particularly when they occur within a well-defined ascending channel as they do here. The combination of lower band support and ascending channel lower trendline support at the same price zone created a double-layered floor that buyers defended aggressively, visible in the strong weekly bounce candles that followed.
The subsequent recovery has now carried price upward through the channel and directly into the Basis Middle Band, the 20-week simple moving average, which is currently situated precisely at the CHF 33-33.50 zone. This is where the chart becomes especially interesting: price is not sailing through this level freely. Instead it is finding minor resistance at the middle band, pausing and consolidating as the weekly candle digests this level.
This behaviour is entirely normal and technically expected. The middle Bollinger Band acts as a dynamic resistance level during a recovery from the lower band, it represents the mean of the distribution, and price typically needs to prove itself above this level before the next leg higher can begin. The current pause at CHF 33-33.50 is therefore not a sign of weakness, it is a healthy consolidation at a technically logical resistance point.
The critical question is whether this week's price action can produce a decisive weekly close above the middle band. Historically on the UBSG weekly chart, each time price has reclaimed the middle band from below after a lower band touch, the subsequent move has extended toward the upper Bollinger Band, which currently sits near CHF 40-42. A confirmed close above the middle band would technically project that upper band as the near-term target, representing approximately 20-26% upside from current levels before the channel top target of CHF 44-46 comes into play.
The sequence therefore becomes a two-step technical story: first, clear the middle band resistance at CHF 33-33.50 on a weekly closing basis; second, use that breakout as a springboard toward the upper band at CHF 40-42 and ultimately the ascending channel top near CHF 44-46.
Wednesday's Q1 earnings on April 29 is the catalyst most likely to provide the energy needed to break price decisively above the middle band. A fifth consecutive earnings beat would provide exactly the kind of fundamental push needed to resolve this minor resistance in favour of the bulls.
THE MACD — TRAJECTORY TOWARD BULLISH CROSS
The second chart provides critical momentum confirmation. The MACD is currently at deeply negative territory, the histogram bars are red and the signal is –1.5611, reflecting the correction from the January 2026 highs near CHF 38.
However, the key observation is the trajectory. Both the MACD line (blue) and signal line (orange) are clearly curling upward from their lows. The histogram bars, while still red, are progressively shrinking, classic early-stage momentum reversal behaviour. The arrow on the chart identifies this precisely: the setup is pointing toward an imminent bullish MACD cross, where the MACD line crosses above the signal line from below.
Looking at the previous two bullish MACD crosses on this weekly chart, both produced sustained multi-month rallies that tracked the ascending channel cleanly, the first from CHF 14 to CHF 28, the second from CHF 21 to CHF 38. A third bullish cross emerging now, from the same deeply oversold MACD levels, would establish a compelling pattern of consistency.
The MACD cross has not yet confirmed, and disciplined traders should note this. The setup is pointing toward it, not completing it. Confirmation of the cross on the weekly timeframe would be the strongest technical green light for a full position. Critically, a successful close above the middle Bollinger Band and the MACD bullish cross confirming simultaneously would represent a powerful dual confirmation signal, one that has historically preceded the most decisive moves in this ascending channel.
THE BULL CASE - TARGET CHF 44-46
Four technical elements now align simultaneously:
Channel support holding at CHF 33 - resistance turned support
Lower Bollinger Band bounce confirmed, now testing the middle band
Middle band resolution - a weekly close above CHF 33.50 opens path to upper band at CHF 40-42
MACD trajectory toward bullish cross from deeply oversold levels
When four independent technical signals point the same direction from the same price level, the probability of follow-through increases materially. The upper channel target of CHF 44-46 represents the primary bull case, a 32-38% move from current levels over 12-18 months.
Near-term targets:
CHF 39.62 - most recent swing high and first meaningful resistance before upper band
CHF 40-42 - upper Bollinger Band
CHF 44-46 - ascending channel upper trendline, full measured move target
THE BEAR CASE - INVALIDATION AT CHF 30
The thesis is invalidated on a weekly close below CHF 30, which would breach both the horizontal support and the ascending channel lower trendline simultaneously, and would also signal a failure of the lower Bollinger Band bounce, a rare but serious technical breakdown pattern. Such a failure would technically open the door toward CHF 27.71 and potentially the CHF 25-26 zone. A weekly close below CHF 30 is the clear stop level for this setup.
The Swiss government's proposed $20 billion capital requirement for UBS is the fundamental risk that could drive a technical breakdown, watch Wednesday's earnings call commentary on this specifically.
FUNDAMENTAL CATALYST - APRIL 29 EARNINGS
Technical setups gain conviction when they align with fundamental catalysts. UBS reports Q1 2026 earnings on April 29, with consensus expecting EPS of $0.85, a 66.7% year-on-year increase. UBS has beaten EPS consensus in each of the last four consecutive quarters, most recently by 48%. A fifth consecutive beat at this technically critical level would provide the fundamental trigger for price to break decisively above the middle Bollinger Band, accelerate the MACD bullish cross, and confirm CHF 33 as the new floor.
CONCLUSION
UBS presents a technically layered and well-defined risk/reward setup on the weekly chart. Price has bounced from the lower Bollinger Band, recovered through the ascending channel, and is now pausing at the exact confluence of horizontal resistance-turned-support at CHF 33 and the middle Bollinger Band basis line. The MACD is curling upward toward a bullish cross from deeply oversold levels. A decisive weekly close above the middle band, most likely catalysed by Wednesday's earnings, would technically confirm the next leg of the move, with near-term targets at CHF 39.62 and CHF 40-42, and the full measured move projecting toward CHF 44-46 at the ascending channel top. Invalidation on a weekly close below CHF 30.
The chart is set. Wednesday delivers the verdict.
PROPOSED STRATEGY
We have taken a 50% of our intended position and will acquire a full position after Wednesday's Earnings Call
Not financial advice. Technical analysis does not guarantee future price performance.
If you enjoyed reading our idea please boost to support and follow to not miss any future publishments 🚀🚀🚀  Long
Long
CSW Industrials (CSWI): A High-Quality Compounder That CurrentlyExecutive Summary:
Margin-of-safety verdict: CSWI appears to be a high-quality niche industrial compounder, but current valuation suggests the stock trades materially above conservative intrinsic value estimates, leaving little downside protection for long-term investors.
CSW Industrials is a specialized industrial manufacturer focused on HVAC, plumbing, coatings, sealants, lubricants, and maintenance consumables used throughout the repair, renovation, and maintenance economy. Over the past decade the company has steadily built an impressive record of value creation through disciplined acquisitions, operational improvement, and expanding free cash flow margins.
The underlying business has clear strengths. Much of the demand is tied to the installed base of buildings and infrastructure rather than purely to new construction. Free cash flow margins have expanded significantly over the past decade, and returns on invested capital remain comfortably above the cost of capital.
Valuation, however, is where the story changes. Several independent valuation approaches place intrinsic value near the low $200 range per share. With the stock recently trading around the $300 range, the market appears to be assigning a sizable premium. For value investors, that leads to a familiar conclusion: a strong business that currently lacks an adequate margin of safety.
One Stock, Dozens of Voices:
This view is not based on a single analyst’s perspective. CrowdWisdom aggregated 18 independent sources for CSWI (16 financial research articles (web); 1 live market intelligence feeds; 1 verified financial data checks (Yahoo Finance)) and synthesized the shared thesis: where traders, investors, and researchers broadly agree, where their opinions diverge, and what the market may be overlooking.
The findings were then pressure-tested by comparing opposing viewpoints: a bull case, a bear case that challenges the consensus, and an examination of what expectations appear embedded in the current price. All financial metrics were cross-validated against live market data.
What follows highlights areas of agreement, areas of disagreement, and whether the stock offers any meaningful margin of safety at current prices.
Business Quality and Moat Durability:
CSW Industrials operates in the less glamorous but essential backbone of building infrastructure. The company sells specialized consumables and components used in HVAC systems, plumbing installations, industrial maintenance, and building construction.
Unlike large equipment manufacturers that depend heavily on new construction cycles, much of CSWI’s revenue comes from products that are consumed or replaced during normal maintenance. Sealants dry out, lubricants get used up, and installation accessories require replacement over time.
This creates a structural demand driver tied to the installed base of buildings and mechanical systems. Even during economic slowdowns, buildings still need maintenance and HVAC systems still require servicing.
The company’s competitive advantage appears to come from several smaller factors rather than one dominant barrier.
First is product specification and contractor familiarity. Contractors tend to rely on trusted brands for mission‑critical installation components. When a failure could damage equipment or cause leaks, the small price difference between brands often matters far less than reliability.
Second is distribution embeddedness. CSWI sells through established distribution networks that serve HVAC technicians, plumbers, and industrial maintenance teams. Once products are integrated into distributor inventories and contractor workflows, switching becomes inconvenient.
Third is niche fragmentation. Many of the markets CSWI operates in remain highly fragmented with numerous small private competitors. That environment creates opportunities for bolt‑on acquisitions that broaden the product portfolio and expand distribution reach.
Taken together, these advantages create a modest but durable competitive moat.
Moat verdict: STABLE. There is little evidence the advantage is rapidly widening, but there is also little indication it is deteriorating.
Return on Invested Capital (ROIC):
Return on invested capital remains one of the most important metrics for evaluating long-term compounding businesses.
CSWI has historically generated approximately 17 percent ROIC, a strong level for a mid‑cap industrial manufacturer and comfortably above the estimated cost of capital.
Historically the business required relatively little capital investment. Growth was driven more by product expansion and operational improvements than by large fixed asset spending.
The key question is the trajectory of incremental ROIC going forward.
Growth is increasingly supported by acquisitions. In recent years CSWI completed multiple bolt‑on deals, including the acquisition of Aspen Manufacturing and other niche product manufacturers.
Acquisition-driven growth creates two possible paths.
If management continues buying companies at reasonable prices and integrating them effectively, incremental ROIC could remain in the mid teens. That would allow intrinsic value to compound at an attractive rate.
If acquisition multiples rise or integration becomes more challenging as the company scales, incremental ROIC could drift toward the industrial sector average in the low teens or even high single digits.
The company’s decision to issue approximately $347 million in equity to fund expansion suggests management sees meaningful acquisition opportunities ahead. At the same time, equity issuance introduces mild dilution risk if acquisition returns disappoint.
For now, management’s historical record supports the view that capital allocation has been disciplined. The forward trajectory, however, is less certain.
Quality of Earnings:
One of the most notable developments in CSWI’s financial history has been the improvement in free cash flow.
Since 2014, net income has grown at approximately a 14.6 percent compound annual rate. Free cash flow has grown much faster, roughly 32 percent annually over the same period.
A major driver has been the expansion in free cash flow margins. FCF margins increased from roughly 2.8 percent of revenue in 2014 to nearly 20 percent in recent years.
When free cash flow grows faster than accounting earnings, it often signals improving capital efficiency or stronger operating discipline.
That said, such dramatic margin expansion raises an obvious question. Are current margins sustainable, or do they represent a cyclical high supported by operating leverage and pricing power?
Without full visibility into capital expenditure intensity, working capital dynamics, and segment-level profitability, the answer is not entirely clear. What is clear is that the current margin profile is unusually strong for a specialty industrial manufacturer.
Capital Allocation Scorecard:
Management’s capital allocation record since the 2015 spin off has generally been thoughtful and disciplined.
Acquisitions:
Bolt‑on acquisitions have been the primary engine of growth. Management has focused on small niche product businesses that expand CSWI’s product offering and distribution footprint.
Grade: B+. Historical transactions appear to have been accretive, although the growing reliance on acquisitions does introduce integration risk.
Shareholder Returns:
The company pays a modest dividend yielding roughly 0.4 percent. Dividends remain small because management prefers reinvesting capital into acquisitions and organic growth initiatives.
Share repurchases occur periodically but are not a major capital allocation priority.
Grade: B. Capital is largely reinvested into the business rather than distributed.
Equity Issuance:
The company issued roughly 1.265 million shares at $285 per share, raising approximately $347 million. While dilution is rarely ideal, issuing shares at premium valuations to finance acquisitions can be a rational decision.
Grade: Neutral.
Customer and Revenue Concentration:
Precise customer concentration data is not available in the evidence set.
CSWI sells primarily through distributors that serve HVAC contractors, plumbing wholesalers, and industrial maintenance customers.
While this suggests diversification at the end-customer level, channel concentration could still be significant. Large distributors or big-box retailers may hold bargaining power if product categories become commoditized.
Without clear disclosure of top customers or distributor exposure, this remains an open risk.
Management Alignment:
The research set indicates periodic insider share sales by executives, although this is common in mature public companies.
Detailed information on insider ownership and compensation structures was not available in the evidence pack.
In the absence of stronger alignment signals such as large insider ownership stakes, investors are left to judge management largely by its track record of capital allocation discipline.
10-Year Durability Test:
For long-term investors, the key question is whether the business will still look recognizable a decade from now.
In CSWI’s case, the core demand driver appears durable. Buildings, HVAC systems, and industrial equipment require ongoing maintenance regardless of technological change.
Unlike industries facing rapid disruption, the HVAC and plumbing infrastructure ecosystem evolves slowly. Replacement cycles for major systems often span decades.
The primary long-term risks are more economic and competitive than technological.
Some product categories, such as sealants and lubricants, carry commoditization risk. If distributors aggressively promote private-label alternatives, pricing power could weaken.
Distributor consolidation presents another risk. If a small number of wholesalers gain dominant market share, they may push for higher rebates or lower supplier pricing.
Finally, acquisition discipline must remain intact. Years of successful compounding can be undone by a handful of overpriced deals.
Overall durability outlook: reasonably predictable over ten years.
Multi-Year Thesis (3 to 7 years):
Bull Case Scenario:
Probability: 35 percent
Estimated intrinsic value: $300
Assumptions:
Organic revenue growth remains in the mid single digits supported by repair and maintenance demand.
Bolt-on acquisitions continue generating mid teens returns on invested capital.
EBITDA margins remain near current levels around the high twenties due to operational efficiency and pricing power.
Base Case Scenario:
Probability: 45 percent
Estimated intrinsic value: $255
Assumptions:
Organic growth moderates but remains positive due to maintenance driven demand.
Acquisitions represent a larger portion of revenue growth but incremental ROIC declines slightly to roughly 12 to 14 percent.
Margins stabilize slightly below peak levels but remain above typical industrial peers.
Bear Case Scenario:
Probability: 20 percent
Estimated intrinsic value: $180
Assumptions:
Margins revert toward industry norms near 18 to 20 percent EBITDA.
Growth becomes primarily acquisition driven with lower returns on invested capital.
Housing and renovation markets weaken, reducing contractor demand.
Margin of Safety Verdict:
Current trading levels around the low $300 range exceed most conservative intrinsic value estimates.
Independent valuation frameworks cluster near $198 to $203 per share, while the weighted scenario intrinsic value from the probabilistic model above is approximately $256.
That leaves little or no margin of safety and creates meaningful downside if optimistic assumptions fail.
For value investors, this is the gating conclusion. CSWI appears to be a strong business but currently trades at a valuation that assumes continued growth and sustained peak margins.
That makes the analysis intellectually interesting, but not a compelling purchase at current prices.
Peak Margin Stress Test:
Current profitability metrics are unusually strong.
EBITDA margins recently approached approximately 27 to 28 percent, far above typical specialty industrial ranges.
If margins reverted toward 18 to 20 percent, operating profit could decline roughly 25 to 30 percent assuming stable revenue.
Combine that with multiple compression from roughly 28 to 36 times earnings toward peer averages near 18 to 20 times and equity value could decline by 40 to 50 percent.
Such an outcome would place the stock closer to the $180 to $200 range.
Valuation Framing:
What is priced in:
Sustained double digit earnings growth
Successful acquisition integration
Maintenance of current margin levels
Continued demand from the repair and renovation economy
What is not priced in:
Meaningful margin normalization
Acquisition integration failures
Slowing organic growth
Distributor pricing pressure
Perception vs Reality:
Perception:
CSWI is a defensive compounder insulated from economic cycles.
Reality:
Repair and maintenance demand does provide some stability, but the company still faces exposure to construction cycles, contractor demand, and acquisition execution risk.
Why This May Be Misunderstood:
The company’s product portfolio tends to fly under the radar. Specialty consumables used in HVAC and plumbing systems rarely attract the same attention as high-profile industrial technologies.
That obscurity can sometimes create mispricing.
In this case the opposite may be happening. Strong historical performance has drawn growth-oriented investors, which may have pushed the valuation beyond conservative intrinsic value estimates.
Three Measurable Things to Watch Next Quarter:
Organic revenue growth excluding acquisitions
Incremental ROIC on recent acquisitions
EBITDA margin stability versus potential early signs of normalization
Historical Conviction Drift:
Investor sentiment has gradually shifted from skepticism after the company’s spin off toward broad admiration of its margin expansion and acquisition discipline.
As confidence in the business increased, valuation multiples expanded alongside it.
The key question now is whether expectations have moved ahead of fundamentals.
Disconfirming Evidence:
The strongest argument against the cautious view presented here is the company’s decade-long record of disciplined capital allocation.
If management continues acquiring niche businesses at attractive valuations while maintaining operational efficiency, intrinsic value could compound faster than skeptics expect.
In that case, today’s valuation premium could ultimately prove justified.
Risks:
Overpaying for acquisitions during industry consolidation
Margin compression from raw material costs or distributor pressure
Economic downturn reducing renovation and contractor demand
Equity dilution from additional capital raises
Private label competition eroding pricing power
Summary:
CSW Industrials appears to be a well-run niche industrial compounder with attractive exposure to the repair and maintenance economy.
The business generates strong free cash flow, earns healthy returns on invested capital, and operates in relatively stable infrastructure markets.
However, valuation remains the decisive variable.
At current prices the stock appears to trade significantly above conservative intrinsic value estimates and leaves little margin of safety.
For disciplined value investors, the rational stance today is watchful patience rather than ownership.
Data Snapshot:
Metric: Company
Metric: Value
Current Price (CSWI): N/A
Market Capitalization: N/A
Shares Outstanding: N/A
Trailing P/E: N/A
Forward P/E: N/A
Enterprise Value (EV): N/A
EV/EBITDA: N/A
Revenue (TTM): N/A
Gross Margin: N/A
Operating Margin: N/A
Free Cash Flow (FCF): N/A
FCF Yield: N/A
52-Week Range: N/A
Sector: N/A
Industry: N/A
References:
This analysis reviewed approximately 1096 article sources and 0 video transcripts.
1. Alpha Spread. CSW Industrials Financials and Business Overview. www.alphaspread.com
2. ValueInvesting.io. CSWI Fair Value Calculation Using Peter Lynch Formula. valueinvesting.io
3. Yahoo Finance. FUL vs. CSWI: Which Stock Is the Better Value Option? finance.yahoo.com
4. Yahoo Finance. CSW Industrials (CSWI) Margin Beat Reinforces Bullish Earnings Narrative. finance.yahoo.com
5. Yahoo Finance. CSW (NASDAQ:CSWI) Reports Sales Below Analyst Estimates In Q1 Earnings. finance.yahoo.com
6. Yahoo Finance. What To Expect From CSW Industrials Inc (CSWI) Q3 2025 Earnings. finance.yahoo.com
7. Yahoo Finance. Is Now An Opportune Moment To Examine CSW Industrials, Inc. (NASDAQ:CSWI)?. finance.yahoo.com
8. Yahoo Finance. What Is CSW Industrials, Inc.'s (NASDAQ:CSWI) Share Price Doing?. finance.yahoo.com
9. Yahoo Finance. A Look At CSW Industrials (CSW) Valuation After Its Higher Quarterly Dividend Announcement. finance.yahoo.com
10. Nasdaq. The Bull Case for CSW Industrials (CSWI). www.nasdaq.com
11. Eagle Point Capital. Keep an Eye on CSW Industrials. www.eaglepointcap.com
12. StockTitan. CSW Industrials Stock Overview. www.stocktitan.net
13. Intellectia. CSWI Stock Price and Forecast Analysis. intellectia.ai
14. Barchart. CSWI Analyst Ratings. www.barchart.com
15. Tiger Brokers. CSW Industrials Corporate News and Earnings Releases. www.itiger.com
16. Public.com. CSWI Stock Forecast and Dividend Information. public.com
17. Reddit r/ValueInvesting. CSW Industrials Discussion Thread. www.reddit.com
18. Simply Wall St. CSW Industrials Stock Analysis. simplywall.st
19. CSW Industrials Investor Relations. Fiscal 2025 Second Quarter Results Press Release. cswindustrials.gcs-web.com
Disclaimer:
This analysis is for informational purposes only and does not constitute investment advice. Investors should perform their own due diligence and consider their financial circumstances before making investment decisions.  Long
Long
Long 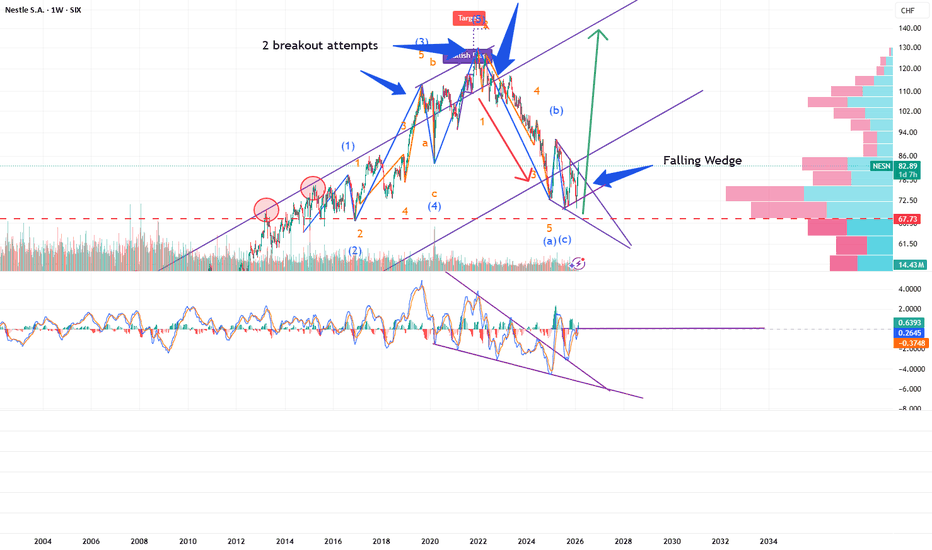
Short 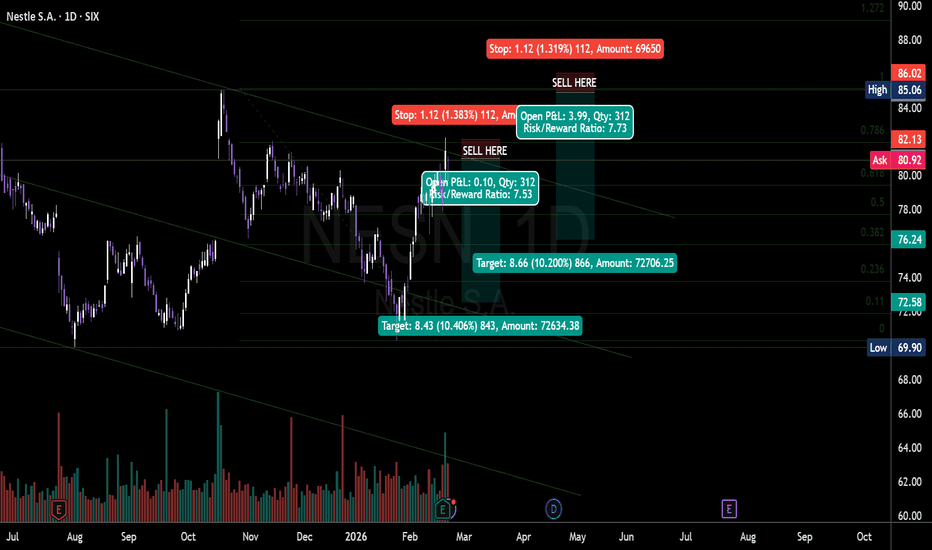
Long 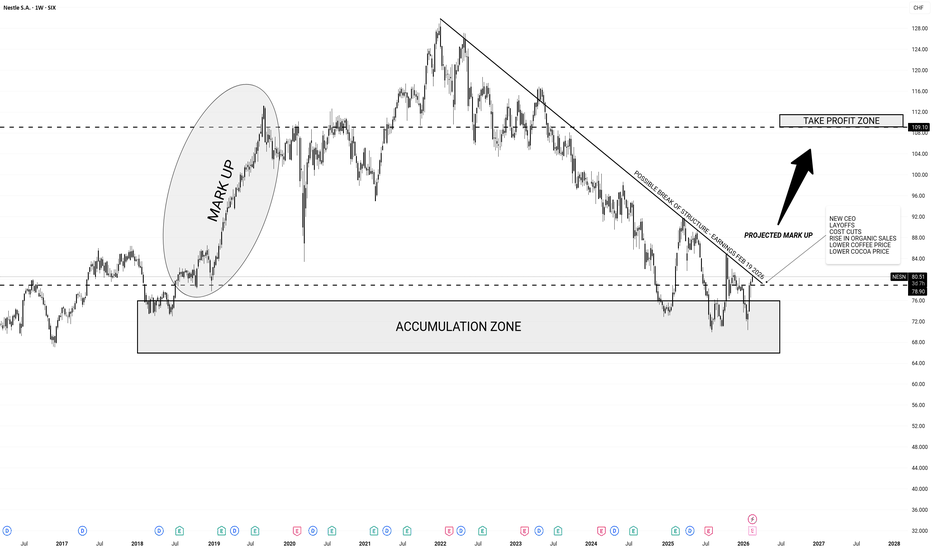
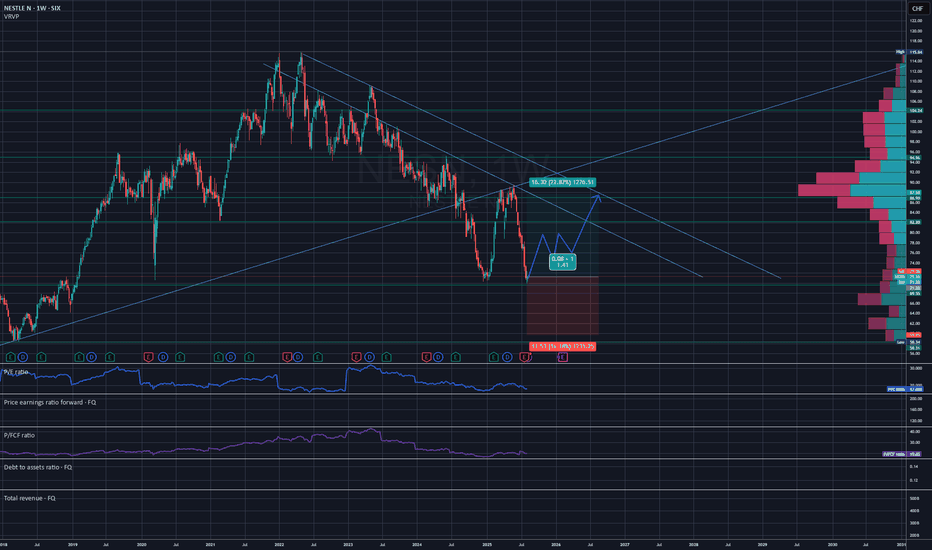
Nestle SHOULD be in your portfolio!!!Nestlé has traded within a well-defined ascending channel since 2001, respecting both support and resistance with remarkable consistency over multiple market cycles. Recently, the stock lost support and broke below the rising channel, transitioning into a falling wedge formation, a pattern that is historically bullish, with an approximate 70% probability of an upside breakout.
At present, Nestlé is trading near the Value Area High (VAH) on the Volume Range Visible Profile (VRVP), a level that often acts as a decision point between continuation and reversal. Given the confluence of this volume-based support and the structure of the falling wedge, we believe the stock is well positioned for a bounce, with a subsequent break above resistance potentially marking the beginning of a new uptrend.
From a macro perspective, capital is increasingly rotating out of crowded U.S. equity markets and into Europe, particularly toward high-quality, defensive names. In this context, we are actively looking to increase European exposure, and Nestlé stands out as a prime candidate.
Fundamentally, Nestlé’s strength lies not just in its brands, but in habit-forming products, staples embedded in everyday consumption. This creates:
- Exceptionally sticky customer demand
- Strong pricing power, especially in inflationary environments
- Highly predictable cash flows
As investors reassess risk and shift focus from growth to quality, we believe consumer staples are well positioned to outperform in 2026. Nestlé, with its global footprint, defensive characteristics, and proven ability to compound through cycles, fits squarely within this theme.
Conclusion
In our view, and shared by several analysts, Nestlé deserves a place in a well-balanced portfolio. It offers a rare combination of technical opportunity, macro tailwinds, and fundamental resilience, making it a compelling long-term holding as market leadership broadens and capital rotates toward quality. We will be waiting for confirmation and a breakout from the falling wedge to enter.
Check back for updates and if you enjoyed the read and/or were helped with your trading please support us by boosting our idea and following us!!! Long 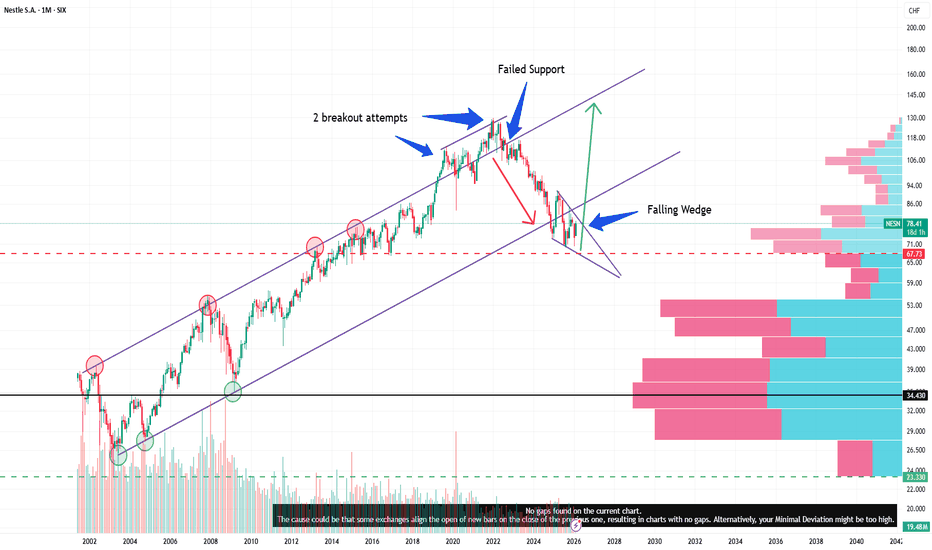
 Long
Long
Novartis Increases Purchase of Avidity BiosciencesNovartis Strengthens Its Rare Diseases Strategy with the Purchase of Avidity Biosciences
By Ion Jauregui – Analyst at ActivTrades
Novartis (SWX: NOVN) has taken an important step to strengthen its presence in therapies for rare diseases. The company announced the acquisition of Avidity Biosciences (NASDAQ: RNA) for 12 billion dollars in cash, paying 72 USD per share, 46% more than Friday's close.
As part of the deal, Avidity will separate its cardiac unit into a new publicly traded SpinCo, allowing Novartis to concentrate its resources on the rare diseases segment, a strategic area with high margin potential and lower competition. The operation comes at a critical moment, amid the loss of patents for key products such as Entresto and Cosentyx, making pipeline diversification a priority to sustain revenues.
Fundamental Analysis
The acquisition of Avidity strengthens Novartis’ portfolio in the face of patent expirations, offering a pipeline with innovative therapies and potential for sustainable growth. The company maintains a solid financial position, with sufficient liquidity to finance the operation without compromising its balance sheet. This allows it to reduce risks from declining revenues of mature products while positioning itself in a high value-added segment.
Technical Analysis (Ticker AT: NOVN.CH)
The stock is trading today around 99.47 Swiss Francs, after recently rebounding from highs of 106.88 CHF. Since then, bullish volume has been losing strength, and yesterday the 50-day moving average support was breached. The current support in the first trading hour is located at the 100-day moving average. The medium-to-long-term trend has remained bullish.
The RSI has dropped to 34.96%, reaching oversold levels, which could indicate that a technical bottom has been reached. The MACD has entered negative territory, although its signal and moving averages remain above the histogram in negative territory, with volume gradually increasing. This could suggest that if the current price loses value, it may test the 96 CHF support in the coming sessions if the 100-day moving average does not hold. The Point of Control (POC) coincides with this level, concentrating most of the trading power in this zone.
The ActivTrades Europe Market Pulse indicates a neutral risk, slightly increasing, but with no relevant market data showing correlation with these company developments.
Indicators:
RSI: 34.96%, moderate relative strength signal in oversold territory
MACD: positive, with an increasing bearish histogram, anticipating continuity of the impulse
Key support: 96 USD
Resistance: 106.88 USD highs if the current trend holds, key pivot for bullish momentum near the point of control (~102 USD)
The market interprets the acquisition as a strategic reinforcement of the pipeline and an action to diversify revenues, which could maintain bullish momentum in the short and medium term. The current correction is interpreted as a temporary devaluation following the acquisition, very common after consolidations of this type.
*******************************************************************************************
The information provided does not constitute investment research. The material has not been prepared in accordance with the legal requirements designed to promote the independence of investment research and such should be considered a marketing communication.
All information has been prepared by ActivTrades ("AT"). The information does not contain a record of AT's prices, or an offer of or solicitation for a transaction in any financial instrument. No representation or warranty is given as to the accuracy or completeness of this information.
Any material provided does not have regard to the specific investment objective and financial situation of any person who may receive it. Past performance and forecasting are not a synonym of a reliable indicator of future performance. AT provides an execution-only service. Consequently, any person acting on the information provided does so at their own risk. Political risk is unpredictable. Central bank actions can vary. Platform tools do not guarantee success.
 Long
Long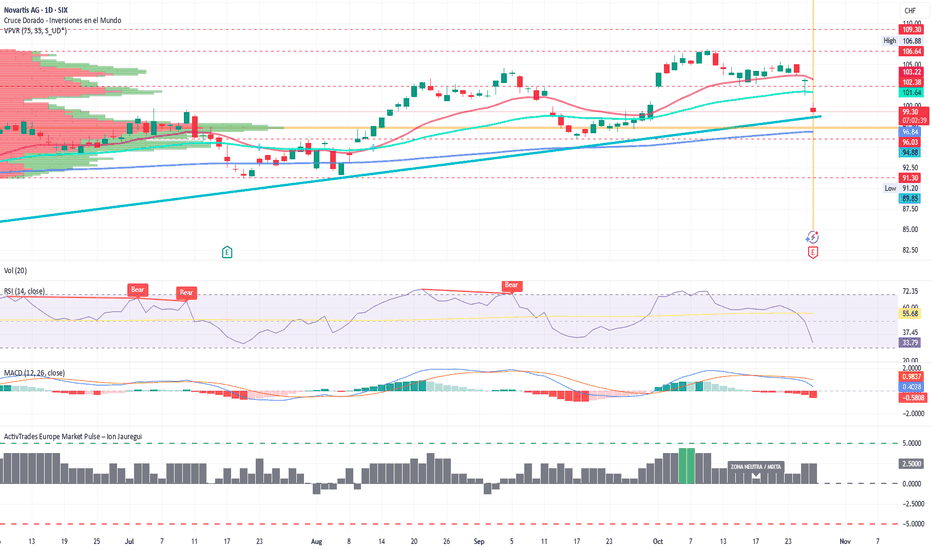
 Long
Long
Long