BYD: The EV Giant Ready to Break OutWe believe that in order to be positioned for the future, investors should have at least some exposure to the electric vehicle (EV) sector in their portfolios. In our view, one of the most compelling ways to gain this exposure is through BYD.
BYD is one of the largest EV manufacturers in the world and the clear leader in China’s electric vehicle market. China has heavily supported the EV industry through subsidies, infrastructure investment, and policy incentives, which has accelerated adoption and intensified competition among domestic manufacturers.
The Chinese EV market is currently undergoing a consolidation phase driven by aggressive price competition, often referred to as the EV price war. With dozens of manufacturers competing for market share, weaker players are increasingly pressured on margins and profitability. We believe this environment ultimately favors large, vertically integrated companies with strong scale advantages, such as BYD.
BYD’s vertically integrated model, including its in-house battery production, semiconductor capabilities, and vehicle manufacturing, gives the company a meaningful cost advantage relative to many competitors. As the price war matures and weaker firms exit the market, BYD is well positioned to capture additional market share and emerge as one of the long-term winners of the consolidation cycle.
There are also signs that the most aggressive phase of the price war may be approaching exhaustion, as margin pressure across the industry becomes increasingly unsustainable. As market conditions stabilize, companies with strong balance sheets and scale could see a significant recovery in profitability and investor sentiment.
From a technical perspective, BYD also appears to be approaching an important inflection point. In early 2024, the stock reached a major confluence of support levels, which helped stabilize the price following a prolonged decline. Later, the stock broke above a long-term downtrend resistance, signaling potential momentum shift. However, in early 2025, the rally was rejected at a higher resistance level (marked in blue) amid renewed concerns around the intensifying EV price war.
The stock has now returned to another significant confluence of support, which historically has acted as a strong demand zone. If industry conditions begin to normalize and sentiment toward the EV sector improves, BYD could be well positioned for a meaningful rebound from these levels.  Long
Long
 Long
Long
 Short
Short
 Long
Long
 Long
Long
688102 (China) - End of the Trend or Start of a Run?Shaanxi Sirui Advanced Materials has been one of the standout performers in the Chinese market, climbing over 400% in the last twelve months. Based in Xi'an, they specialize in high-performance copper alloys and components for power grids, high-speed rail, and medical imaging equipment. It is a classic momentum play that has benefited from the global push for grid infrastructure upgrades and the expansion of the electric vehicle sector.
The company’s growth has been solid, with recent reports showing a significant jump in both revenue and net income. This trend is largely driven by the demand for specialized materials in the medium and high-voltage power sectors, where they hold a strong market position. While the valuation is high, the market has been willing to pay a premium for their role in critical high-end manufacturing. The recent dip from the January highs looks like a logical pause for breath after such a steep vertical move.
On the technical side, the price has pulled back from its peak near 56 into a better value area around the 20-day SMA (the green line). This moving average has often acted as a floor during previous minor dips in this trend. The RSI has reset from overbought levels near 80 down to a neutral 57, which gives the stock some room to move again without being immediately overextended. While the MACD has crossed over, the selling pressure appears to be stabilizing as the price finds support.
Could be one to keep an eye on.
==============================
PLEASE NOTE: Nothing I post is trading advice. All investing involves risk, and past performance doesn’t predict future results. Trends can and do end. For 2026 , my goal is to try and post one new asset each day. Something outside the usual gold, silver, BTC, or big tech names. I like to find stocks worldwide showing steady trends with some good gains, a recent pullback, and signs of renewed strength. I don’t necessarily hold positions in these. They are simply companies I find interesting at the time of posting. I’ll often revisit them within a week to see how they went and share any updates. If you enjoy these posts, please BOOST and FOLLOW ME to discover more under-the-radar stocks and businesses from around the world.
==============================
 Long
Long
Nvidia of China US has limited weapons against China these days, this is one of them - imposing tariffs on Chips
(read here
Although Nvidia , a profit seeking enterprise would loves to sell more chips to China, their hands are tight in the name of national security by the US ! And this gives the enterprising companies in China to play catch up.
By looking at the financial metrics, PE ratio, customer base, products, etc, it appears Cambricon is overvalued. However, from a trend perspective and with the China government support on semiconductors, there remains a good opportunity for further growth.
We could see from chart that since August this year, the price has been moving in a sideway movement. I would want to nibble some if it comes to the support level at 1185 and lower.
As usual, please DYODD  Long
Long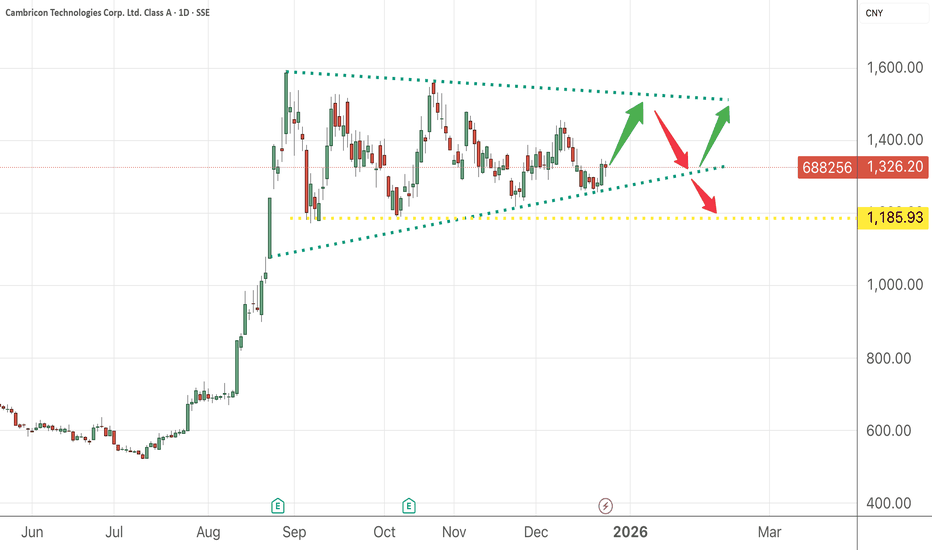
Shanghai Bailian (Group) Co., Ltd. Shanghai Bailian (Group) Co., Ltd. (SBG) is China’s largest state-owned commercial retail and distribution conglomerate.
Its business model is a diversified conglomerate that spans multiple retail formats and complementary businesses. These include department stores (e.g., Shanghai First Yaohan, Wing On Department Store), shopping malls, outlet centers, modern logistics, asset management, real estate, supermarkets (Lianhua Supermarket, Century Lianhua), and e-commerce platforms.
To maintain its dominance, especially in the highly competitive hypermarket and supermarket sector, Bailian has used acquisitions as a key growth lever. Major acquisitions over the past decade include the purchase of Jiajiayue in 2015 and Yonghui Superstores, moves that significantly strengthened its market presence. These consolidation efforts enabled Bailian to account for approximately 10% of China’s total retail supermarket market by the end of 2022.
The company formally launched its digital transformation initiative in 2020 to enhance its e-commerce capabilities. The most significant milestone in this journey was the strategic alliance announced with Alibaba Group in February 2017. This partnership aimed to advance the “New Retail” concept by integrating Bailian’s vast physical store network (4,700 stores across 200 cities) with Alibaba’s digital ecosystem for the first time.
Bailian is currently making capital-intensive investments in the luxury and experiential segments. In 2024, it announced plans to open Asia’s largest outlet mall in Shanghai. This investment seeks to capitalize on China’s outlet market, which generated annual sales of approximately 239 billion yuan in 2024, with year-on-year growth of 4%. By focusing on large-format, high-margin physical assets, Bailian aims to capture greater value from premium and experiential consumption.
The opening of Asia’s largest outlet (over 200,000 m² of built area, connecting Phase 1 — which has been open since 2006 — via pedestrian and vehicular bridges) is scheduled for 2026.
 Long
Long
 Long
Long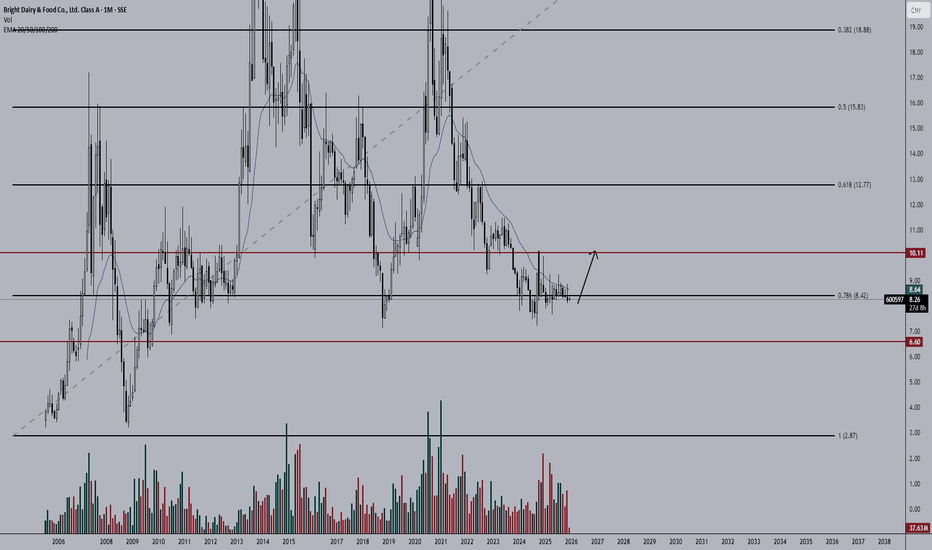
 Long
Long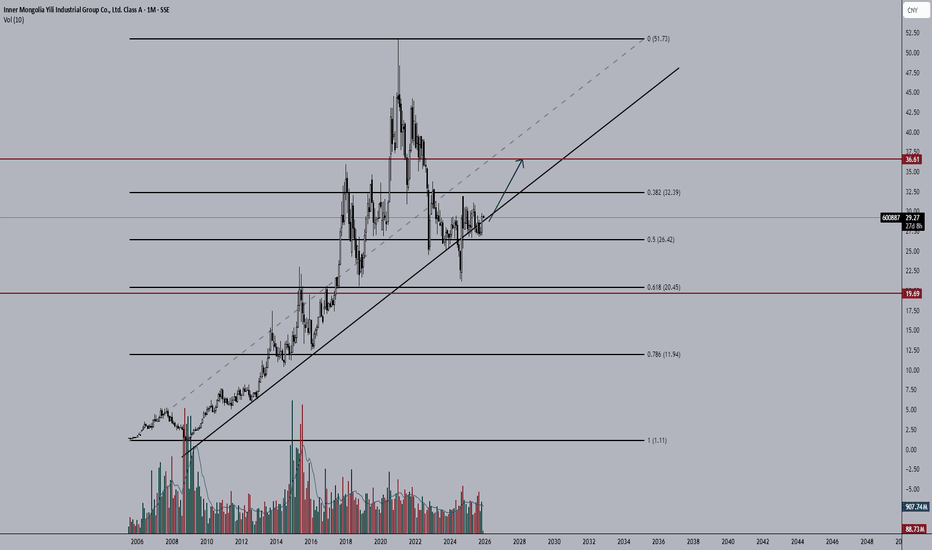
How MNCs Influence Global Trade Patterns1. Understanding Multinational Corporations (MNCs)
A multinational corporation is a company that owns or controls production, distribution, or service facilities in more than one country. Examples include Apple, Toyota, Unilever, and Tata Group. These corporations operate with a global strategy — sourcing materials where they are cheapest, producing goods where labor is most efficient, and selling in markets that offer the best demand.
Unlike domestic firms that focus solely on their home markets, MNCs operate with a worldwide perspective, blending international business practices with local adaptation. This gives them a competitive edge and allows them to significantly impact global trade dynamics.
2. MNCs as Drivers of International Trade
MNCs are the backbone of global trade. They account for a large portion of world exports and imports. According to global trade estimates, nearly two-thirds of international trade occurs within multinational networks — either between parent companies and their subsidiaries or among affiliates of the same corporate group.
By setting up production units across borders, MNCs effectively convert domestic production processes into international trade. For example, when Apple designs iPhones in the U.S., manufactures components in South Korea and China, and sells them worldwide, it creates multiple layers of trade transactions across countries. This production and supply chain integration magnifies global trade volumes and diversifies trade routes.
3. The Role of Foreign Direct Investment (FDI)
Foreign Direct Investment (FDI) is one of the primary ways MNCs influence trade patterns. Through FDI, MNCs invest in foreign markets to establish subsidiaries, acquire local firms, or build production facilities. These investments promote trade in two ways:
Export-Oriented Investment: MNCs set up production bases in developing countries to manufacture goods for export, thus increasing the host country’s export capacity.
Import-Substituting Investment: They also establish local operations to produce goods that were previously imported, reducing a country’s dependency on foreign goods.
For instance, automobile giants like Hyundai or Suzuki have established plants in India, not only to serve domestic markets but also to export vehicles to other regions. This has reshaped India’s position in the global automotive trade network.
4. Integration of Global Value Chains (GVCs)
One of the most significant contributions of MNCs to global trade is the creation of Global Value Chains (GVCs) — systems where production is fragmented across multiple countries. Each country participates in a specific stage of production based on its comparative advantage.
For example:
Raw materials are sourced from Africa.
Components are manufactured in China.
Assembly happens in Vietnam.
Products are marketed and sold in Europe and North America.
This interconnected production model has increased trade in intermediate goods (parts and components) and services (like logistics and IT support). The rise of GVCs means that the trade between countries today is not just about finished goods but also about value-added processes at each stage of production.
5. Technology Transfer and Innovation Diffusion
MNCs play a vital role in transferring technology and innovation across borders. When a multinational sets up a subsidiary in a developing country, it often brings with it advanced technologies, managerial expertise, and global best practices. This leads to productivity improvements in the host economy and helps integrate it into the global trade system.
For example, when semiconductor companies like Intel or TSMC establish units in emerging markets, they introduce sophisticated manufacturing methods. Over time, local firms adopt these innovations, raising the overall technological capacity and enhancing the country’s trade competitiveness.
6. Shaping Trade Policies and Economic Diplomacy
Due to their economic power, MNCs often influence trade and investment policies in both home and host countries. They lobby for favorable regulations, tariff reductions, and improved trade infrastructure. Their global reach gives them leverage in shaping bilateral and multilateral trade agreements.
For example, major technology firms like Google, Microsoft, and Amazon often advocate for data transfer and digital trade rules that benefit cross-border e-commerce and cloud services. Similarly, manufacturing giants push for lower tariffs and better intellectual property protections to facilitate smooth global operations.
7. Labor and Resource Allocation Across Borders
MNCs influence global labor and resource allocation by situating different functions in regions that offer maximum efficiency. They often:
Establish manufacturing in low-cost labor regions (like Southeast Asia).
Maintain R&D and management centers in high-skill economies (like the U.S. or Germany).
Source raw materials from resource-rich regions (like Africa or Latin America).
This distribution of work leads to economic specialization, where countries develop industries aligned with their strengths. While it fosters global interdependence, it can also create vulnerabilities — for example, over-reliance on certain regions for critical components (as seen during the COVID-19 supply chain crisis).
8. Impact on Emerging and Developing Economies
For developing nations, MNCs can be both a blessing and a challenge.
Positive impacts include:
Job creation and skill development.
Improved infrastructure and export potential.
Access to global markets and technologies.
However, challenges arise when MNCs dominate local markets, repatriate profits instead of reinvesting locally, or exploit labor and natural resources. Policymakers in developing countries must therefore balance attracting foreign investment with protecting domestic economic interests.
9. MNCs and Trade in Services
Traditionally, international trade was dominated by goods. Today, MNCs have expanded trade in services, including finance, telecommunications, logistics, and IT. For example, companies like Accenture, Infosys, and Amazon Web Services operate globally, exporting knowledge-based and digital services that are less constrained by geography.
This shift from goods to services trade has diversified global commerce and allowed developing economies with strong human capital to integrate into the global economy more effectively.
10. Environmental and Ethical Dimensions
Global trade expansion through MNCs has also raised environmental and ethical concerns. Large-scale production across multiple countries often leads to resource depletion, pollution, and carbon emissions. Additionally, differences in labor laws between nations can lead to exploitation.
In response, many MNCs have adopted sustainability frameworks and ESG (Environmental, Social, and Governance) principles. For example, companies like Unilever and Tesla have integrated eco-friendly practices into their global supply chains. Consumers and investors now reward corporations that demonstrate responsible global trade behavior.
11. The Future of MNCs in Global Trade
The next phase of MNC-driven trade will be shaped by digital transformation, geopolitical shifts, and supply chain resilience.
Digitalization will enable even small businesses to join global markets through e-commerce and AI-driven logistics.
Geopolitical tensions (like U.S.-China decoupling) may lead MNCs to diversify their supply chains to new regions such as India, Vietnam, or Mexico.
Sustainability pressures will push MNCs to adopt greener trade practices.
MNCs that adapt to these trends will continue to dominate international trade, while countries that align their policies with these shifts will benefit the most.
Conclusion
Multinational corporations are not just participants in global trade — they are architects of it. Their global operations integrate economies, influence policy, and determine the direction of international commerce. From creating global value chains to driving technological progress, MNCs have fundamentally reshaped how the world trades.
However, their influence also comes with responsibilities — to ensure fair competition, ethical labor practices, and sustainable development. As globalization evolves, MNCs will remain central to the world economy, continuously redefining global trade patterns in an increasingly interconnected world. Education 
Types of Trading in the World Market1. Equity Trading (Stock Market Trading)
Overview
Equity trading refers to buying and selling shares of publicly listed companies. It’s one of the oldest and most popular forms of trading, conducted through stock exchanges like the New York Stock Exchange (NYSE), NASDAQ, London Stock Exchange (LSE), Tokyo Stock Exchange (TSE), and National Stock Exchange (NSE) in India.
Types of Equity Trading
Intraday Trading:
Traders buy and sell shares within the same trading day, aiming to profit from short-term price movements. Positions are squared off before market close.
Swing Trading:
Traders hold stocks for a few days or weeks, capitalizing on short- to medium-term price swings based on technical indicators and market structure.
Positional Trading:
This involves holding positions for several months based on long-term trends, earnings growth, or macroeconomic shifts.
Algorithmic & Quantitative Trading:
Computer-driven strategies execute trades based on mathematical models, speed, and efficiency, minimizing human error.
Why It Matters
Equity trading reflects the health of corporate and economic growth. It helps companies raise capital, offers liquidity to investors, and provides traders with opportunities for profit through price fluctuations.
2. Derivatives Trading
Overview
Derivatives are financial contracts whose value is derived from an underlying asset, such as stocks, commodities, interest rates, currencies, or indices. Common derivative instruments include futures, options, swaps, and forwards.
Main Types of Derivative Trading
Futures Trading:
Futures are standardized contracts to buy or sell an asset at a predetermined price on a future date. They are widely used for speculation and hedging — e.g., crude oil futures or Nifty futures.
Options Trading:
Options give traders the right but not the obligation to buy (call) or sell (put) an asset. This flexibility attracts both hedgers and speculators who seek leveraged exposure with limited risk.
Swaps and Forwards:
Forwards are over-the-counter (OTC) contracts with customizable terms.
Swaps involve exchanging cash flows, such as interest rate swaps or currency swaps.
Why It Matters
Derivatives are vital for risk management and price discovery. For instance, airlines hedge against rising fuel costs using crude oil futures, while exporters hedge currency risks via forex options.
3. Commodity Trading
Overview
Commodities are tangible goods like gold, silver, crude oil, natural gas, wheat, or coffee. Commodity trading dates back centuries and today takes place on organized exchanges like the Chicago Mercantile Exchange (CME), London Metal Exchange (LME), and Multi Commodity Exchange (MCX) in India.
Types of Commodity Trading
Hard Commodities:
These include natural resources extracted from the earth — metals (gold, silver, copper) and energy (crude oil, gas, coal).
Soft Commodities:
Agricultural products such as wheat, coffee, sugar, cotton, and soybeans fall under this category.
Spot vs. Futures Market
In the spot market, commodities are traded for immediate delivery.
In the futures market, contracts are traded for future delivery at a pre-agreed price.
Why It Matters
Commodity markets serve as a barometer for global economic health. Prices of oil, gold, and agricultural goods affect inflation, currency values, and even geopolitical stability.
4. Foreign Exchange (Forex) Trading
Overview
The foreign exchange market (Forex or FX) is the world’s largest and most liquid financial market, with daily trading volumes exceeding $7 trillion. It involves trading currency pairs such as EUR/USD, USD/JPY, GBP/INR, and USD/INR.
Types of Forex Trading
Spot Forex:
Currencies are exchanged instantly at the current market rate.
Forward Forex:
Agreements to buy/sell a currency at a future date at a fixed rate.
Currency Futures and Options:
Exchange-traded derivatives based on currency pairs.
Carry Trade:
Traders borrow in low-interest-rate currencies (e.g., JPY) and invest in higher-yielding currencies (e.g., AUD), profiting from the interest rate differential.
Why It Matters
Forex trading impacts global trade, tourism, and investment flows. Central banks, corporations, and investors use it to hedge currency exposure and speculate on macroeconomic trends.
5. Fixed Income (Bond) Trading
Overview
Bond trading involves buying and selling debt securities issued by governments, corporations, or financial institutions. Bonds provide fixed interest income and are considered relatively stable compared to equities.
Types of Bonds Traded
Government Bonds (Sovereign Debt): Issued by national governments (e.g., U.S. Treasuries, Indian G-Secs).
Corporate Bonds: Issued by companies to raise capital.
Municipal Bonds: Issued by local bodies for infrastructure projects.
Bond Market Trading Styles
Primary Market: New bonds are issued and sold directly to investors.
Secondary Market: Existing bonds are traded among investors.
Why It Matters
Bond trading plays a crucial role in interest rate transmission, fiscal policy management, and capital market stability. Institutional investors often rely on bonds for predictable income and risk diversification.
6. Cryptocurrency Trading
Overview
A modern addition to global markets, cryptocurrency trading involves digital assets like Bitcoin (BTC), Ethereum (ETH), and Solana (SOL). These assets trade on decentralized exchanges (DEXs) and centralized platforms (like Binance, Coinbase, or WazirX).
Forms of Crypto Trading
Spot Trading:
Direct buying/selling of cryptocurrencies for immediate settlement.
Margin Trading:
Borrowed funds are used to trade larger positions, amplifying potential gains (and losses).
Futures & Options on Crypto:
Derivative products for hedging or speculation based on future prices of digital assets.
DeFi & Staking:
Traders earn yields by locking assets in decentralized finance protocols.
Why It Matters
Crypto trading represents a new frontier of global finance — decentralized, transparent, and accessible 24/7. Despite volatility, it’s reshaping how traders and institutions view digital value and monetary systems.
7. Exchange-Traded Fund (ETF) Trading
Overview
ETFs are investment funds that track indices, commodities, or sectors and are traded like stocks. Examples include S&P 500 ETFs, Gold ETFs, and sectoral ETFs (like technology or healthcare).
Types of ETF Trading
Index ETFs: Track market indices such as NASDAQ-100 or Nifty 50.
Commodity ETFs: Represent commodities like gold or oil.
Bond ETFs: Mirror fixed income portfolios.
Thematic/Leveraged ETFs: Focus on emerging themes like AI, clean energy, or innovation.
Why It Matters
ETFs combine diversification and liquidity, enabling traders to gain exposure to broad markets or specific themes with minimal effort and cost.
8. Index Trading
Overview
Instead of trading individual stocks, traders can trade indices that represent a group of stocks, such as S&P 500, Dow Jones, FTSE 100, Nikkei 225, or Nifty 50.
Forms of Index Trading
Index Futures: Contracts based on the future value of an index.
Index Options: Options to speculate or hedge based on index movements.
CFDs (Contracts for Difference): Instruments to speculate on index price changes without owning underlying stocks.
Why It Matters
Index trading reflects the broader market trend and is a key tool for institutional investors managing portfolios or hedging systemic risk.
9. Real Estate Investment Trust (REIT) Trading
Overview
REITs are companies that own and operate income-generating real estate — such as office buildings, malls, or warehouses. They are listed and traded like stocks.
Types of REITs
Equity REITs: Own properties and generate rental income.
Mortgage REITs: Invest in real estate debt and earn interest income.
Hybrid REITs: Combine both models.
Why It Matters
REIT trading provides investors access to the real estate market with liquidity and lower capital requirements compared to buying property directly.
10. Environmental and Carbon Credit Trading
Overview
A relatively new type of market, carbon trading involves the buying and selling of carbon credits, which represent the right to emit a certain amount of carbon dioxide.
How It Works
Companies with excess carbon allowances sell them to those exceeding emission limits. Platforms like the EU Emissions Trading System (EU ETS) facilitate this trade.
Why It Matters
Carbon trading incentivizes sustainability and helps nations meet global climate goals, linking environmental policy with financial markets.
11. Proprietary and Institutional Trading
Overview
Beyond retail participation, large financial institutions and hedge funds engage in proprietary trading (prop trading) — using their own capital to generate profits — and institutional trading, which involves massive volumes handled by fund managers.
Key Strategies
Arbitrage: Exploiting price differences across markets.
High-Frequency Trading (HFT): Leveraging algorithms for microsecond trade execution.
Market Making: Providing liquidity by quoting buy/sell prices.
Why It Matters
Institutional trading ensures liquidity and efficiency, while prop trading adds depth and innovation to global markets.
12. Over-the-Counter (OTC) Trading
Overview
OTC trading occurs directly between two parties, outside of formal exchanges. It’s common in currencies, bonds, derivatives, and unlisted equities.
Why It Matters
OTC markets offer flexibility and customization but carry higher counterparty risk due to the lack of centralized regulation.
Conclusion: The Interconnected Trading Ecosystem
The global trading landscape is a dynamic network where every segment — from equities to crypto — contributes to market efficiency and liquidity.
Equity and ETF trading attract retail and institutional investors.
Derivatives and Forex markets manage global risks and currency exposures.
Commodity and carbon trading influence inflation and sustainability.
Crypto and DeFi trading symbolize the digital transformation of finance.
Ultimately, the types of trading in the world market form an integrated system that channels capital, manages risk, and reflects economic sentiment worldwide.
The future of trading lies in data-driven strategies, AI automation, cross-border integration, and sustainable finance, all of which will redefine how participants interact in this ever-evolving global marketplace. Education 
Long 
876.SZ | Long Setup | Oversold Agricultural Producer | Oct, 2025📌 000876.SZ | Long Setup | Oversold Agricultural Producer Near Structural Support | Oct 27, 2025
🔹 Thesis Summary
New Hope Liuhe (000876.SZ) is showing signs of structural stabilization after a prolonged downtrend within a multi-year accumulation zone. With value metrics at historically low levels and upcoming Q3 earnings as a near-term volatility catalyst, the setup favors a mean-reversion play into 2026.
🔹 Trade Setup
Bias: Long
Entry Zone: ¥8.55 – ¥9.80 (Value Area Low + limit order block)
Stop Loss: Below ¥6.80 (invalidates structural support)
Take-Profits:
TP1: ¥11.60 (first channel retest)
TP2: ¥14.70 (volume node resistance)
TP3: ¥18.10 (mid-cycle target)
Max Target: ¥28.50 (golden-fib projection, 2029–2030 horizon)
🔹 Narrative & Context
The chart structure reveals a long-term rising channel since 2011, punctuated by a 650% rally (2018–2020) followed by a 70% correction and multi-year base formation. Current price sits at the lower channel boundary, overlapping with the 2018 liquidation low, a zone historically associated with institutional accumulation.
Volume profile shows a dense node near ¥9, confirming ongoing absorption. The “Value Area Low” around ¥8.5 – ¥9 is where limit orders cluster, indicating professional interest at discounted valuations.
The upcoming Q3 2025 earnings (in 4 days) will be pivotal:
EPS est. = ¥0.04, Revenue est. = ¥27.1 B.
Even a mild beat could re-anchor sentiment given low expectations and sector normalization.
🔹 Valuation & Context
P/E = 17.8x vs sector ≈ 15x → modest premium justified by strong cash flow recovery.
P/CF = 4.15x → efficient cash generation, implying the market undervalues operational liquidity.
P/S = 0.42x → deep discount to revenue, often seen near cyclical troughs.
Tangible Book Value / Share = ¥5.16 → price trades near 1.9× book, historically a reversal zone.
- Quality metrics remain supportive:
- ROE ≈ 6–7% on depressed earnings, expected to improve with feed and livestock margin normalization.
- Debt/Equity < 1, maintaining balance-sheet flexibility for reinvestment or buybacks.
Plainly put, the stock is cheap on sales, fair on earnings, and rich in optionality if macro tailwinds lift agri-commodity margins into 2026.
🔹 Contrarian Angle (Your Edge)
While consensus models price limited upside (~¥13–¥15), the combination of structural base, sector rotation back to staples, and valuation compression supports a path to ¥18–¥28 by 2030. Market fatigue and workforce reductions (-18% YoY) hint at late-cycle capitulation rather than secular decline.
🔹 Risks
- Margin pressure from global feed-cost volatility
- Policy shifts in China’s pork-supply stabilization
- Execution risk amid cost-reduction cycle and labor downsizing
🔹 Macro Considerations
Agri-commodities are stabilizing post-volatility, while CNY and DXY correlations suggest risk assets in China could rebound with easing conditions. Beta (1Y) = 0.98 implies moderate sensitivity to broader market flows.
🔹 Bottom Line
New Hope Liuhe offers an asymmetric long setup near structural support with improving fundamentals and defined risk. Despite modest yield (0.25%) and subdued EPS growth, balance-sheet resilience and potential volume recovery justify accumulation within ¥8.5–¥9.8.
For 2026 and beyond, sustained margin recovery could re-rate this name toward historical mid-channel valuations.
Like & Follow for structured ideas, not signals. I post high-conviction setups here before broader narratives play out.
Q & A
Does the fundamental tell us that the stock is dying?
The data suggest New Hope Liuhe is not dying , it’s resetting.
The company is compressing through a profitability trough typical of agricultural commodity cycles, while maintaining cash flow, solvency, and large-scale operations.
The market has priced it like a stagnant player, but its balance sheet and valuation ratios imply survivability with optional upside if feed prices normalize and consumer demand recovers into 2026.
Do you think fundamentally it will make it?
Short answer: Yes, fundamentally it can make it, provided margins normalize and execution stays disciplined. Nothing in the data screams “terminal decline.
Would you invest in it right now?
Short answer: yes, but only as a sized starter with defined risk given earnings in 4 days.
⚠️ Disclaimer: This is not financial advice. Always conduct your own research. Charts and visuals may include AI enhancements.
🔹 Footnote
Forward P/E: Price ÷ expected earnings over next 12 months. Lower = cheaper relative to profits.
P/FCF (Price-to-Free-Cash-Flow): Price vs. cash left after investments. Measures efficiency.
FCF Yield: Free cash flow per share ÷ price per share. Higher = more cash for each dollar invested.
ROE (Return on Equity): Net income ÷ shareholder equity. Shows management efficiency.
ROIC (Return on Invested Capital): Net income ÷ (all invested capital). A purer profitability gauge.
Debt/Equity: Debt ÷ equity. <1 = conservative balance sheet.
R:R (Risk-to-Reward): Expected upside vs. downside. 3:1 = risk ¥1 to make ¥3.  Long
Long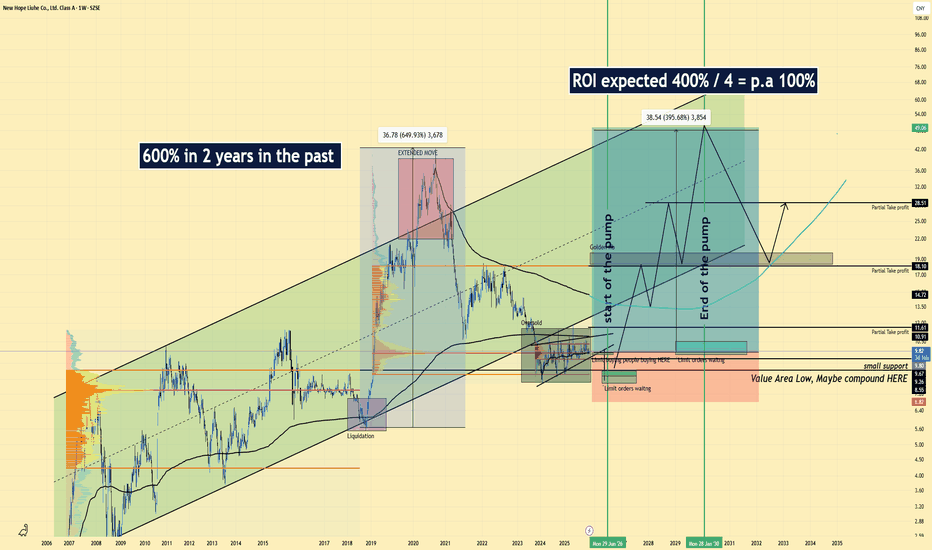
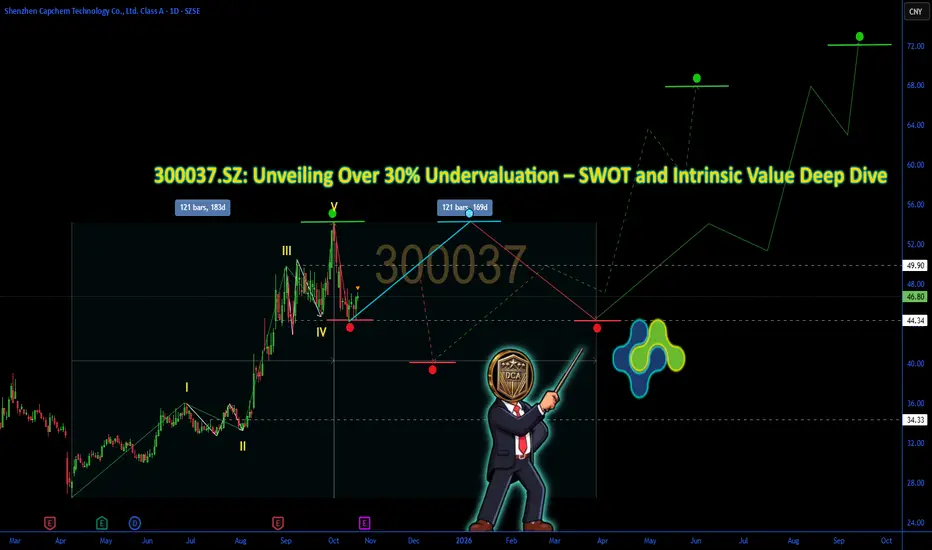
300037.SZ: Unveiling Over 30% Undervaluation 300037.SZ: Unveiling Over 30% Undervaluation – SWOT and Intrinsic Value Deep Dive
Introduction
📊 As of October 24, 2025, Shenzhen Capchem Technology Co., Ltd. (300037.SZ), a key player in electronic chemicals and battery materials, is positioned within a rebounding chemicals sector amid emerging market volatility and global energy shifts.
Macroeconomic factors, such as China's economic stimulus boosting EV adoption and commodity stabilization, are driving renewed interest in battery supply chains. Sector dynamics include rising demand for lithium-ion electrolytes, with public data from recent filings showing quarterly revenue growth of 8.60% year-over-year, indicating resilience in a dip-driven market. This overview draws from verifiable metrics without endorsing any trading action.
SWOT Analysis
Strengths 💹
Shenzhen Capchem exhibits solid financial fundamentals, with EBITDA at 1.6B CNY and a profit margin of 11.87%, reflecting efficient operations in high-demand segments like battery electrolytes. The company's low debt-to-equity ratio of 26.22% supports stability, while revenue per share of 11.39 CNY underscores diversified product lines in functional materials. Quarterly earnings growth of 1.30% highlights consistent performance amid sector challenges.
Weaknesses ⚠️
Elevated valuation metrics, such as a trailing P/E ratio of 39.84, may indicate sensitivity to market fluctuations and potential margin compression in competitive chemical markets. Return on assets at 4.13% suggests room for improved asset utilization, while levered free cash flow of 152.19M CNY reflects moderate liquidity in expansion phases.
Opportunities 🚀
Undervalued indicators, including a forward P/E of 19.61 and price-to-book of 4.01, position the company for investor interest in EV growth. Analyst forecasts project 25.59% revenue growth to 9.85B CNY in 2025, driven by expanding battery and semiconductor markets, with EPS growth at 20.79%. Further upside from 43.67% EPS growth in 2026 amid global green energy transitions.
Threats 🛑
Regulatory pressures in China's chemical industry, including environmental standards and trade tensions, could impact operations. Competition from global battery material suppliers and commodity price volatility pose risks to margins, while geopolitical factors may affect supply chains.
Intrinsic Value Calculation
💰 Value investing involves estimating intrinsic value to identify assets trading below their fundamental worth, with a margin of safety for uncertainties. We apply: Intrinsic Value = (Book Value per Share × Weight) + (EPS × Growth Multiplier), using a book weight (e.g., 0.5) for asset emphasis and a higher multiplier (e.g., 40) to account for strong growth projections in the sector.
Using recent data: Book Value per Share = 13.33 CNY, Forward EPS = 1.53 CNY. Assume a 25% growth rate from revenue forecasts, justifying the elevated multiplier for sustainability.
Calculation:
- Book component: 13.33 × 0.5 = 6.665
- Earnings component: 1.53 × 40 = 61.2
- Intrinsic Value ≈ 6.665 + 61.2 = 67.865 CNY
Compared to the current price of 46.80 CNY, 300037.SZ appears undervalued by over 30%, providing a solid margin of safety (e.g., 30-50% discount for risks like low debt but market volatility). 📉 Debt flags are minimal at 26% D/E, with robust growth (43.67% EPS in 2026) supporting long-term sustainability if expansion continues. Annotate intrinsic value lines in green on the chart, with current price in red for visual comparison.
Entry Strategy Insights
🔍 Institutional strategies often target bottom-extreme zones, such as oversold levels from historical supports, for unleveraged long-term positions. A dollar-cost averaging approach allows scaling in during dips. For 300037.SZ, observe zones near 52-week lows amid sector rebounds, focusing on fundamentals like revenue momentum over transient volatility.
Risk Management
⚠️ Position sizing should be limited to 1-5% of portfolio to contain risks. Diversify across tech and materials sectors to offset China-specific exposures, with long-term holds tied to growth in EV materials. Track debt and cash flow in quarterly reports, establishing exit points for adverse regulatory or macro changes.
Conclusion
This analysis spotlights Shenzhen Capchem's operational strengths and growth opportunities, tempered by valuation and external risks, with intrinsic calculations indicating meaningful upside for value-oriented approaches. Always verify independently via latest filings and professional guidance.  Long
Long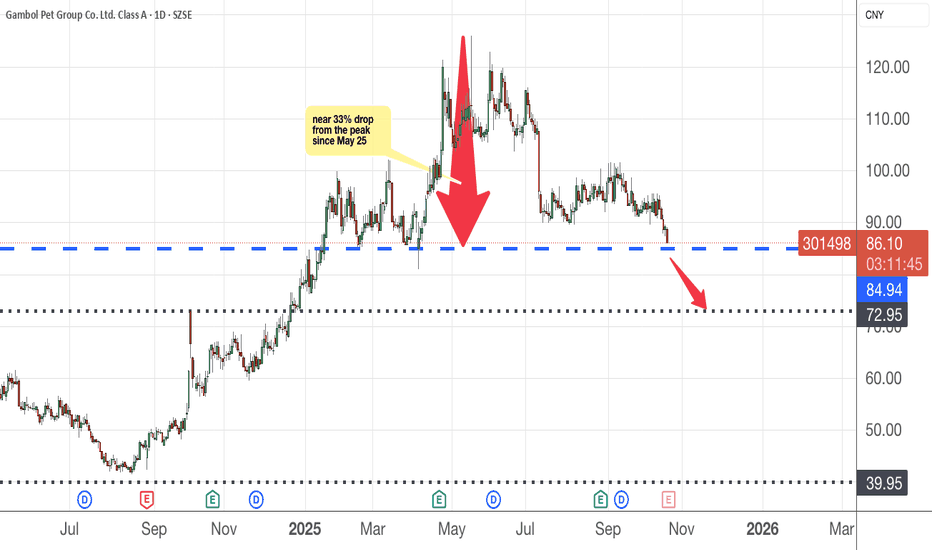
Wish you were a doggie or cat in your next life ? Read this article here , here and here
The things that human can do for their pet dogs and cats are limited to one's imagination. With a higher and higher pet adoption rates, it is a matter of time that pet products and services will go more upscale, luxurious and niche as evidenced in these articles.
I have shared before that this is a global trend of aging society, people are feeling way too stressed to commit to a relationship and if they do, they choose not to have kids. Substitute ? A lovely , adorable pet dog, cat, bunny, etc.
The chart shows a strong support at 52.97 price level and the 2nd bullish bar breaking out of the bearish trend line is definitely more convincing than the first. To me, it is a no brainer type of stock to pick and this trend is going to last for many years to come.
Long/accumulate  Long
Long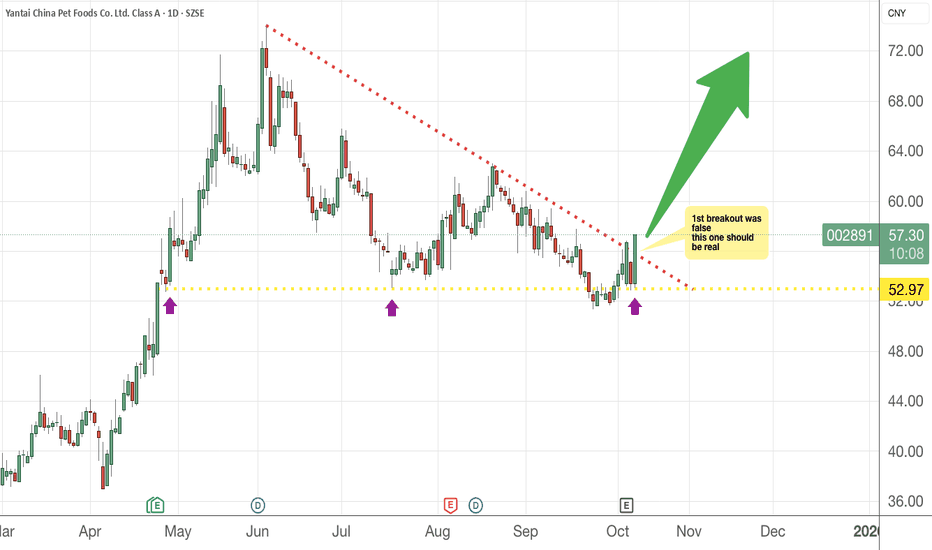
Long 
 Long
Long