Do you have a pet at home ?For as long as I remembered, when I was a kid, we were always catching little chicks from the village and keep as pets. Later, I had tortoise, a white parrot, a myna , some other birds kept by my late dad, angel fish etc. All these cramped in a tiny 1 room flat !
Fast forward 5 decades later, we are seeing a resurgence of furry pets entering into modern human lives more and more. From Korea to China to Jarkarta, we see a growing trend of young couples getting married but not wanting to have kids. Instead, they opt for pets and this can range from furry ones like bunnies, hamsters, guinea pigs, cats and dogs to exotic ones like reptiles and some even keep ants. Times have changed.......
These furry kids are now replacing human kids and I am of the opinion it will proliferate more and more as we witness the emergence of pet friendly cafes, parks for dogs, accessories sold online and in pet shops. The downside we are also seeing is abandonment by some of these paw parents who could not handle the stress of upkeeping these pets .
Before, it was all canned food but now they are going for fresh foods even curated by some chefs. Wouldn't you want to be reincarnated as a cute doggie in your next life ?
I first spotted this company i n late 2024 and nibbled some shares.
Fast forward 6-7 months later, I am so lucky to be blessed with more than 200% returns on my investment. Mind you , this is not even a tech companies with AI patents .........
Read this latest article here and you would be convinced how deep the penetration these pets have on human. Of course, the more they spend , the higher prices these companies will be.
What's next ?  Long
Long
 Long
Long
 Long
Long
China Vanke: Assessing the Investment Potential Company Overview
China Vanke Co., Ltd. ( HKEX: 2202 ) is one of China's largest real estate developers, known for its diversified portfolio spanning residential, commercial, and mixed-use properties. Established in 1984, the company has expanded its presence beyond mainland China, with projects in Hong Kong, Southeast Asia, and even the U.S.
Vanke has built a reputation for sustainable urban development, integrating green building practices and smart city technologies into its projects. Despite macroeconomic headwinds, the company remains a key player in China's housing market.
Financial Performance and Market Position
China Vanke's financial stability has been tested by the broader real estate crisis in China, exacerbated by regulatory constraints and declining consumer confidence. The company's revenue in 2023 stood at approximately CNY 450 billion ($63 billion), marking a slight decline from previous years as property sales slowed. However, its debt-to-equity ratio remains one of the lowest among major developers, making it relatively resilient in a highly leveraged sector.
Key financial highlights:
• Total Assets: CNY 1.75 trillion (~$245 billion)
• Net Profit (2023): CNY 17 billion (~$2.4 billion)
• Debt-to-Equity Ratio: 1.1 (compared to industry average of 2.5)
• Liquidity: Strong cash reserves (~CNY 150 billion)
While many competitors, including Evergrande ( HK:3333 ), have struggled with debt repayment, China Vanke has maintained a more conservative approach to leverage, avoiding the severe liquidity crises that have plagued other developers.
China’s Real Estate Market: Risks and Opportunities
The Chinese government’s efforts to stabilize the real estate sector have had mixed results. While stimulus measures, such as reduced mortgage rates and relaxed home-buying restrictions, have provided some relief, consumer sentiment remains weak. Additionally, population decline and urbanization trends are shifting, altering demand dynamics for new developments.
However, China Vanke's diverse portfolio and focus on high-demand metropolitan areas may help mitigate risks. The company's expansion into rental housing, commercial properties, and urban redevelopment projects also provides alternative revenue streams beyond traditional home sales.
Stock Performance and Valuation
China Vanke's Hong Kong-listed shares have declined by approximately 40% over the past two years, reflecting broader concerns about the real estate market. However, its current price-to-earnings (P/E) ratio of 6.8 suggests the stock may be undervalued compared to global peers.
Valuation metrics:
• Current Share Price: HKD 9.50 ($1.21)
• P/E Ratio: 6.8 (historical average: 10-12)
• Dividend Yield: 4.2%
Given its strong balance sheet and diversified business model, some investors may see China Vanke as a long-term recovery play rather than a short-term speculative investment.
Conclusion: Investment Outlook
China Vanke stands out as a relatively stable player in an otherwise volatile real estate sector. While risks remain due to the broader economic slowdown and policy uncertainties, the company’s strong liquidity, diversified revenue streams, and strategic focus on urban redevelopment position it better than many of its peers.
Investors considering China Vanke should weigh the potential for a long-term market recovery against the ongoing risks in China's housing sector. The company's ability to navigate regulatory changes and sustain profitability will be crucial for its future performance. China’s Financial Power Play: CICC and Galaxy Sec. Set to MergeChina’s Financial Power Play: CICC and Galaxy Securities Set to Merge into a $193B Giant ✨💼
By: @DCAChampion
| Date: February 26, 2025
Introduction
China’s financial sector is buzzing with blockbuster news: state-owned China International Capital Corp (CICC) and China Galaxy Securities are poised to merge, creating the nation’s third-largest brokerage with a staggering $193 billion (1.4 trillion yuan) in assets. Announced on February 26, 2025, this deal signals Beijing’s bold strategy to forge domestic financial titans ready to compete with global heavyweights like Goldman Sachs and Morgan Stanley. Is this the start of a new era for China’s securities industry? Let’s break it down. 🕵️♂️💰
Trending Sector Performance
🔍 Merger Highlights
Massive Scale: The CICC-Galaxy merger will form a financial powerhouse with $193 billion in assets, vaulting it past Huatai Securities to claim the No. 3 spot behind CITIC Securities and the recently merged Guotai Junan-Haitong Securities.
Market Reaction: Investors are all in—CICC’s Hong Kong shares soared over 8%, while Galaxy Securities jumped more than 10% following the news, reflecting sky-high expectations for this union.
Beijing’s Backing: Five sources confirm Chinese authorities greenlit the merger in recent weeks, with an official announcement potentially just days away. This follows a wave of consolidation, marking the second mega-merger in China’s $1.6 trillion securities industry in months.
This isn’t just a merger—it’s a seismic shift in a crowded market of over 140 brokerages.
Sector Valuation 📊
The combined entity promises to reshape the competitive landscape:
CICC (601995.SS): Known for its investment banking prowess, CICC brings expertise in IPOs and high-stakes deals to the table.
Galaxy Securities (601881.SS): A leader in retail brokerage, Galaxy adds a robust client base and operational scale.
Together, they’ll command $193 billion in assets, positioning them as a formidable player. While specific P/E ratios aren’t detailed in recent reports, the market’s enthusiastic response suggests investors see undervalued potential in this blockbuster pairing.
Risk Assessment ⚠️
Every big move comes with risks:
Regulatory Hurdles: The deal awaits approval from regulators and shareholders, a process that could hit snags despite government support.
Market Volatility: A consolidating sector faces fierce competition from global firms like Goldman Sachs, which are expanding their China footprint.
Integration Challenges: Merging CICC’s investment banking focus with Galaxy’s retail strengths could spark operational growing pains.
Strategic Sector Analysis 🛠️
SWOT Analysis
Strengths:
✅ Complementary strengths: CICC’s deal-making savvy + Galaxy’s retail dominance.
✅ Beijing’s push for world-class financial firms gives this merger strategic clout.
Weaknesses:
❌ Integration risks could slow momentum.
Opportunities:
💡 A stronger foothold in wealth management and capital markets.
💡 A chance to rival global giants on the international stage.
Threats:
🚨 Regulatory delays or shareholder pushback.
🚨 Intensifying competition from Wall Street’s China expansions.
Key Trends Shaping the Sector:
Consolidation Wave: Beijing’s directive to merge and restructure brokerages is gaining steam, aiming for 2-3 global banks by 2035.
Global Competition: As foreign firms deepen their roots in China, domestic players are bulking up to stay ahead.
Accuracy and Data Validity ✅
All insights here are drawn from the latest reports on February 26, 2025, including Reuters and X posts, ensuring this reflects the freshest developments as of 11:58 AM CET.
Conclusion 🏁
The CICC-Galaxy merger is a game-changer for China’s financial sector. With $193 billion in assets and Beijing’s blessing, this new giant could redefine the industry’s future—domestically and globally. But success hinges on navigating regulatory waters and blending two distinct powerhouses. Is this the golden ticket for China’s financial ambitions? Time will tell.
Poll Time! 📊
What’s your take on this merger?
🔺 Bullish: It’s a masterstroke for China’s markets!
➡️ Neutral: Let’s see how it plays out.
🔻 Bearish: Too many risks to shine.
Vote and share your thoughts below!
 Long
Long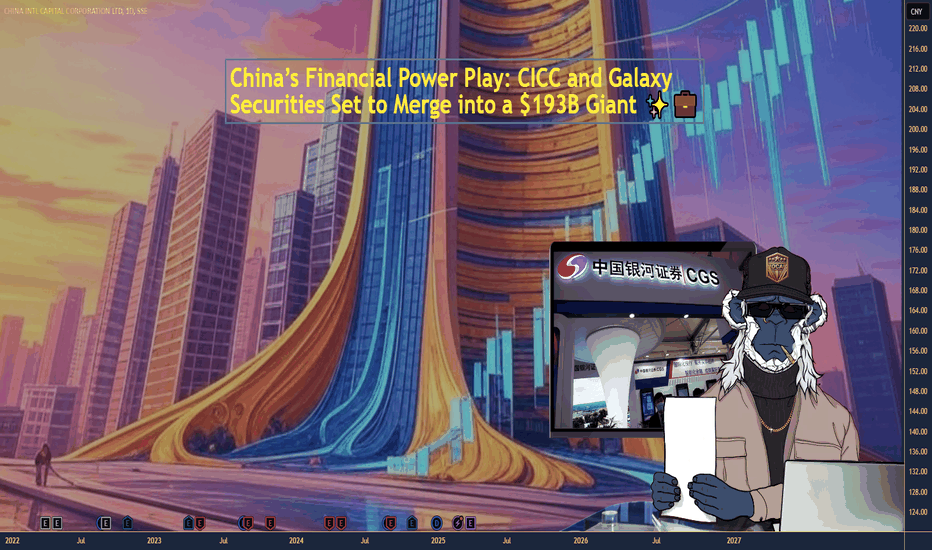
Long 
 Long
Long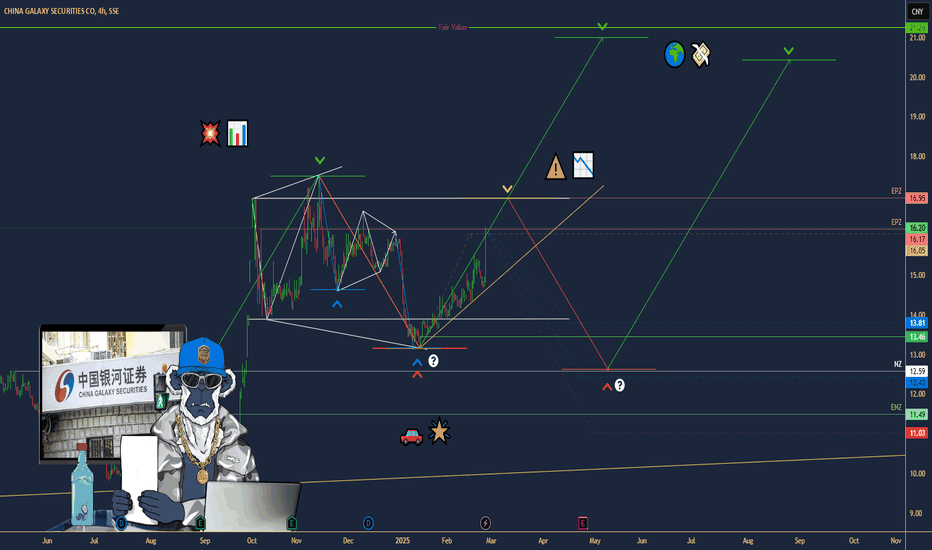
 Long
Long
Upward potentialThe stock may rise to prescribed levels.
C&D Holsin Engineering Consulting Co., Ltd. specializes in integrated engineering consultancy services, focusing on:
Roads
Bridges
Tunnels
Municipal housing construction
Water transport projects
The company offers services such as design, project management, testing, construction, comprehensive management & maintenance, and engineering materials. Founded on October 11, 1995, it is headquartered in Xiamen, China.  Long
Long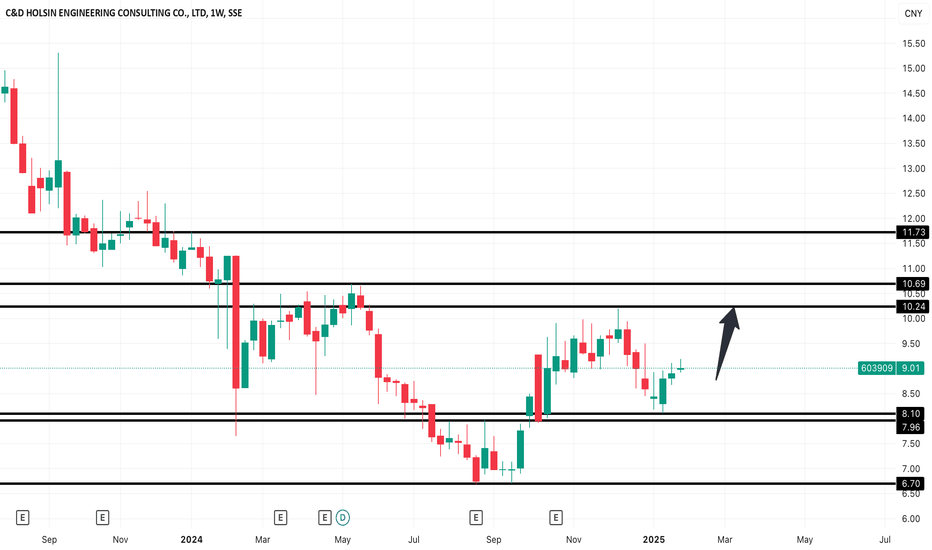
Long 
 Long
Long
Potential Bullish Rally Amid China’s Market ReboundAs the Chinese stock market shows signs of a bullish outlook, Seik Motor Corporation Limited (600104) appears well-positioned for a significant upward movement. This analysis is based on the belief that the market is either experiencing or will soon enter a period of sustained growth, potentially benefiting undervalued stocks like Seik Motor.
From a technical perspective, Seik Motor reached a notable low around the 11.49 CNY level before rallying to approximately 16 CNY. This initial surge is identified as the completion of wave one in an Elliott Wave sequence. Following this, the subsequent decline to around 12.5 CNY represents a corrective wave two. Currently, we anticipate that the stock is preparing for wave three, which often tends to be the most extended and powerful wave in such sequences.
If wave three unfolds as expected, Seik Motor could potentially reach a target level of 20 CNY, with a high probability of even surpassing its prior all-time high around the 37 CNY mark. However, the key invalidation level for this bullish outlook remains at 11.49 CNY. Should the stock drop below this threshold, it would indicate a shift in market sentiment, nullifying the bullish scenario.
Given these technical indicators, Seik Motor Corporation Limited presents an intriguing opportunity for investors seeking exposure to the anticipated strength in the Chinese market. Bullish Breakout Expected Amid Wave 3 Rally PotentialAt Vital Direction, we’re closely monitoring Chongqing Zhifei Biological Products Co., Ltd (ticker: 300122) as we believe it’s poised for a significant upward movement, reflecting our bullish outlook on the broader Chinese stock market. With our technical analysis framework, we interpret this stock as highly undervalued and positioned for potential growth, in line with the index’s bullish trajectory. Currently trading around ¥28, we project that it could ascend to ¥50 or even test new all-time highs, driven by strong technical indicators.
Diving deeper into the wave structure, our analysis indicates that the low around ¥20.38 served as a foundational bottom, marking the beginning of an impulsive pattern. From this level, the sharp increase to approximately ¥40 represents what we interpret as wave 1, while the subsequent correction down to ¥27 aligns with a wave 2. This sets up the present move as the start of wave 3, which we expect to extend much higher in the coming months.
It’s important to note that if the price were to drop back down to the ¥20.38 level, this would invalidate our current bullish scenario. However, as long as this level remains intact, our outlook remains strongly positive. For those following the Chinese market’s developments, this stock could present an opportunity as the market rallies.  Long
Long
Long 
 Long
Long
 Long
Long
Long 
Long 
 Long
Long
Long