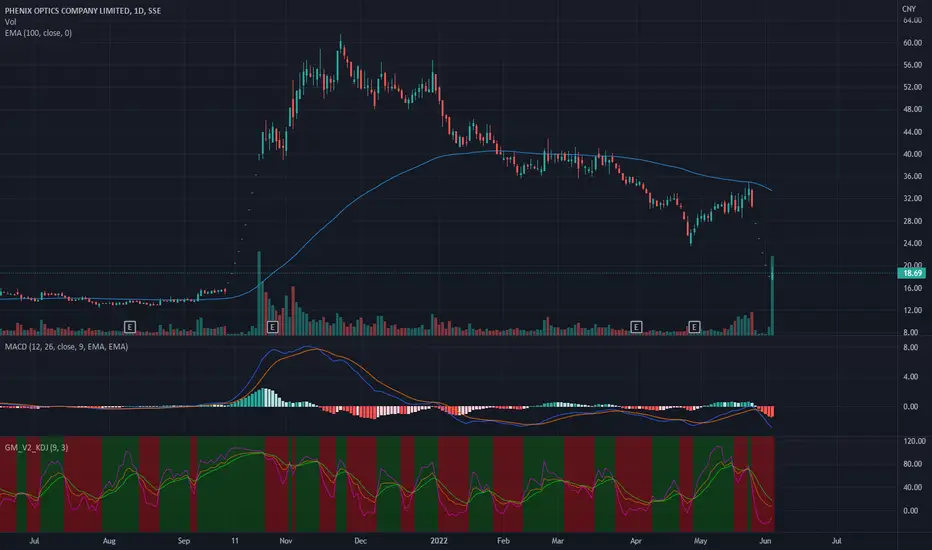
Has the China property sector bottom out ?If the price action in the chart reflects correctly, then this could be the bottom for the China property sector. The peak happened a year ago in March 2021 where the price was highest at 34.56.
The past weeks candles tell me there is a tug of war between the buyers and sellers. $22 seems to be a pretty strong resistance so we need to break above that for a convincing recovery bull rally for the property sector.
this stock is in a critical levelhello investors
Wow the beauty of halves of trends is clear and fascinating here in this chart.
I explain: we are in 50% of the big uptrend correction and also in the 50% of the last downtrend corection so if the elipse zone are broken you should ride the trend up or down.
Remember please that I am not using cristal ball predicting markets' future but I try to be more effecient and more rationnal
Do not hesitate if you want some explanation and more analysis of other markets, just ask me and i
an other up channel will accurehello, this stock has a big oppotuinity to grow up more and more,
why?
As you see it tried to break out its channel several times by keeping its uptrend. so if you see it breaks up that up corridor stay at your buying position and blow up your earns.
targets are showen on my chart
NB: i don't have a cristal ball predicting markest' future but i try to be more efficientr and rationnal in my trading.
Good luck and let some feedbacks if you want more markets analysis (you can ask me other markets
Forecast № 19 # 600519 (KWEICHOW MOUTAI CO., LTD)When crossing the price level 1, I consider the following options for the price movement up, differing in the depth of the corrective price movement down. Detailed trading information (forecasts for all assets, entry points to the position, opening time, STOP LOSS) is available by subscription @TradePrBot.
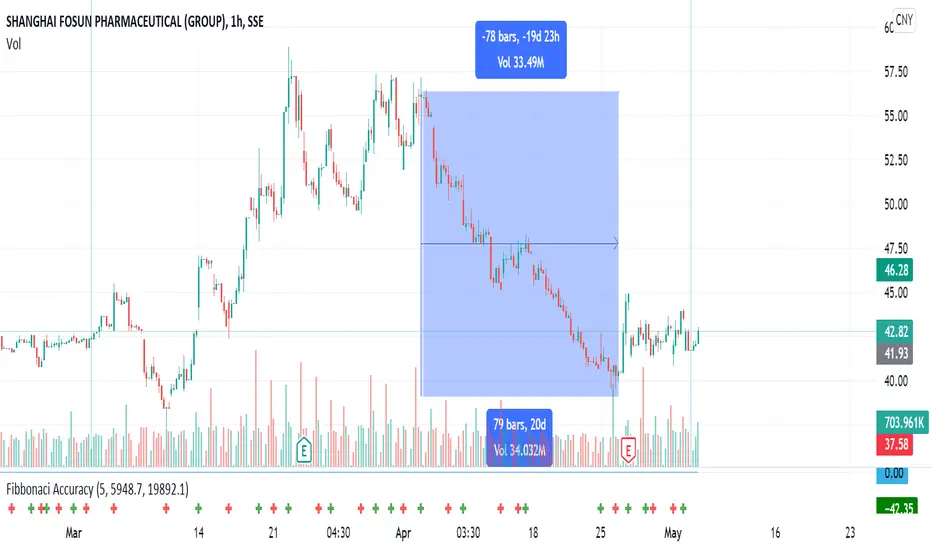
Fibonacchi SSSFibonacci retracement with recent high and lows
The percentage retracements identify possible support or resistance areas, 23.6%, 38.2%, 50%, 61.8%, 100%. Applying these percentages to the difference between the high and low price for the period selected creates a set of price objectives.
Depending on the direction of the market, up or down, prices will often retrace a significant portion of the previous trend before resuming the move in the original direction.
These countertrend moves tend to
How to read the message side? ——My road as a financial analystEvery day, there are many fake articles that spread different positions, both true and exaggerated. In order to judge valuable information from them, we need to have certain critical thinking. Then I will share three dimensions for your reference.
In the period when Kweichow Moutai was heavily bearish by market opinion, I saw an article talking about the risks of Kweichow Moutai, and many views in the article could not withstand scrutiny. Examples are as follows:
(1) Confusion of concepts. T
HOW-TO use three turnover musketeers #1 : L5 HSL TrendThe market decides how much profit to give you, and you can decide how much to lose! ---- Linda Bradford Risk
Recently, I have concentrated on the time to summarize and optimize the three tools for turnover: turnover trend, turnover oscillator, and turnover supply and demand; as explained in advance, these three indicators are only suitable for stocks in the A-share market. In TradingView Errors may be reported for other targets. It is planned to introduce their usage in three articles. For th
UPDATE Industrial and commercial bank of china limited reDaily frame
The intersection of the uptrend and downtrend, with the availability of a sell signal on the volume indicator, in addition to the formation of the butterfly pattern on the chart. All these indicators give us a prediction that the market will correct upwards , which gives us an opportunity to buy and get profits.
Industrial and commercial bank of china limited recommendationDaily frame
The intersection of the uptrend and downtrend, with the availability of a sell signal on the volume indicator, in addition to the formation of the butterfly pattern on the chart. All these indicators give us a prediction that the market will correct upwards , which gives us an opportunity to buy and get profits.