China Stock - 688167 - Bull run may end by the middle of Dec688167 has experienced a bull run in Nov. According to the time cycle and Aroon indicator, the bullish window may close soon, before the middle of Dec.
Today the RSI climbs back above the MAs, unveiling a short-term window.
Opened a position at 123.8.
China Stock - 002993 - Pivotal MomentIt is currently at a pivotal moment where RSI walks under MAs in CBIndex. Other indicators such as Aroon and Derivative Oscillator also indicate bearish movement.
The time cycle suggests a potential end at this moment of the current fall. The next fall will happen around the beginning of Jan, which may lead to a bullish opportunity this month.
We'll see.
China Stock - Pivotal Moment of 002993The symbol seems to be in a pivotal moment, where the price level was steadily climbing while the DO indicated a down-term trend.
A possible ending may be reached by the end of November.
For an uptrend opportunity, wait to see if the RSI line can pivot upside and cross the two MAs in CBIdex.
One Month Up Trend of 300809Picked by my open source algo at github.com .
RSI and CB Idx indicate a potential uptrend if successfully crossing upwards to the moving average. DO_LB indicates a potential end of the current downtrend period.
Time cycles indicate that there may be a low point by the end of December, therefore the end of this short-term uptrend will possibly end by the end of November.
Bottomed?Nǐmen hǎo
We have nice Elliott wave formation ready for trend reversal!
Sure, price always can go deeper but opportunity in this moment for trend reversal is more than good.
Above previous low level is free zone to the upside.
Confirmation can be after breaking and beck test!
Good luck traders
3 possible scenarios!Nǐmen hǎo!
Red, green or blue scenario?
All the 3 scenarios have high probability in this moment, I stay independent in this case.
The green scenario is triangle scenario ABCDE when the decline start line is usually come from wave E.
Blue and red scenario are ABC one to 100% extension and other one to 161.8% extension!
Good luck traders
Half-a-month Uptrend of 688667Picked by my open source algo at github.com .
RSI and CB Idx indicate a potential uptrend if successfully crossing upwards to the moving average, while the already overbought RSI position should not be ignored.
DO_LB indicates a potential end of the current downtrend period.
Time cycles indicate that there may be a low point by the end of November, therefore the end of this short-term uptrend will possibly end before the first half of November.
Half-a-month Uptrend of 300969Picked by my open source algo at github.com .
RSI and CB Idx indicate a potential uptrend if successfully crossing upwards to the moving average. DO_LB indicates a potential end of the current downtrend period.
Time cycles indicate that there may be a low point by the end of November, therefore the end of this short-term uptrend will possibly end before the first half of November.
How-to use L3 Six-color Divine DragonNOTE: this indicator is optimized for stocks which include financial data, for forex and crypto, it may not work as well as stocks.
**L3 Six-color Divine Dragon** Indicator consists of red profit holders, yellow floating chips, and green trapped holders, along with their 10-day moving averages, totaling six colors, hence the name Six Color Dragon. The dynamic chips reflect the trading and movement of the main chips within a certain range. Purple represents the stock price entering the oversold
0
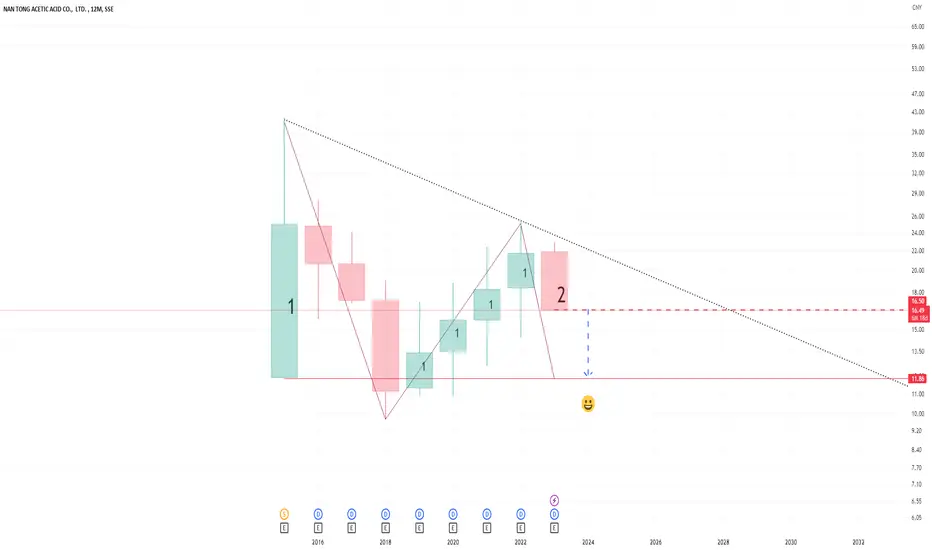
acetiv acidthe 1st Big Father Candle was followed by 3 consecutive corrective candles.
the next move up was completed by 4 small candles that were corrective by nature (because of their small bodies with long bipolar tails) but this slow move did not even go 50% of the first big candle.
the last corrective candle can go straight down in one push to the bottom line from where the first Big Father Candle rose.
this can complete the law of Alternation.