 ShortShort
[Analysis] Keppel Corp (BN4)(SG)While many will be elated on what seems like a "Trend Breakout", it is still early to tell.
Newton law of motion
"An object in motion will remain in motion in the same direction" holds true for stocks as well. A stock in a downtrend will most likely stay in a downtrend.
Even if the breakout is legit, we have a nearby resistance at 6.00. Given that the current price is already at 5.600, there is not much room upwards before supplies start to pour in again.
If the price is unable to break 5.70, a possible lower high could be created.
One of the sins in Technical Analysis is the trader only draws what he wishes to see and is blind to other possibilities.
Verdict: The Risk is not worth chasing this potential "breakout"


[Analysis] TheHourGlass (AGS)(SG)
Along with Boustead
TheHourGlass is one of the counters recommended mentioned during our weekly webinar in 23May21.
This is yet again another great example of consolidation and supply exhaustion. During an uptrend, the purpose of the consolidation phase is to exhaust the short-term supplies (otherwise known as weak holders). Once the supplies are gone, the price is ready to continue its uptrend.
The only tricky thing is, there is no analysis on earth that can accurately tell when the supplies have been exhausted.
Hence, holding power and a proper stop loss is critical in ensuring you are in the trade when it eventually runs up.
TheHourGlass is bullish for sure and will continue to run. The only question is, can you execute the trade properly?
Scouting for supplies exhaustion and a proper stop loss is the key criteria in Nimbus Capital's strategy.
If you benefit from our analysis and wish to learn more, do visit our websites in our signature!
 Long
Long
[Analysis] ISDN (I07)(SG)Consolidation occurs when there is a presence of sellers in the market. Price will remain sideways until sellers have exhausted, then it will eventually rally up. The exhaustion in supply can be seen in decreasing volume within the same price range.
As a trader, you need to understand that buying within this consolidation means, you will be held for some time. This is because while volume can hint at supply exhaustion, there is no way to 100% confirms such a fact. Hence, the expectation and assumption that price will immediately rally is the common cause of traders failing to catch any form of rally. Impatience and lack of holding power is a major contributing factor to retailers unable to secure profits.
Traders will also need to ensure that after they entered, they are not stopped out while the consolidation is still ongoing. The cause is usually due to improper stop loss.
Sad fact: Many traders are able to "pick" the right counter, but they are unable to execute a profitable trade.
 Long
Long
[Analysis] Sembcorp MarineOnce an O&G giant at $6.00, it's quite heartbreaking to see the company become a penny at 0.150.
This drop is most likely due to the proposed rights issue to improve its gearing to explore the merger with Kepple O&M. Regardless of its overall future outlook, the Rights Issue is never pretty for existing holders. Sembcorp Marine just very recently executed an extremely dilutive rights issue prior to its divorce from Sembcorp Ind. Chances are that many "loyal" holders will most likely be unloading given that they have been "duped" into another rights issue yet again. One can only milk the cow so far.
Who's to say Sembcorp Marine could recover in the next 10 years. It is highly possible. But as a trader, one does not trade into uncertainty when there are many other options available.
It is a common fallacy that if the stock was once very high in the past, it can recover to former days glory. Sadly, the fact it had dropped so low is an indication that such recovery is highly unlikely. Trend, market, and macro have changed since then. That's why the price dropped.
However, the opposite is actually more probable. Stocks that have not seen the high and is on the uptrend are more likely to see the highs because it is working towards that future. Think Propnex, Frencken, iFast.
Yet the idea that if a counter was $6.00 in the past and it's $0.150 now can go back to $6.000, is extremely flawed. SIA will never see $12 in the next 7-8 years. Creative can only dream to go back to $26 in this lifetime.
The most probable way anyone could profit hugely from Sembcorp Marine is if it gets privatize at a reasonable premium after the rights issue (Similar to what happen to tiger air). Even then, this is a long shot, and the majority of the holders will still be at a loss.
Sure, Sembcorp Marine will have a small rebound here and there which will trick inexperienced/emotional traders into going long. That sort of return you could catch from such rebound can be easily caught in another uptrend counters with much lesser risk.
Verdict: Low can go lower. Not worth the risk to catch any form of rebound!


AWX SGX SELL/SHORT to 2.00 (BUY ENTRY) UPDATETICKER CODE: AWX
Company Name: AEM
Industry: Singapore Stocks Industrial Services Engineering & Construction
Position Proposed: BUY
Buy Entry: NOT READY (2.00-2.20)
1st Partial Take Profit: 5.30 Early-Mid 2022)
2nd Partial Take Profit: 7.35(Early 2023)
Stop Loss: 1.90
Technical Analysis
1. Falling Wedge/Pennant Pattern (Potentially Forming)
2. Area of Confluence with Trendline and Horizontal Resistance Level (Key Level)
3. Fibonacci Retracement at 0.786 is at key market structure
4. Fibonacci Expansion Safe Take Profit Level 1 (Grey Zone) Also the length of Flagpole
and also Channel Range (Trendline Resistance)
 Short
Short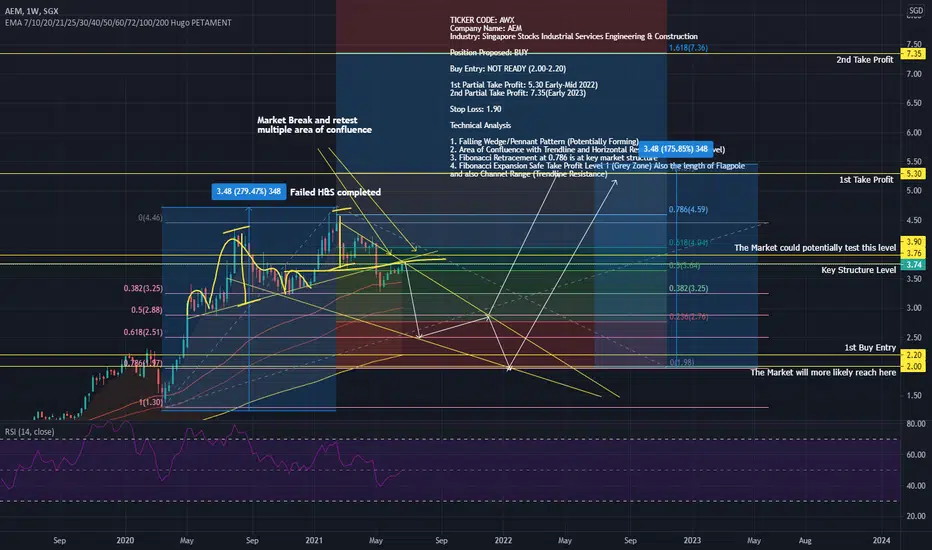 Long
Long
C38U BUY/LONG NOW READY! 2.10 to 2.65 by End AUG/SEPT 2021TICKER CODE: C38U
Company Name: CAPLAND INTCOM T
Industry: FINANCE. REAL ESTATE INVESTMENT TRUSTS
Position Proposed: BUY/LONG (NOW READY!!)
BUY ENTRY: 2.00-2.10
1st Partial Take Profit: 2.65 (AUG 2021-SEPT 2021)
Potential 2nd Take Profit: 3.05 (END of 2021)
Stop Loss: 1.85
Technical Analysis
1. FLAGPOLE + Rising Wedge Occurring, 4 touchpoints established,
POTENTIAL BUY/LONG to mentioned prices by end of SEPT 2021.
2. Inversed H&S forming now, with the completion of the second shoulder,
it might POTENTIALLY push the market to mentioned prices.
3. Fibonacci Expansion indicates a rebound at 0.618 levels,
providing further evidence of a Push-up.
DO BE WARNED IF THE CHART REACHES THE FIRST TAKE PROFIT, IT MAY DO A REVERSAL.
 Long
Long
 Short
Short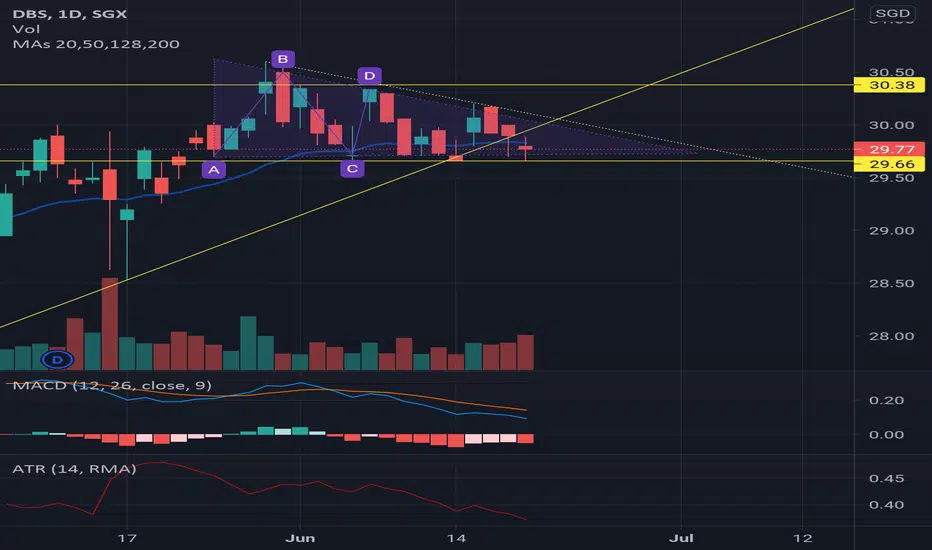
Genting SP Expecting StrengthGenting SP saw strength today breaking out of its downtrend line with its Relative Strength indicator trading above zero, thus outperforming the market. FFI is also showing positive fund flow
Thus, there is expectations that Genting has exited its Mark Down phase.
1st Target: S$0.95
2nd Target: S$1.00
Stop: 10DSMA Trailing Stop
 Long
Long
Potential Further Upside for ThaiBevPrice broke out of its re-accumulation zone that started since early Sept, it continued to mark up with Bullish character (Rally with increased volume and react with low volume).
Supporting the market are Relative strength showing outperformance against the market and technical indicator MACD displaying positive momentum.
1st target level will be at S$0.95 resistance.
Stop price at 10D SMA (10 days simple moving average)
Disclaimer applies.
 Long
Long
U77 SGX BUY/LONG NOW READY! 0.650 to 1.285 by 2023TICKER CODE: U77
Company Name: SARINE TECH
Industry: Singapore Stocks Electronic Technology Electronic Equipment/Instruments
Position Proposed: BUY
Entry: NOW READY (0.650-0.900)
1st Partial Take Profit: 1.285 (September 2023)
2nd Partial Take Profit: 1.945 (September 2024)
3rd Partial Take Profit: 3.060 (December 2027)
Stop Loss: 0.465
Technical Analysis
1. Large Inverted Head and Shoulders (Forming head)
2. Falling Wedge (Broke out of diagonal structure)
3. Double Bottom
4. Small Pennant Pattern Forming to Push about Key Structure
 Long
Long

DBS also has downside riskDBS, the biggest component of the STI, appears to have great downside risk.
Breaking below support of 29.60, after a lower high, means a lower low is put in place.
The weekly chart already had a Bearish Engulfing last week, and this week (left with 1.25 days) closing down below 29.60 to end the week would be another toppish candlestick pattern called the Three Outside Down pattern. Bad for tops.
MACDs and RPMs look like shite... heads up.
Oh, btw... may be a couple of weeks for this to pan out IF it really breaks down.
Short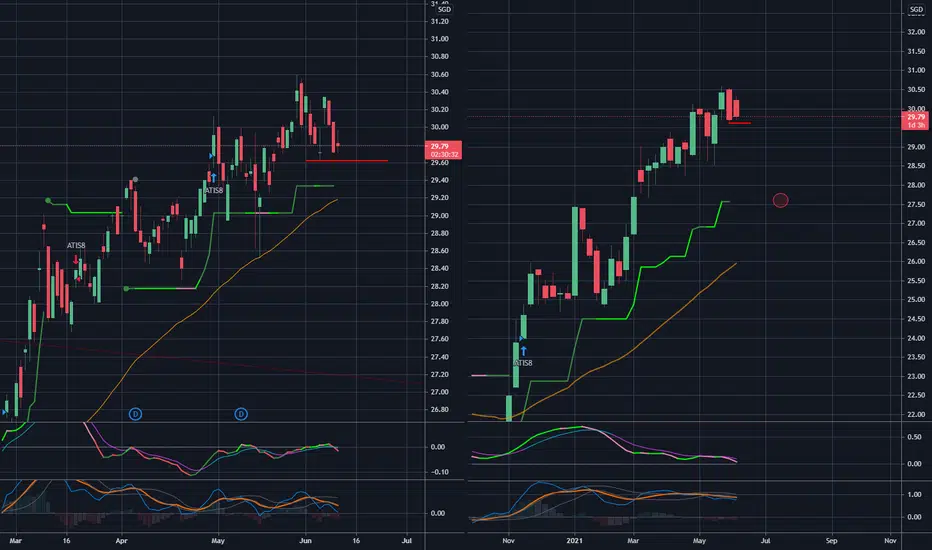
594 SGX BUY/LONG NOW READY! 0.05 to 0.016 by Mid 2022!TICKER CODE: 594 SGX
Company Name: CAPALLIANZ HOLDINGS LTD
Singapore Stocks Energy Minerals Oil & Gas Production
PENNYSTOCK BUY AT OWN RISK!
Position Proposed: BUY
BUY ENTRY: NOW READY (0.05)
1st Partial Take Profit: 0.012 (End 2021)
2nd Partial Take Profit: 0.016(Mid 2022)
NOTE THAT THE TIMELINE IS ONLY AN ESTIMATION
Stop Loss: 0.03
Technical Analysis
1. LARGE INVERTED HEAD & SHOULDERS PATTERN (PARTIALLY COMPLETE)
2. Fibonacci Retracement at 0.786
3. 1st Partial Take Profit is at Fibonacci Extension Level 1 Grey Zone (Safe Zone)
4. 1st Partial Take Profit is at the Fibonacci Extension level of 1.618 which is also at the price range of the pole.
5. 2nd Partial Take Profit will complete the head formation of the INVERTED HEAD & SHOULDERS
it will also hit Area of Confluence on EMA 200 & structure levels which will very likely reject down
to form our 2nd Shoulder
 Long
Long
569 SGX BUY/LONG NOW READY! 0.230 to 0.690 by Mid 2023!TICKER CODE: 569
Company Name: VICPLAS INTL
Singapore Stocks Producer Manufacturing Industrial Machinery
Position Proposed: BUY
FOMO BUY ENTRY: NOW READY (0.245)
NEXT BUY ENTRY: (0.230)
1st Partial Take Profit: 0.690 (Mid 2023)
2nd Partial Take Profit: 0.980-1.020 (2024-2025)
NOTE THAT THE TIMELINE IS ONLY AN ESTIMATION
Stop Loss: 0.175
Technical Analysis
1. LARGE INVERTED HEAD & SHOULDERS PATTERN (PARTIALLY COMPLETE)
2. Area of Confluence on EMA & structure level
3. Fibonacci Retracement at 0.786
4. 1st Partial Take Profit is at Fibonacci Extension Level 1 Grey Zone (Safe Zone)
5. 2nd Partial Take Profit will be at the 80% price range of INVERTED HEAD & SHOULDERS
 Long
Long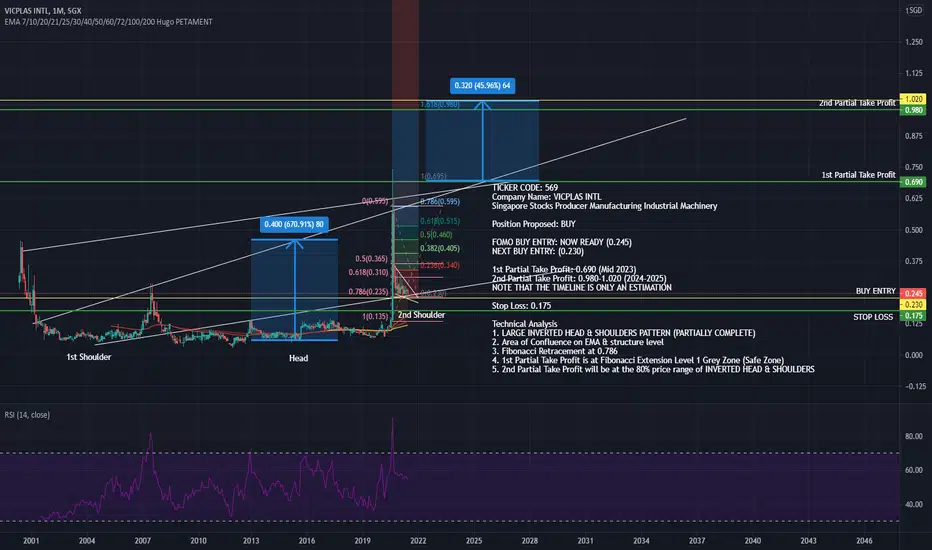
AJBU SGX BUY/LONG INCOMING! 1.65 to Potentially 4.40!TICKER CODE: AJBU
Company Name: KEPPEL DC REIT
Industry: Singapore Stocks Finance Real Estate Investment Trusts
Position Proposed: BUY (1.90-1.65)
BUY ENTRY: NOT READY (1.90-1.65)
1st Partial Take Profit: 3.10-3.35
2nd Partial Take Profit: 4.10-4.40
Stop Loss: 1.30
Technical Analysis
1. FLAG PATTERN ( PARTIALLY COMPLETED )
2. Area of Confluence on trendline & structure level
3. Move sideways within the channel itself
4. Fibonacci Retracement at 0.618 OR 0.786
5. Safest Take Profit will land equivalent to the Flagpole length and level 1 of Fibonacci Expansion Grey Zone
 Long
Long
AWX POTENTIAL BUY/LONG INCOMING 2.00 to 5.30 by Early-Mid 2022TICKER CODE: AWX
Company Name: AEM
Industry: Singapore Stocks Industrial Services Engineering & Construction
Position Proposed: BUY
Buy Entry: NOT READY (2.00-2.20)
1st Partial Take Profit: 5.30 Early-Mid 2022)
2nd Partial Take Profit: 7.35(Early 2023)
Stop Loss: 1.90
Technical Analysis
1. Falling Wedge/Pennant Pattern (Potentially Forming)
2. Area of Confluence with Trendline and Horizontal Resistance Level (Key Level)
3. Fibonacci Retracement at 0.786 is at key market structure
4. Fibonacci Expansion Safe Take Profit Level 1 (Grey Zone) Also the length of Flagpole
and also Channel Range (Trendline Resistance)
Long
Genting Sing G13 [1-3 weeks view}This is an analysis for a client.
Technical indicators showing room for further bullish momentum.
Please do your own due diligence.
This is for analysis purposes only.
Losses can happen so please understand your risks and investment objectives first.
Long
S51 SGX BUY/LONG NOW READY 0.175 to 0.655 by Early-Mid 2022TICKER CODE: S51
Company Name: SEMBCORP MARINE
Industry: Singapore Stocks Producer Manufacturing Trucks/Construction/Farm Machinery
Position Proposed: BUY
Entry: NOW READY (0.175-0.190)
1st Partial Take Profit: 0. 465(August-October 2021)
2nd Partial Take Profit: 0.655(Early-Mid 2022)
Note that timeline buffered, I would expect Full Take Profit by Early 2022
Stop Loss: 0.160
Technical Analysis
1. Large Inverted Head & Shoulders (Forming)
2. Fibonacci Retracement at 0.786 ( Silver Zone)
3. Flag Pattern (Nearly Completed)
4. 1st Take Profit will be at Fibonacci Expansion Safe Take Profit and Flagpole Length
Long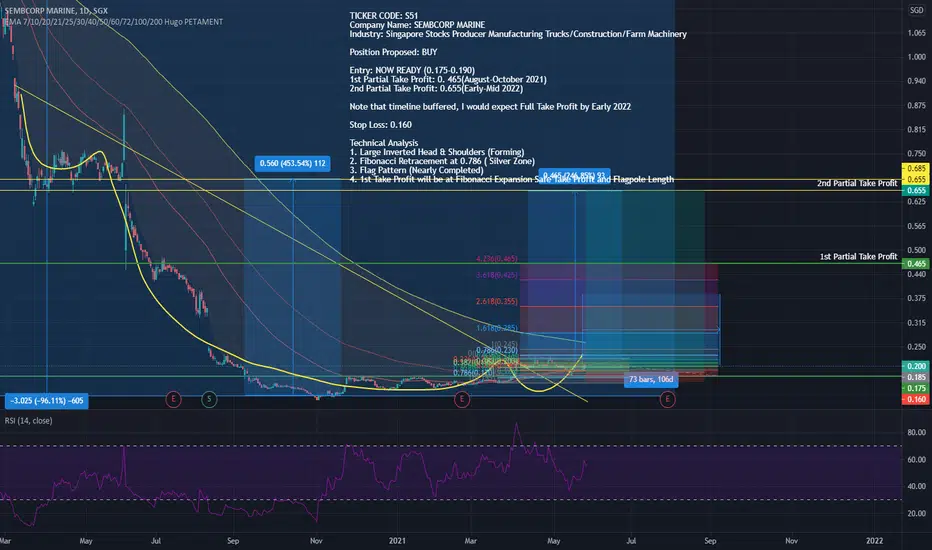
 Long
Long
Singtel Z74 SGX BUY/LONG 2.30 to 2.86 by September 2021TICKER CODE: Z74
Company Name: Singapore Telecommunications Limited
Industry: Telecom Services| Communication Services | Singapore
Position Proposed: BUY
Technical Analysis
1. Large Inverted Head & Shoulders (Forming)
2. Pennant Pattern (Broke out and Retraced)
3. Take Profit will be at Key structure level and 80% of Head & Shoulders Price Rane
Entry: NOW READY (2.30-2. 50 )
1st Partial Take Profit: 2.86(August-September 2021)
Note that timeline buffered, I would expect Full Take Profit by Early 2022
2nd Partial Take Profit Analysis will be updated when we are close to our 1st Take Profit Area
 Long
Long
MEDTECS SGX SELL/SHORT to 0.20-0.60 before BIG BUY! (UPDATE)TICKER CODE: 546
Company Name: Medtecs International Corporation Limited
Industry: Medical Instruments & Supplies | Singapore
Proposed Position: Sell
Technical Analysis
1. Downwards Flag Pattern (Forming)
2. Downwards Fibonacci Retracement at 0.618
3. The market will more likely impulse downwards to test key levels before rising up
4. The flagpole take profit price range is on the market key levels
Safe Exit: 1.25
1st Buy Entry: 0.60
2nd Buy Entry: 0.45
3rd Buy Entry: 0.20 - The market may test to this level (I doubt it will but it could)
1st Partial Take Profit: 2.40
2nd Partial Take Profit: 3.60
Stop Loss: 0.17
Again, I apologise to all my followers for the previous analysis. Please review and revert to this analysis and signals. As I did not consider and account for the downwards impulse and pullback! 🙇♂️🙇♂️
 Short
Short