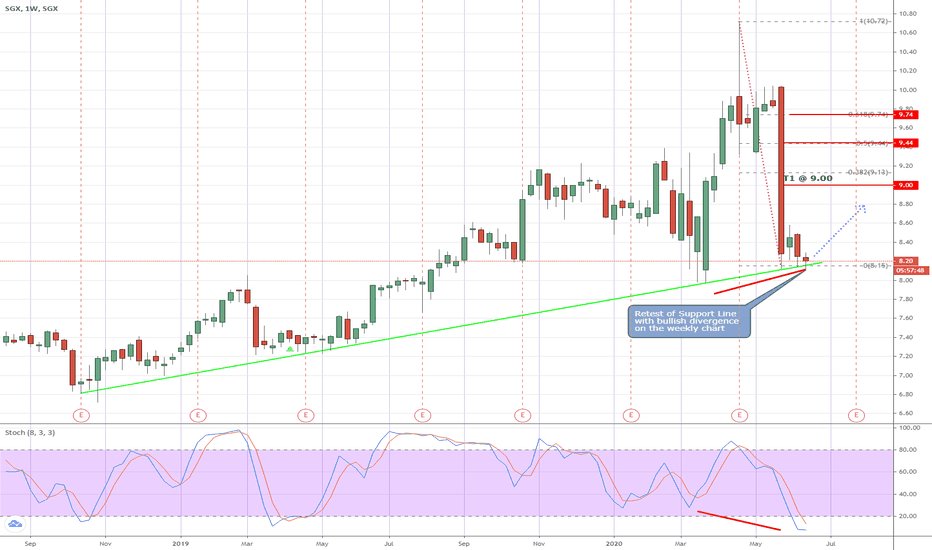
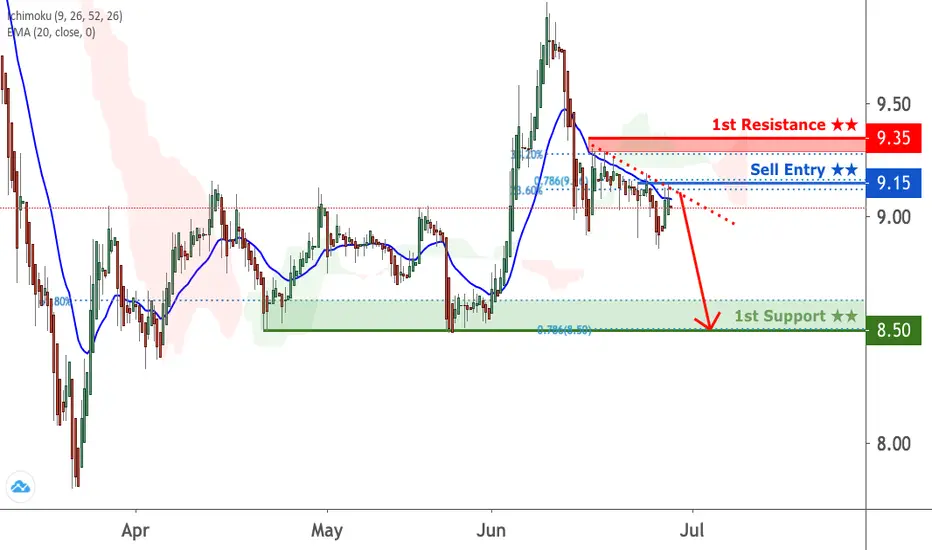
SGX (Things are about to get nasty)Updated View On SGX (29 MAY 2020)
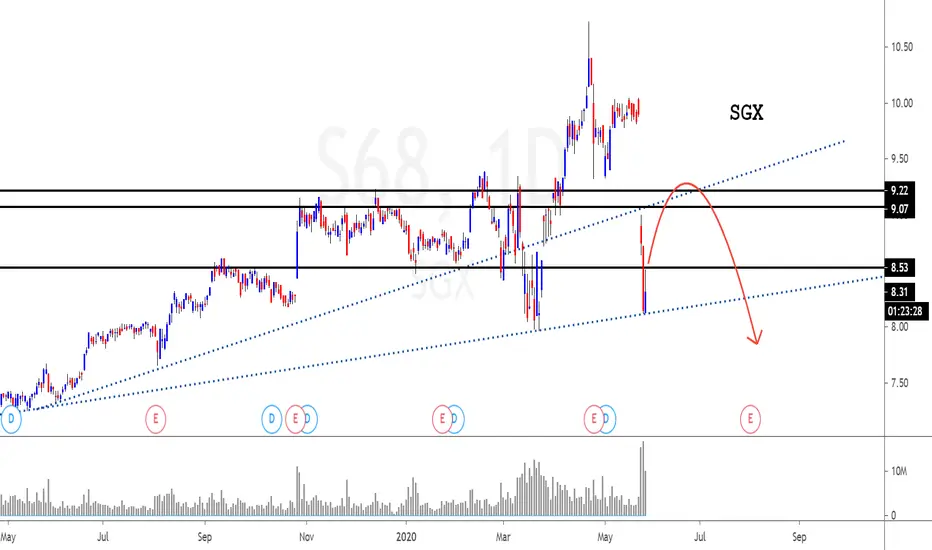
SGX had a great fall and it has touched to strong swing support region $8 in recent days.
That's the reason why we are seeing some pullback action.
The pullback action may bring the price up higher but s long as it can't swing back above $9.2 region, we will expect to see more bearish actions soon.
DYODD, all the best and read the disclaimer too.
Feel Free to "Follow", press "LIKE" "Comment".
Thank You!
Legal Risk Disclosure:
Trading foreign exchange or CFD on margin carries a high level of risk, and may not be suitable for all investors.
The high degree of leverage can work against you as well as for you.
Before deciding to trade foreign exchange you should carefully consider your investment objectives, level of experience and risk appetite.
The possibility exists that you could sustain a loss of some or all of your initial investment and therefore you should not invest money that you cannot afford to lose. You should be aware of all the risks associated with foreign exchange trading, and seek advice from an independent financial advisor.
DISCLAIMER:
Any opinions, news, research, analyses, prices or other information discussed in this presentation or linked to from this presentation are provided as general market commentary and do not constitute investment advice.
Sonicr Mastery Team does not accept liability for any loss or damage, including without limitation to, any loss of profit, which may arise directly or indirectly from use of or reliance on such information.
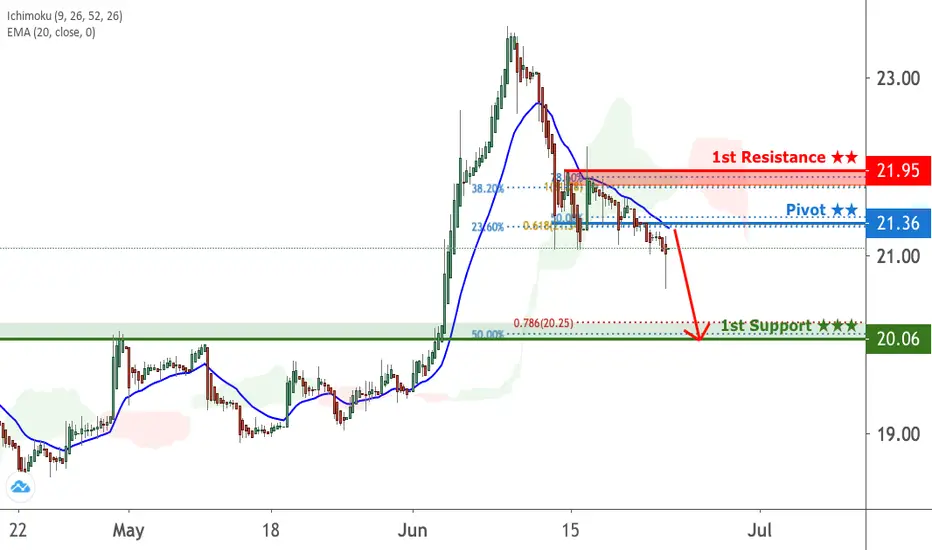
DBS - resumption of slow road to recoveryAfter hitting a high of 23.58 recently, DBS has been pulling back in the last 2 weeks cumulating to a low @ 20.63 yesterday but quickly recovered to close a bullish pin bar. Now it that has "successfully" tested the 50% fibonacci retracement of the recent swing up plus having worked off the overbought position to near term oversold now. It looks ready to resume the slow climb back up. (with stop loss just below yesterday's low 20.63)
Disclaimer: This is just my own analysis and opinion for discussion and is not a trade adviDisclaimer: This is just my own analysis and opinion for discussion and is not a trade advice. Kindly do your own due diligence and trade according to your own risk tolerance. Thank you.ce. Kindly do your own due diligence and trade according to your own risk tolerance. Thank you.
C38U Possible Long SetupPrice is at a very respected trend line support (numerous touches), and in confluence with the 50EMA as support.
Bullish engulfing / tweezer bottom candlestick pattern formed at this level, adding to the bullish setup.
Stochastic indicator approaching the oversold area, suggesting further bullish action.
Possible profit targets could include the 200EMA, the upper trend line level, or the previous high.
Stop loss levels could include be below the wick of the current candle, below the previous low, or below the horizontal line denoting past resistance, which could be tested as new support.
Let me know your thoughts.
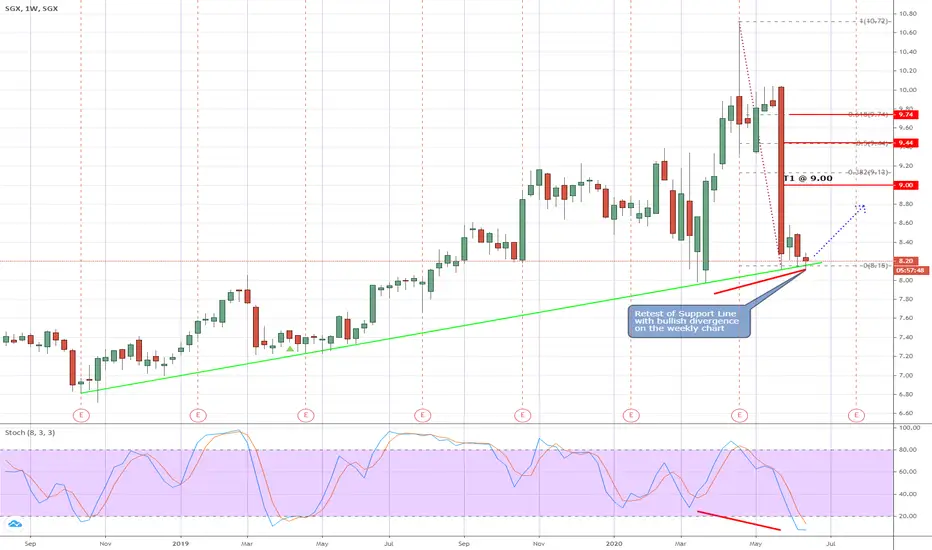
SGX - Time is Ripe for recoverySGX has been testing the Trendline Support around 8.15 in the past month. Today it tested this level again and is now bouncing just a little above the trendline. However it a weekly bullish divergence (between the stock price and stochastic) is now forming. The chance is better now for a slow recovery to to the upside with initial stop loss just below 8.10.
Disclaimer: This is just my own analysis and opinion for discussion and is not a trade advice. Kindly do your own due diligence and trade according to your own risk tolerance. Thank you.
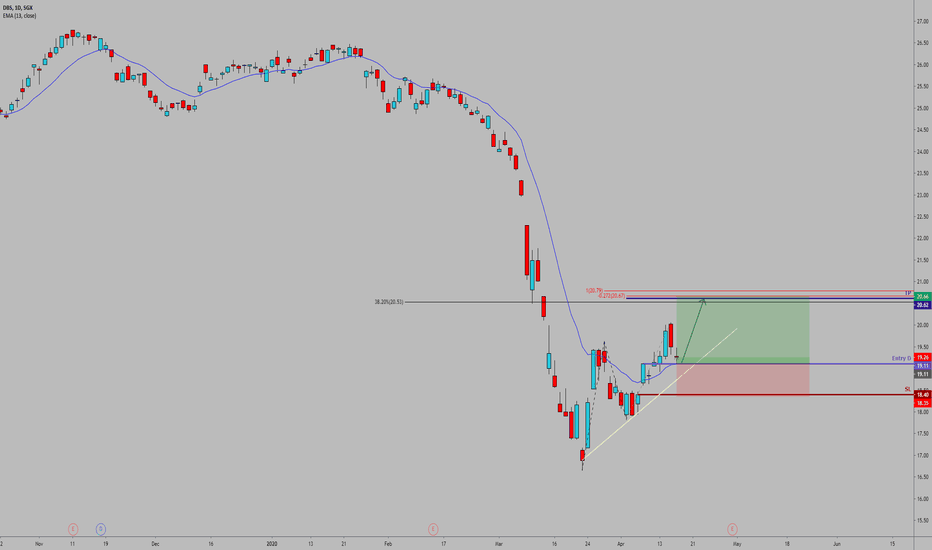
DBS [1-3 weeks view]Long DBS
Entry: 19.11
SL: 18.35
TP: 20.62
DBS dropped quickly to new lows and is currently in a rebound.
Fibo and graphical level lining up nicely at the TP level.
Price above ascending trendline support and also moving average.
This should be a limited push up as I am generally bearish across the global markets.
Mapletree Logistics Trust - breaking out of Bull FlagAfter hitting a high of 2.09 on 1st June, MLT has been consolidating in the past 2 weeks and forming a Bull Flag. The low was in place @ 1.84 (horizontal and 38% fib retracement support there).
It broke out of this Bull Flag @ 1.94 today and looks set to resume it's uptrend in the coming days. Expecting a retest of 2.08 although whether it could break this level in the near term remains to be seen
Long @ 1.95 with initial stop @1.89.
Disclaimer: This is just my own analysis and opinion for discussion and is not a trade advice. Kindly do your own due diligence and trade according to your own risk tolerance. Thank you.