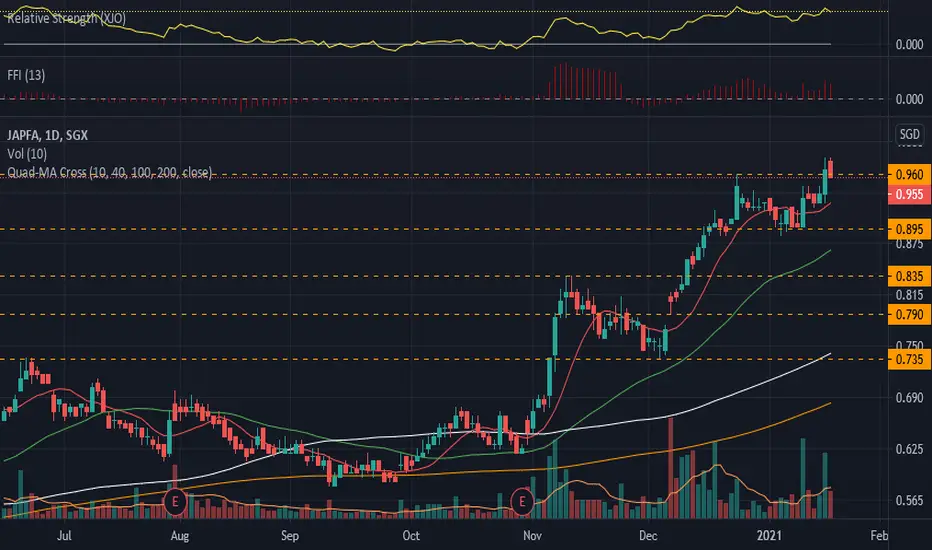
UD2.SGX_LongENTRY: 0.965
TP1: 1.035
SL: 0.890
- ADX>25
- RSI>65
- FFI and RS +ve
- MA are aligned
- Breakout with good volume on 18 Jan 2021
- Entered today on pullback with low volume
ULong
FRASERS L&C Trust (SGX Stock)View On FRASERS L&C; Trust (27 Jan 2021)
This counter pop up in my scanner for a BEARISH set up.
I am expecting as long $1.50 level is not broken up strongly, Bear shall have a chance.
If it pulnges lower, $1.38 level will be the next support and $1.28 will be another good support.
DYODD, all the best and read the disclaimer too.
Feel Free to "Follow", press "LIKE" "Comment".
Thank You!
Legal Risk Disclosure:
Trading foreign exchange or CFD on margin carries a high level of risk, and
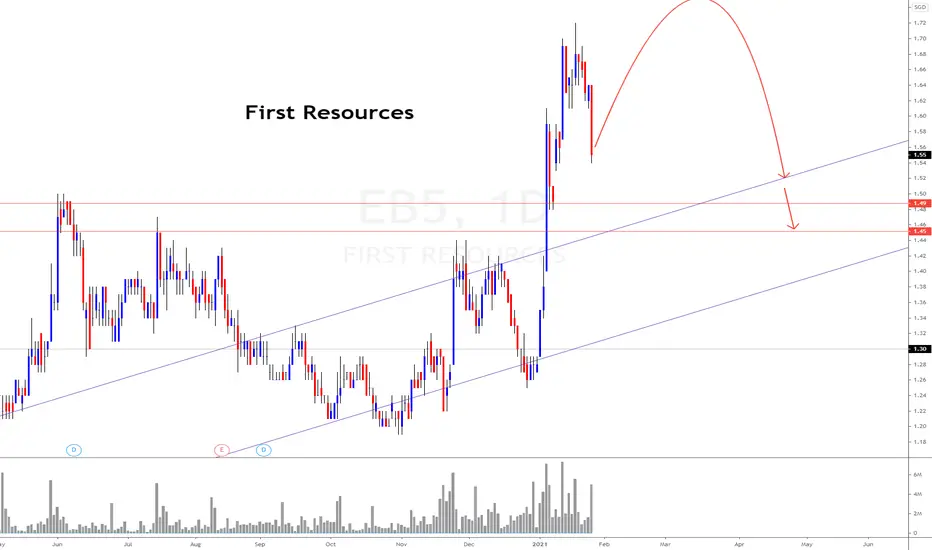
First Resources (SGX)View On First Resources (26 JAN 2020)
This counter popped up in our scanner for the potential BEAR set up.
It may swing up to 1.65~1.68 region but it can go lower eventually toward 1.45~1.50 region.
DYODD, all the best and read the disclaimer too.
Feel Free to "Follow", press "LIKE" "Comment".
Thank You!
Legal Risk Disclosure:
Trading foreign exchange or CFD on margin carries a high level of risk, and may not be suitable for all investors.
The high degree of leverage can work against
Raffles Medical (SGX counter)Updated View On Raffles Medical (25 Jan 2021)
This counter popped up in our scanner for the potential BEARish trade.
I expect 0.895 region shall be next.
DYODD, all the best and read the disclaimer too.
Feel Free to "Follow", press "LIKE" "Comment".
Thank You!
Legal Risk Disclosure:
Trading foreign exchange or CFD on margin carries a high level of risk, and may not be suitable for all investors.
The high degree of leverage can work against you as well as for you.
Before deciding
A78 Long Term HoldInvested very small amount into this micro penny stock @ 0.003
TP: 0.021
What do you all think?
ALong
41H Symmetrical TriangleBought this stock in Dec 2020 @0.016 and it has been hovering around 0.015~0.017.
Day/Hourly Charts all look like symmetrical triangle breaking soon (?)
Plan
TP1: 0.023
TP2: 0.026
TP3: Depends on how the stock goes after TP2
4Long
SG: SIA ... to continue its fallLooking at the SIA weekly chart, it is obvious that there is a lower high, and a concomitant failure of the 55EMA. 4.15 is the final support, breaking down of this level means more downside.
The MACD, RPM and Volume Divergence are all supportive of the bearish outlook.
Possible to revisit its last low... around 3.50
SG: DBS ran out of juice...Just saw this weekly chart of DBS (D05)...
After a spectacular and amazing run up, DBS is clearly stalling out and poised to fall a good 10%, maybe more.
Candlestick patterns show a bearish inside candle, fallowed by another that gapped down.
point here is that if this is still remotely bullish, there should be better patterns and signs of strength somewhat.
MACD has stalled and is pretty much turning down.
the RPM and Volume Divergence all convergently signal downside to follow.
Notably, the