Price Peak Show Up After Denies Optus Sales' RumorPrice in 5 mins shows unreasonable price & volume formed. Despite high volume traded intraday, but the stock price stays within the range. This could mean the "Jedi" are holding the price up while churning volume to looks good to the public.
From our analysis, we find these price movement a price peak & a possible short term retrace is building up. Which going for a short DLC, $Singtel 5xShortSG241218(DVZW.SI) will make more sense for us.
This is just our short term view based on our analy
UD2-SG is in LT sideways. Now it is at lower band.UD2-SG is in LT sideways. Now it is at lower band. It maybe a good mean reversion setup. tp 0.34 0.49. However, it may take a while to realise profit.
#ARTTpick #KebayaTrader
ULong
We are back!! $SIA(C6L.SI) Showing sign of bottomHas been away awhile from here! Hope everyone is doing well in the stock market! Let's dive into our analysis on SIA C6L
Recent fall shows signs of volume supporting the price at the previous low in the 5 mins chart (yellow box).
With price moving slightly higher could be a sign of short term rebound is on the way.
Our trading method:
Taking advantage to this possible short term rebound & maximizing the returns with our low exchange rate of MYR to SGD, we look into SIA's DLC issue by #soci
Fundamentals and Weekly Technical align.ISDN just released its full year, though numbers are disappointing, the company mentioned that they had been re-investing heavily during down time to capture market share. With yuan bottoming, semicon seeing a pick up in 2H 2024, and Chinese advanced manufacturing boom for the foreseeable future, I expect a stella FY 2024 from low base of FY 2023.
Technical wise, there is 3 supports that forms a good bullish divergence on MACD. Breaking the downward sloping resistance may see the price rebound
Price target for G Invacom(SGX:QS9)?On February 19, G Invacom’s chart broke out of a classic triangle chart pattern, which would be considered a strong break if it closes at $0.055 or higher. In a previous instance, when the chart broke down from a descending triangle on November 19 of last year, the price dropped by 22% to reach its lowest point.
Similarly, when the price broke down from a triangle pattern on August 14, 2022, it fell by 30% over the next two months. Therefore, it’s possible that the price may rise again if G Inv
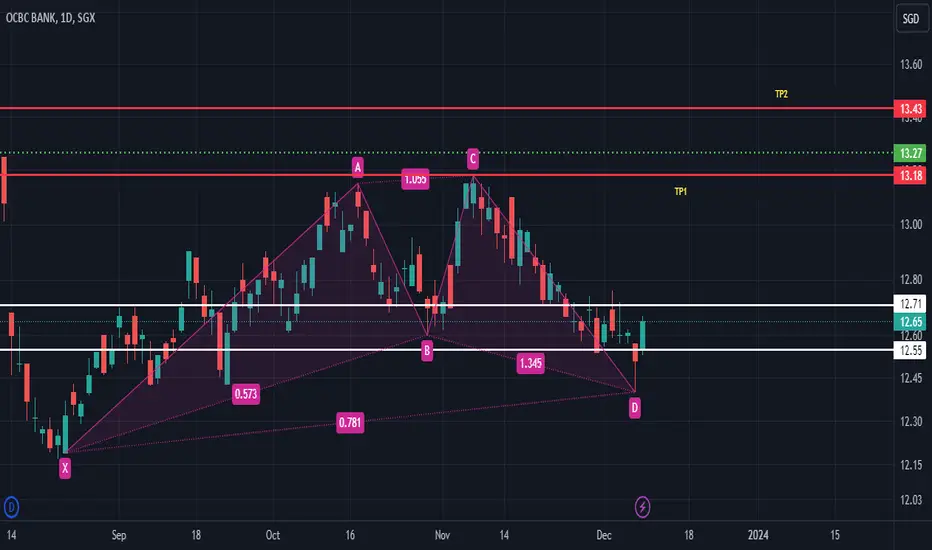
Potential bullish pattern - OCBCPotential bullish pattern - OCBC
Entry and Exit as shown in chart.
Feel free to share your thoughts comments box. Note: This is not financial or investment advise. It will be good to always understand the risks involve in trading. Always trade with stop loss in place. Give a thumbs up if u like the analysis :)
Moving average triple crossover - DBS Bank SingaporeDBS(D05) stock continues to fall again this year repeating a highly probable triple crossover of their moving averages despite their solid returns and stable dividend. While Singaporean banks remain resilient, this signals shows another buying opportunity for one of their strongest banks with a dividend of 0.48
IREIT Global may hit 0.475 !!!I have been watching this REIT for some time now. Finally, it breaks down from the support area at 0.56 level. I expect it to revisit 0.475 the next support level in the coming weeks or months.
That will be an attractive price level for me to buy for good dividend income while the safety margin is higher for it to return the capital appreciation in the coming years .
China's easing, OPEC+'s Oil Production Cut, Recovery PlaySGX:G92
Comments on Annual Quantitative Analysis
End 2023 Price Target using same PE as 2022 = $1.24
End 2023 Price Target using same Sales Multiple as 2022 = $0.73
Forecasted Revenue to decrease but Net Income to increase in 2023. The increase in Net Income could be attributed to the increase in Other Income. Lower Revenue is affected by the decrease of oil prices and volume. Other Income is contributed by Interest Income and government rebates.
Quantitative Analysis (Sector Compa
Ask and you shall be givenSo what did you ask from God last night when you sleep ?
It does not matter what your religion or faith is, but if you do believe there is a higher universe than we, human beings, be it Allah, Buddha, Jesus Christ, etc , then this supreme power must have the power to reign over us.
That is why I am constantly talking about thoughts, feelings, moods, beliefs, intuitions, etc. The market, however complex it may be with its financial products and how analysts talk about the market, it is , strip
SIA shows sign of price peakRecent rebound in SIA shows multiple high volume in 5 mins chart yesterday with limited price up.
This indicates the big boys are churning at the high price to creates Fear-Of-Missing-Out to retail investors to place order in.
When there are enough buyers at the lower pricing, the big boys will start selling for profit taking.
CapitaLand Ascendas REIT (A17U) weekly chart*** non-dividend adjusted
Ever since the hugh drop back in Sep 2020 (covid), it has been a choppy slight downtrend path connecting most of the Peaks & Troughs (ignore occasional exceptional dips)
More than 10 times, lower channel were tested and perhaps we can expect it will happen again
So buy on dip along lower channel? Of course u decide your own😀