Long
Long
BOND YIELDS ARE RISING. BUT DOES GOLD HAVE TO FALL?XAUUSD: Rising Bond Yields Do Not Necessarily Mean Gold Will Fall
Traders are often familiar with a simple formula:
Rising bond yields → Gold falls.
Falling bond yields → Gold rises.
Because bonds pay interest, while gold does not.
But the market is not always that simple.
What Are Yields?
Let’s use a simple example.
You buy a house for approximately $670,000 and rent it out for approximately $1,025 per month.
In one year, the income you receive is:
$1,025 × 12 months = $12,300 per year
The formula is:
Yield = Annual income ÷ Asset value
Therefore:
$12,300 ÷ $670,000 ≈ 1.84% per year
Simply put:
You invest approximately $670,000 and earn approximately $12,300 per year → the yield is approximately 1.84%.
What Happens If the House Price Changes?
Assume the rental income remains approximately $12,300 per year.
But the house price falls from approximately $670,000 to $395,000.
Now:
$12,300 ÷ $395,000 ≈ 3.12%
The house price falls → The yield rises.
Conversely, if the house price increases:
The asset price rises → The yield falls.
Bonds work in a similar way:
Bond prices fall → Yields rise.
Bond prices rise → Yields fall.
But This Is What Matters for Gold Traders:
Don’t Just Ask:
Are yields rising or falling?
Ask:
WHY ARE YIELDS CHANGING?
Case 1: Yields Rise Because the Economy Is Strong
For example:
The U.S. economy is performing well.
The labor market is strong.
Inflation is high.
The market believes the Fed will keep interest rates higher for longer.
In that case:
Bond yields rise.
Gold may come under pressure.
This is the scenario traders commonly encounter.
But There Is Another Scenario:
Yields are still rising.
But not because the economy is strong.
Instead, the market is becoming increasingly concerned about:
Inflation.
Government debt.
Budget deficits.
The government needing to borrow too much money.
Investors may start thinking:
“If you want me to lend you money for 10 or 30 years, the current yield is not attractive enough.”
They demand higher yields.
And:
Bond prices fall → Yields rise.
Yields are still rising.
But the story behind the move is completely different.
And That Is When Gold Does Not Necessarily Have to Fall.
Because this time, rising yields may be accompanied by:
MARKET ANXIETY.
If investors become increasingly concerned about:
Government debt.
Budget deficits.
Inflation.
Financial risks.
Then gold may still attract buying interest.
Conversely, Falling Yields Do Not Necessarily Mean Gold Will Rise Solely Because of Interest Rates.
We must also ask:
WHY ARE YIELDS FALLING?
If yields fall because the market expects the Fed to cut interest rates:
→ This may support gold.
But if yields fall because money is flowing into bonds as a safe haven amid market fears:
→ Gold may rise as well.
CONCLUSION
Rising bond yields do not necessarily mean gold will definitely fall.
Falling bond yields do not necessarily mean gold will definitely rise.
The same change in yields...
But the underlying reasons can be completely different.
As a trader, don’t just look at the number.
Look at why the number is changing.
And the most important question is always:
WHY?
What is the market expecting?
Or:
What is the market worried about? Why the Treasury's Bond Buyback Failed to Calm Bond Markets
On August 19, 2026, the US Treasury made a surprising announcement: it would more than double its bond-buying operations to between 2 and 4 billion dollars each, with a focus on long-dated debt. Interest rates fell sharply in response to the news, with the 10-year Treasury down over 5 basis points and the 30-year down 9 basis points, while stock futures jumped.
However, by the next day, most of the gains had been erased, with the 30-year yield climbing back towards its 19-year peak. This article will discuss what happened, why the market reacted so positively to the news at first, and what this episode says about the effectiveness of government interventions in a market as large and complicated as that of the bonds.
What the Treasury actually did
The US government routinely issues new debt to finance its operations, but it also conducts occasional buybacks of its own bonds, which are designed to provide liquidity to the bond market and allow the Treasury to intervene in specific points of the yield curve.
The Treasury announced on August 19 that it would be increasing the scale of its buybacks for bonds between 10-20 and 20-30 years, starting on September 9 and ending on November 4. This announcement came at a time when the national debt of the US was approaching 40 trillion dollars for the first time, and the 30-year yield was at 5.323%, its highest level since 2007.
Why the market reacted positively to the news
The market’s positive reaction to the news was entirely rational, as the intervention the Treasury was planning to make was undeniably helpful. An increase in demand for bonds, even if it is not directly stated as such, will always have a positive effect on their prices and hence lower their yields, at least in the short term. This is precisely what happened on Wednesday, when both the 10- and 30-year yields fell by several basis points within hours of the announcement.
Why the market erased most of the gains
However, by Thursday, most of these gains had been erased, with the 30-year yield climbing back to near its 19-year peak. By Friday, the yield on the 10-year Treasury was nearly back to where it was before the announcement was made, having regained more than 5 basis points. Analysts have several reasons for believing that the positive reaction to the news was not justified.
First of all, they pointed out that the changes announced by the Treasury were not large enough to have a significant impact on the bond market. An increase in the scale of buybacks from 2 billion to 4 billion dollars, while significant, was not nearly as large as the 32 trillion dollars in bonds issued by the Treasury. According to one analyst from Jefferies, the intervention was too small to have a meaningful impact on the supply-demand dynamics of the bonds.
Furthermore, analysts pointed out that the buybacks essentially only address the symptoms of the yield increase, not the causes. Several strategists mentioned that the rising yields were the result of concerns about the size of the deficit and hence should have been addressed directly. Another analyst from JPMorgan noted that the market’s reaction to the news might have been counterproductive in the long run.
He stated that the market’s positive reaction to the news might have undermined the credibility of the Treasury’s commitment to a “steady and consistent” approach to managing the debt, as an unpredictable intervention of this sort creates a “higher risk premium” for bonds, which defeats the original purpose.
Another analyst noted that the buybacks can be seen as an informal attempt to intervene in the yield curve and limit its growth, which means that their effects should be interpreted with this in mind. The market takes such signals from the government seriously, and hence the yields did not fail to react to the news, despite the initial drop on Wednesday.
What lies ahead for bond yields
The increase in bond yields that started back in June was caused by several different factors, most of which are still present and contribute to the rise in yields. These include the concerns about the size of the deficit, the increase in the term premium, the shift in the composition of buyers of the bonds, and the increased issuance of corporate bonds backed by AI infrastructure.
Higher yields for longer-dated bonds are also felt outside the government debt, as the 30-year mortgage rates climbed to 6.75% around this time, which is a direct result of the same forces pushing the Treasury yields higher.
What to watch for
The most important development to watch for in the near future is the comments made by the Fed’s chairman, Kevin Warsh, at the Jackson Hole Economic Symposium, as the market is waiting for any signals about the intentions of the central bank to intervene. Several analysts believe that the recent jump in yields has essentially been a test of the resolve of the Fed, and hence its reaction will shape the future movements of the yields.
It will also be important to watch for any changes the Treasury makes to its bond-buying operations, as such a significant reaction to a relatively small intervention suggests that the government is concerned about the size of the yield increases. If the Treasury continues to make similar announcements in the future, it will show that the interventions announced so far were not nearly enough to stabilize the market.
The level of the 30-year yield relative to its 19-year peak is also a helpful indicator to watch, as the market’s attempts to push the yields higher suggest that the forces driving them upwards are still present.
My final thoughts
For one day, it seemed as if the concerns about rising yields had been calmed and the market had reacted positively to the news. However, by the end of the week, the market made it clear that, for the time being, the long-term yields were on a path towards higher levels.
While the announcement made by the Treasury was helpful, it failed to address the larger concerns about the size of the deficit and the risks posed by the growing national debt. The market made it clear that an increase in the scale of buybacks from 2 billion to 4 billion dollars was not enough to stabilize the bond market and hence stop the rise in yields.
Thank You
@VertexQore Education 
 Short
Short
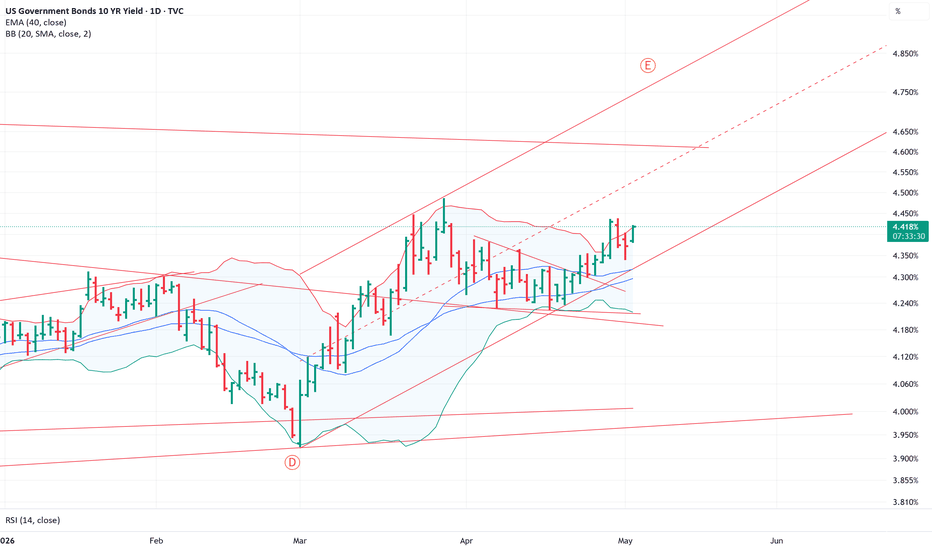
US 10-Year Yield: The Number That Controls Everything
Look at this for a second: one number moves by just 0.10%, and six different parts of the global economy react almost instantly: stocks sell off, borrowing costs rise, mortgage rates go up, the dollar strengthens, gold comes under pressure, and money starts leaving emerging markets. That's not an exaggeration. That's literally what happens, over and over, every time this number moves.
Most traders never look at this number properly. They watch their favorite stock, check the news, maybe glance at Fed headlines, but the real engine behind most of these moves is sitting quietly in the bond market. Let's break it down, one piece at a time.
First, what is the 10-Year Yield?
The US government borrows money by selling bonds. When you buy a 10-Year Treasury bond, you're lending the government money for 10 years, and they pay you interest for it. That interest rate is the yield.
The one thing beginners always get confused about: bond prices and yields move opposite to each other. If people are buying bonds, prices go up and yields go down. If people are selling bonds, prices go down and yields go up. So when yields rise, it usually means investors are selling either because they want a better return, or they're worried about inflation eating into their money over time.
This yield is called the risk-free rate because lending to the US government is about as safe as investing gets. Almost everything else in finance gets compared against it; that's why this number carries so much weight.
1. Stock markets sell off
When big investors work out what a stock is really worth, they estimate the company's future profits and bring that value back to today's terms using a discount rate. The 10-Year Yield sits right inside that discount rate.
When yields rise, future profits are worth less in today's dollars, so stock prices tend to drop. This hits growth and tech stocks the hardest, since their value is based heavily on profits still years away.
Next time the 10-Year Yield spikes, watch how fast Nasdaq futures turn red often before any actual news even comes out.
2. Borrowing costs rise for everyone
Companies borrow money to grow, hire people, and buy back their own shares. The rate they pay is basically the 10-Year Yield plus a bit extra depending on how risky the company is seen to be. When yields rise, borrowing gets more expensive across the board, even for financially strong companies. That means fewer stock buybacks, slower expansion, and real pressure on companies already carrying a lot of debt.
3. Mortgages and loans get more expensive
This is the one that hits regular people directly. Mortgage rates mostly track the 10-Year Yield, plus a margin added by lenders, not the Fed's rate decisions, as most people assume. If the 10-Year Yield jumps from 4.00% to 4.50%, mortgage rates usually move up close to the same amount. On a $400,000 home loan, that can add over $100 to your monthly payment. Multiply that across millions of buyers and the whole housing market slows down.
4. The US dollar strengthens
Money around the world is always looking for the best safe return. When the 10-Year Yield rises, US bonds become more attractive compared to bonds from other countries, so money flows into the dollar and it strengthens.
A stronger dollar creates its own chain reaction: US exports get more expensive for other countries to buy, debt gets more expensive for anyone who borrowed in dollars, and dollar-priced commodities like oil often get cheaper.
5. Gold and commodities come under pressure
Gold doesn't pay any interest it just sits there. So its appeal depends on what you're giving up by holding gold instead of something that pays you, like a Treasury bond. When yields rise, especially after adjusting for inflation, gold usually becomes less attractive and can fall.
When yields fall, especially while inflation stays high, gold tends to look more attractive and often rises.
6. Emerging markets see capital outflows
Countries like Brazil, Turkey, India, and Indonesia depend heavily on foreign money flowing into their stock and bond markets. When the 10-Year Yield rises, that "safe" American return looks more attractive, so foreign investors pull money out of these markets and move it back into US bonds.
This is called capital flight. A real example: 2013's "Taper Tantrum" when the Fed just hinted at slowing bond purchases, the 10-Year Yield jumped from around 1.6% to nearly 3% in a few months, and emerging market currencies fell sharply within weeks.
What happens when yields jump in a single day
Tech and growth stocks sell off within minutes as future profits get discounted more
Borrowing costs rise for companies trying to raise money
Mortgage quotes get adjusted higher, cooling down home buying
The dollar strengthens as money flows toward better US returns
Gold usually dips
Money starts flowing out of emerging markets back into the US
None of this needs a war, a crisis, or even a Fed meeting to happen. A single inflation report or a weak bond auction can set the whole thing off in one trading session.
A real-world example: banks feeling the pain
Banks hold large amounts of government bonds because they're considered safe. But when yields rise fast, the bonds a bank is already holding, bought back when yields were lower, lose value.
This is exactly what happened with Silicon Valley Bank in March 2023 . SVB had parked a big chunk of customer deposits into long-term bonds when yields were near zero. As yields climbed, those bonds lost value. When depositors got nervous and pulled their money out, the bank had to sell those bonds at a big loss, and it collapsed within days.
How to actually use this as a trader
Keep the 10-Year Yield chart open next to the Dollar Index, S&P 500, and Nasdaq to see the relationship in real time
Watch CPI reports, jobs data, and Treasury bond auctions; these move yields the most
Watch the gap between the 2-Year and 10-Year yield; when the 2-Year goes above the 10-Year, it's called an inversion, historically a strong recession warning sign
Don't trade off the yield alone; use it to confirm what your chart already shows
Remember: the real yield (10-Year Yield minus inflation expectations) matters most for gold, not just the raw number
My thought
Most traders spend all their time staring at one stock's chart and never realize the real force moving the market is sitting quietly in the background. The 10-Year Yield isn't just a bond thing. It touches stocks, borrowing costs, mortgages, the dollar, gold, and entire economies at the same time. Next time you see it move even a small amount, don't scroll past it. That tiny number is quietly moving trillions of dollars, and now you know exactly how.
Thank you,
@VertexQore
Education 
 Education

Education

Short