USDINR Trading ChartsHere is the unvarnished truth about what TradingView can do, the exact tickers you need, and how to build synthetic proxies for the data they lock behind Wall Street paywalls.
### **The TradingView Tickers You Need**
**1. The DXY (Dollar Index)**
* **Ticker:** `DXY` (or `TVC:DXY`)
* **Setup:** Just type DXY into the search bar. This is your standard baseline for dollar strength.
**2. The MOVE Index (Bond Market Volatility)**
* **Ticker:** `TVC:MOVE`
* **Setup:** This tracks the ICE BofA U.S. Bond Market Option Volatility Estimate. This is your primary panic gauge. Set a horizontal line on the chart at **150** so you know visually when to expect Fed intervention.
**3. USDINR (High, Low, Close)**
* **Ticker:** `FX_IDC:USDINR` (or `OANDA:USDINR`)
* **Setup:** Open the chart. To get the High, Low, and Close automatically mapped on your screen, click on the **"Indicators"** tab at the top and search for **"Daily High/Low"**. Add it to the chart. It will plot horizontal lines showing the exact day's high, low, and closing levels dynamically.
---
### **The Institutional "Workarounds" (The Missing Links)**
TradingView is a phenomenal tool, but it does not have the licensing rights to stream proprietary Bloomberg Terminal data or OTC institutional swaps. Here is how you build the proxies:
**4. Bloomberg U.S. Gov. Securities Liquidity Index**
* **The Problem:** This is owned by Bloomberg (`GOVSQYZ Cmdty`). You cannot chart this exact index on TradingView.
* **The TradingView Proxy:** Use the **TLT Implied Volatility** or the Bid-Ask spread of short-term Treasury ETFs.
* **How to chart it:** Type `CBOE:VXTLT`. This is the Cboe 20+ Year Treasury Bond ETF Volatility Index. It is the absolute closest proxy on TradingView to track how thin and dangerous the Treasury order book is getting. When `VXTLT` spikes, the Bloomberg Liquidity Index is breaching your 3.0 threshold.
**5. Cross-Currency Basis Swaps (EUR/USD)**
* **The Problem:** Basis swaps are traded over-the-counter (OTC) directly between global banks. It is not exchange-traded data.
* **The TradingView Proxy:** You can chart the *Interest Rate Differential* as a synthetic proxy for offshore dollar stress.
* **How to chart it:** In the ticker search bar, you can use TradingView's math functions. Type: `US03MY - DE03MY`
* *What this does:* It subtracts the German 3-Month yield from the U.S. 3-Month yield. If this spread blows out violently, it perfectly mirrors the offshore scramble for dollars that we track in the basis swap market.
Chart 6: Charting the EFP Premium (The Panic Indicator)
This is the most critical chart. It will show you exactly how much of a premium European desks are demanding over the New York paper price. When this line spikes, the short squeeze is mechanically accelerating.
Open a new chart in TradingView.
Click on the Symbol Search box in the top left corner.
Type the following exact formula into the search bar:
XAGUSD - SI1!
Press Enter.
What this does: * XAGUSD is the global London Spot Silver price (the physical reality).
SI1! is the continuous front-month COMEX Silver Futures contract (the paper price).
By typing the minus sign, TradingView automatically calculates the spread between them second-by-second.
How to read it: If this line is sitting near $0.02 to $0.05, the market is normal. If you see this line violently spike above $0.20, $0.50, or even $1.00+, it means the COMEX shorts are trapped and institutions are scrambling for physical delivery.
 Long
Long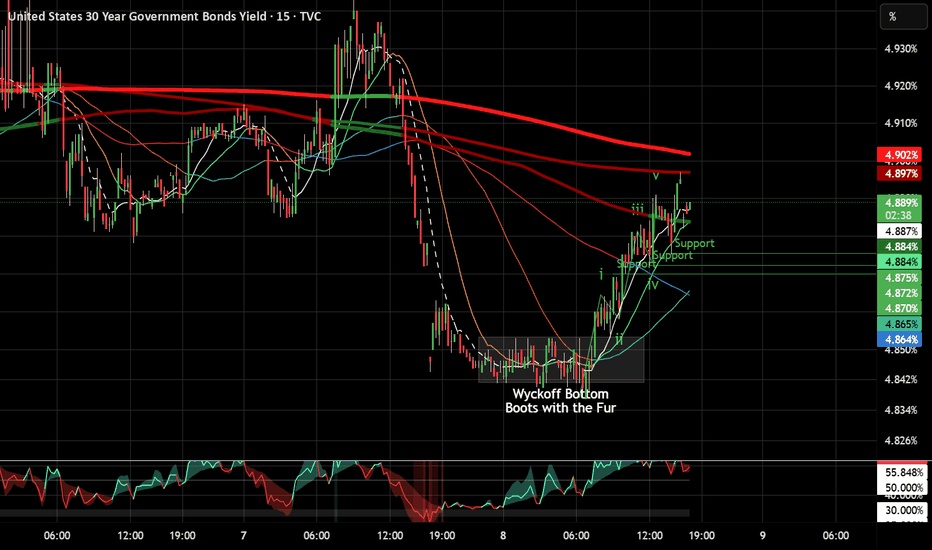
Bullish unless we close under 3.875%Not financial advice.
Comment if you please.
A new uptrend has been established in bond yields as we look back. The accumulation bottoming pattern is very textbook.
chartschool.stockcharts.com
“…all the fluctuations in the market and in all the various stocks should be studied as if they were the result of one man’s operations. Let us call him the Composite Man, who, in theory, sits behind the scenes and manipulates the stocks to your disadvantage if you do not understand the game as he plays it; and to your great profit if you do understand it.”
(The Richard D. Wyckoff Course in Stock Market Science and Technique, section 9, p. 1-2)
Based on his years of observations of the market activities of large operators, Wyckoff taught that:
The Composite Man carefully plans, executes, and concludes his campaigns.
The Composite Man attracts the public to buy a stock in which he has accumulated a sizeable line of shares by making many transactions involving many shares, in effect advertising his stock by creating the appearance of a “broad market.”
One must study individual stock charts with the purpose of judging the behavior of the stock and the motives of those large operators who dominate it.
With study and practice, one can acquire the ability to interpret the motives behind the action that a chart portrays. Wyckoff and his associates believed that if you could understand the market behavior of the Composite Man, you could identify many trading and investment opportunities early enough to profit from them. Long 
Long 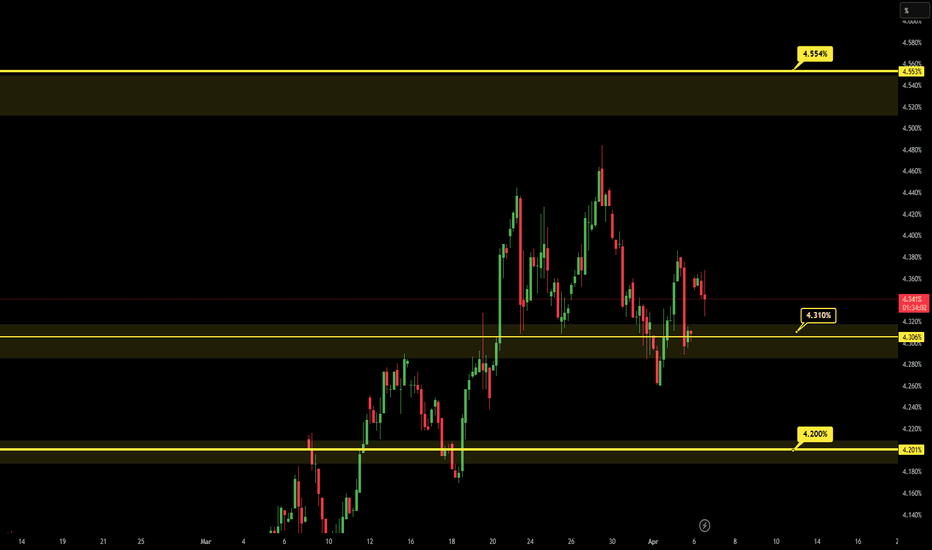
Long 
US 10Y TREASURY: Oil fuels yields The U.S. 10Y Treasury yield moved higher during the second half of the week, as rising oil prices intensified inflation concerns and reshaped macro expectations. Markets are increasingly pricing in a “higher-for-longer” interest rate environment, as persistent inflation could limit the scope for rate cuts. This shift has led to selling pressure on longer-dated bonds, pushing the 10Y yield upward and tightening financial conditions. Overall, the move reflects growing uncertainty around inflation dynamics and the future path of monetary policy.
Although 10Y yields started the week in a relaxation mood, dropping from 4,42% toward the 4,26%, still, they closed the week higher, at 4,34%. A higher volatility might continue, as a reflection of investors sentiment to developments with oil prices and potential implied inflation, and US macro data. The week ahead brings PCE and inflation data for March, which will most certainly be reflected in higher volatility of 10Y yields. Potential levels to watch is 4,4% for one more time to the upside and 4,3% to the downside.
Long 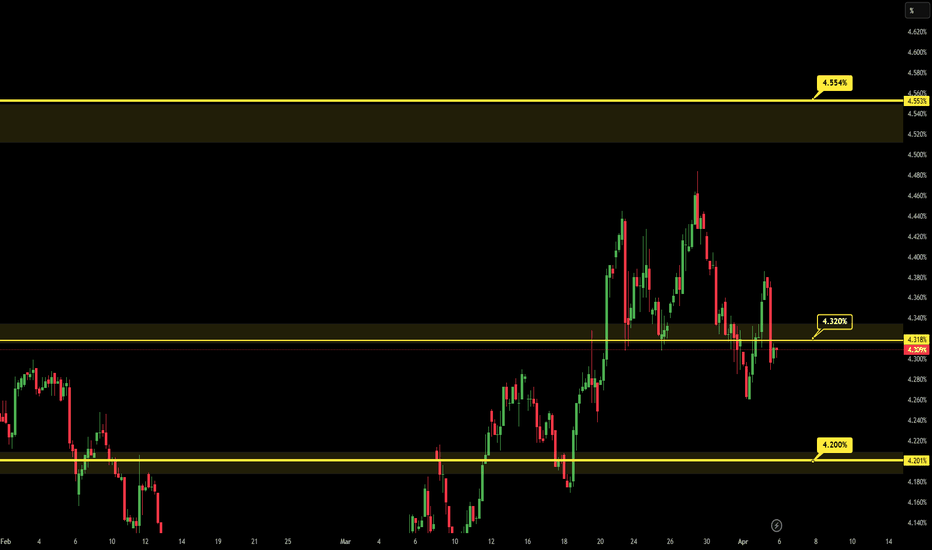
The technical signal to wait for before returning to buyingMilitary operations in the Middle East since Saturday, February 28 have disrupted the global economy and have had a strong impact on international financial markets. The surge in oil and gas prices generated by the closure of the Strait of Hormuz has triggered a sell-off in global equity markets, and few sectors have resisted except those linked to energy prices and defense.
The mechanism of bearish transmission from the geopolitical situation to global stock markets operates through the disruption of inflation expectations linked to the rise in oil prices in the markets. The resulting increase in market interest rates reflects the fact that institutional investors no longer anticipate any rate cuts from major central banks before the end of 2027.
Naturally, these expectations depend on the duration of the conflict and the time required before the resumption of energy transport through the Strait of Hormuz to the major economic powers of Asia.
The table below represents the CME FEDWATCH tool and shows that institutional investors do not expect any rate cuts from the Fed before the end of 2027, compared to June 2026 before the start of military operations on February 28.
In my recent articles published on TradingView, I have revisited the technical signals to monitor in the stock market before considering returning to buying risky assets, particularly in the US equity market.
The first asset whose technical signals must naturally be monitored is the price of oil. It is essential that it breaks technical support levels in order to reduce pressure on energy prices and on inflation expectations. But there is a second financial asset that I invite you to place under very, very close watch. It is the US 2-year Treasury yield, the market interest rate that best anticipates the future evolution of the US federal funds rate.
As long as the US 2-year yield remains above the current Fed interest rate (3.75%), caution is required, as this means that prospects for rate cuts are very distant. But if the “US 2-year” were to fall back below the Fed rate, i.e. below 3.75%, then this would signal that the next rate cut will take place in 2026, and this would then be a bullish factor for the equity market.
The chart below shows the daily Japanese candlesticks of the US 2-year Treasury yield.
DISCLAIMER:
This content is intended for individuals who are familiar with financial markets and instruments and is for information purposes only. The presented idea (including market commentary, market data and observations) is not a work product of any research department of Swissquote or its affiliates. This material is intended to highlight market action and does not constitute investment, legal or tax advice. If you are a retail investor or lack experience in trading complex financial products, it is advisable to seek professional advice from licensed advisor before making any financial decisions.
This content is not intended to manipulate the market or encourage any specific financial behavior.
Swissquote makes no representation or warranty as to the quality, completeness, accuracy, comprehensiveness or non-infringement of such content. The views expressed are those of the consultant and are provided for educational purposes only. Any information provided relating to a product or market should not be construed as recommending an investment strategy or transaction. Past performance is not a guarantee of future results.
Swissquote and its employees and representatives shall in no event be held liable for any damages or losses arising directly or indirectly from decisions made on the basis of this content.
The use of any third-party brands or trademarks is for information only and does not imply endorsement by Swissquote, or that the trademark owner has authorised Swissquote to promote its products or services.
Swissquote is the marketing brand for the activities of Swissquote Bank Ltd (Switzerland) regulated by FINMA, Swissquote Capital Markets Limited regulated by CySEC (Cyprus), Swissquote Bank Europe SA (Luxembourg) regulated by the CSSF, Swissquote Ltd (UK) regulated by the FCA, Swissquote Financial Services (Malta) Ltd regulated by the Malta Financial Services Authority, Swissquote MEA Ltd. (UAE) regulated by the Dubai Financial Services Authority, Swissquote Pte Ltd (Singapore) regulated by the Monetary Authority of Singapore, Swissquote Asia Limited (Hong Kong) licensed by the Hong Kong Securities and Futures Commission (SFC) and Swissquote South Africa (Pty) Ltd supervised by the FSCA.
Products and services of Swissquote are only intended for those permitted to receive them under local law.
All investments carry a degree of risk. The risk of loss in trading or holding financial instruments can be substantial. The value of financial instruments, including but not limited to stocks, bonds, cryptocurrencies, and other assets, can fluctuate both upwards and downwards. There is a significant risk of financial loss when buying, selling, holding, staking, or investing in these instruments. SQBE makes no recommendations regarding any specific investment, transaction, or the use of any particular investment strategy.
CFDs are complex instruments and come with a high risk of losing money rapidly due to leverage. The vast majority of retail client accounts suffer capital losses when trading in CFDs. You should consider whether you understand how CFDs work and whether you can afford to take the high risk of losing your money.
Digital Assets are unregulated in most countries and consumer protection rules may not apply. As highly volatile speculative investments, Digital Assets are not suitable for investors without a high-risk tolerance. Make sure you understand each Digital Asset before you trade.
Cryptocurrencies are not considered legal tender in some jurisdictions and are subject to regulatory uncertainties.
The use of Internet-based systems can involve high risks, including, but not limited to, fraud, cyber-attacks, network and communication failures, as well as identity theft and phishing attacks related to crypto-assets.
Technical Analysis Report: India 10-Year G-Sec Yield1. Trendline & Structure
The chart shows a long-term descending trendline acting as resistance since the late 1990s.
Current yield: ~6.96%, testing this resistance zone.
Moving averages (short, medium, long) are converging, suggesting a critical inflection point.
2. Momentum Indicators
RSI: Hovering near mid-levels, not overbought yet. A breakout could push RSI into bullish territory.
MACD: Histogram turning positive, signal lines converging → momentum building for a possible breakout.
3. Volume/OBV Context
Bond yields don’t trade like equities, but the speed of yield movement reflects institutional positioning.
Recent sharp uptick (+4.5%) suggests strong selling in bonds (yields rise when prices fall).
Market Impact Scenarios
✅ If Yield Breaks Above Trendline (Successful Breakout)
Implication: Long-term downtrend in yields ends → structural shift.
Equity Market Impact:
Higher yields = rising borrowing costs, pressure on valuations.
Banks may benefit (higher lending spreads), but rate-sensitive sectors (real estate, autos, NBFCs) will suffer.
Currency Impact:
Rupee may weaken as higher yields reflect inflation/fiscal stress.
Investor Sentiment:
FIIs could reduce equity exposure, preferring safer debt.
Nifty may face resistance, especially if global yields also rise.
❌ If Breakout Fails (Rejection at Trendline)
Implication: Trendline holds, yields capped below ~7%.
Equity Market Impact:
Relief rally in equities as borrowing costs remain contained.
Rate-sensitive sectors (real estate, autos, NBFCs) gain.
Currency Impact:
Rupee stabilizes, as bond market signals controlled inflation.
Investor Sentiment:
FIIs more comfortable with Indian equities.
Nifty could bottom out and push higher, supported by macro stability.
Summary
Breakout above trendline: Bearish for equities, bullish for yields → signals macro stress.
Failed breakout: Bullish for equities, supportive for Nifty bottoming → signals stability. US 10-Year Yield Analysis (as of Mar 31, 2026)US 10-Year Yield Analysis (as of Mar 31, 2026)
Quick Chart SnapshotWeekly (1W):
Yield is in a broad sideways range.
Key levels: Resistance: 4.32% (Weekly S&R) and 4.62% (Monthly S&R)
Support: 4.00% (Weekly S&R)
50ema acting as dynamic resistance near current levels (~4.32%).
4H:
Strong recent rally from March lows, riding a clear ascending trendline.
Price just hit the 4.32% horizontal resistance and the 50 EMA. A short-term pullback or consolidation is likely here.
Bullish Scenario (Higher Yields)
Yield breaks and holds above 4.32% (especially weekly close).
First target: 4.46% – 4.62%
Next major target: 4.70%+ (Monthly resistance)
Confirmation: Higher highs/lows on 4H + break of the orange MA.
Bearish Scenario (Lower Yields)Yield rejects 4.32% and falls back.
First target: 4.00% support zone.
Deeper drop: toward the ascending trendline or even lower if it breaks.
This would keep the broader range intact (4.00% – 4.62%).
Bottom line:
We’re at a key resistance level (4.32%) after a sharp 4H rally. Watch for rejection (bearish, lower yields) or clean breakout (bullish, higher yields). The reaction here will likely set the tone for the next few weeks.
Fundamental Catalyst for This Week (March 31 – April 3, 2026)The #1 event:
US March Non-Farm Payrolls (NFP) + Unemployment Rate on Friday, April 3 (8:30 AM ET).
This is the key labor market report of the week and the main driver for volatility in DXY and US 10Y yields.
Why It Matters Right NowMarkets are watching for signs of labor market strength/weakness after recent softer job data (e.g., February showed a decline).
Strong NFP (hotter-than-expected jobs + wages) → Higher bond yields (bearish for bonds, supportive for DXY) as it signals resilient economy + potential sticky inflation.
Weak NFP (soft jobs + rising unemployment) → Lower bond yields (bullish for bonds, bearish for DXY) as it raises hopes for easier Fed policy.
Other Supporting Data This WeekADP Private Payrolls (Wednesday) – acts as a preview to official NFP.
ISM Manufacturing & Services PMI (Wednesday/Friday) – gauge business activity and pricing pressures.
Retail Sales (Wednesday) – insight into consumer spending.
Markets are closed on Good Friday (April 3) for stocks/bonds, but the jobs report is still released.
Geopolitical Overlay (Ongoing Catalyst)
Higher oil prices due to Middle East tensions (Iran conflict) are adding stagflation fears — pushing yields up and complicating Fed decisions. Any de-escalation news could ease this pressure.Bottom line for your charts:
The reaction to Friday’s jobs data will likely decide whether DXY breaks above 100.22 (bullish USD) or rejects it, and whether 10Y yield clears 4.32% (higher yields) or pulls back to 4.00%. Watch ADP mid-week for early clues. Expect elevated volatility around these releases.
US 10-Year Treasury Yield: Why 4,10 Level is Critical?US 10-Year Treasury Yield: As Long as It Stays Above 4.10, Markets Cannot Breathe Easy
What Is a Bond Yield?
The government issues bonds, investors buy them, and in return the government pays interest. The ratio of that interest payment to the bond's price is called the "yield." As yields rise, the government's borrowing cost increases — and that cost spreads across all markets.
How Do Rising Yields Affect Other Assets?
When bond yields rise, a "risk-free" investment becomes more attractive. At that point, the investor asks a simple question: "Why would I take on risk?" Gold offers zero yield, Bitcoin is volatile, equities are uncertain. But a bond promises a guaranteed return. So money flows out of gold, Bitcoin, and stocks — and into bonds. The result: all three assets come under pressure.
What Does the Chart Say?
Looking at the short-term chart, the US10Y is trading inside the rising channel that has been in place since 2020. The current level of 4.34% sits above the Fibonacci 0.236 zone at 3.988% — a level that serves as both a technical and psychological pivot. The pink band marking this area has been tested multiple times and has held as support on each occasion.
Switching to the long-term chart, the picture becomes far more striking. From the 1980s all the way to 2020, yields fell for 40 consecutive years. Then this massive trend broke, and yields entered a rising channel. The current level of 4.34% represents only the 0.236 Fibonacci retracement of that entire 40-year decline — meaning we are still historically low. There is significant technical room ahead for yields to move higher.
RSI sits at 56.74, above the signal line and pointing upward — momentum is on the side of yields. As long as the 4.10 support holds, the pressure on risk assets may continue. Real relief for gold, Bitcoin, and equities can only begin once yields drop decisively below this zone. Long 
US 10Y TREASURY: Signaling rising risksLong term Treasury yields are not sending a good signal with respect to the US economy at this moment. The 10Y Treasury yields climbed toward 4.48% on Friday, driven by rising inflation expectations amid surging oil prices and escalating geopolitical tensions. Markets are also repricing the Federal Reserve path toward higher-for-longer rates, while weaker demand for Treasuries adds further upward pressure on yields. During the week there have also been a few notes from Federal Governors, noting a possibility for interest rates to be even increased if inflation starts its uptrend again. This is exactly what markets don't need to hear at this moment.
The current macro and geopolitical situation will continue to shape investors sentiment with its consequences on the US Treasury markets. Friday also brings March NFP and Unemployment data, which promise to be another volatile day. Some just a short relaxation in 10Y yields is possible at the start of the week, however, nothing significant should be expected at this moment. On the opposite side, based on charts, there is a possibility of testing the 4,5% level. Higher levels are also possible, which will depend on further developments with the price of oil and Middle East conflict.
 Long
Long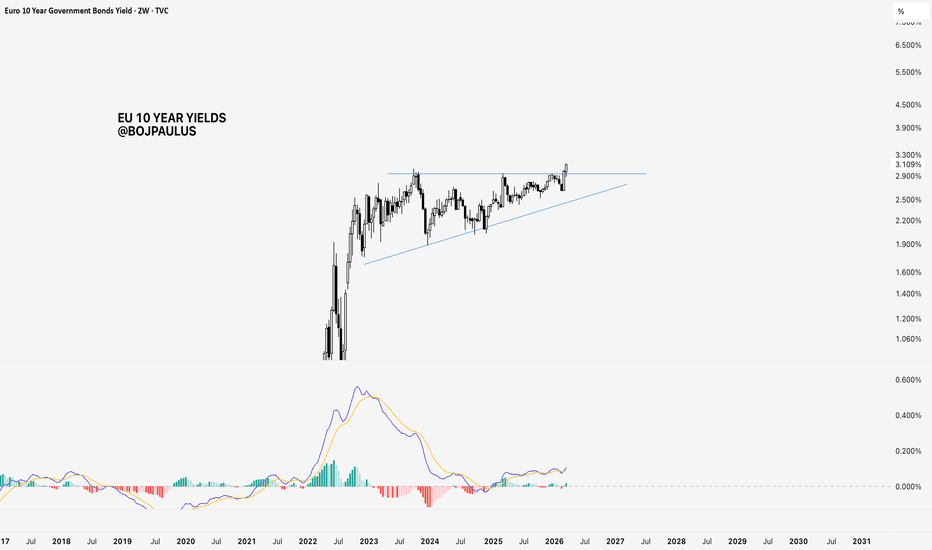
Long 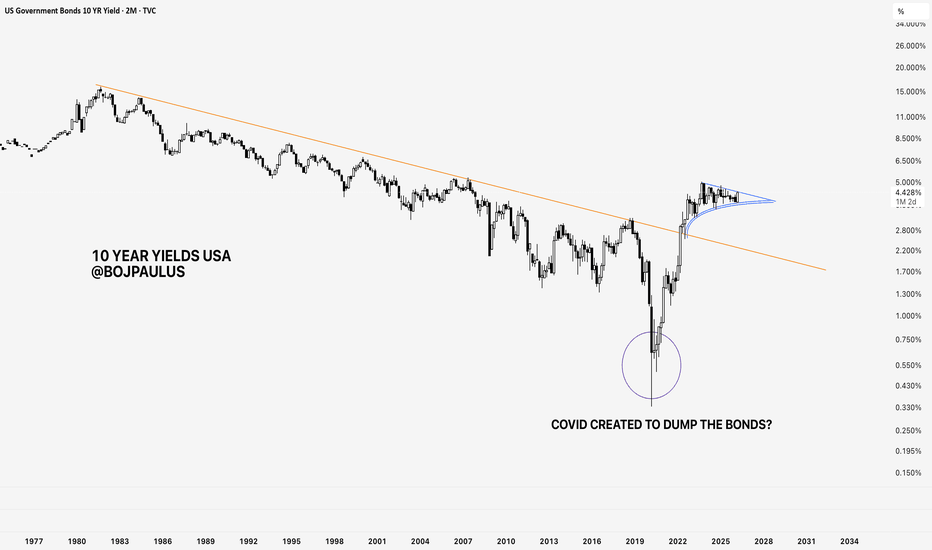
Price at 99.6% CeilingJP10Y is a yield instrument — no volume data is provided by the data vendor and no futures market exists on this feed. Every cell in the volume panel reads n/a. The signal stack is reading pure price structure and timeframe alignment only. There is no volume intelligence to confirm or contradict what the signal board shows, and that limitation must frame the entire read.
42 of 112 signals green, 7 red. Extreme BULL at 83.33% conviction, 11x. EMA 14 green zero red — full sweep across all timeframes. Candle 7 green zero red. Ichi TK 13 green 1 red. C>T 7 green 6 red — trend alignment not fully confirmed, nearly split. SS/DD 13 to 1 bull — the strongest supply and demand reading in today's scan. Engulf 1 green zero red. No squeeze active. Momentum Bull up with bandwidth 12.83% Normal — tight, energy not released. No cascade. Retrace -0.2% Extreme BO, bounce 16.2% at 96.6x Para — extreme ratio on a yield instrument reflecting the compressed tick movement. 5-Bar Move 5.1%.
No volume data across any metric. Vol Z, Fut Z, Vol S, VolZ 1:5, Bull:Bear Z, OBV Z all read n/a or zero. Spot momentum flat at 0%. No whale, no liquidation, no squeeze data. The entire volume intelligence layer is absent. What remains is structure only.
No leverage, no percentile. Price percentile at 99.6% Ceiling — the Japan 10-year yield is sitting at the very top of its annual range. Hi/Lo 2.383 to 1.38. Current reading of 2.379 is one basis point below the annual high. The yield has nearly doubled from its range low of 1.38, reflecting the BOJ policy normalization cycle and persistent inflation pressure.
OBV Z at zero flat is the key read — there is nothing to read. Volume data is unavailable for this instrument on TradingView's feed. The signal stack of 42 green with full EMA sweep and SS/DD at 13 to 1 bull is the entire analytical basis here.
The honest read: JP10Y at 2.379% with a full EMA bull sweep and SS/DD at 13 to 1 tells you the structural momentum in Japanese yields is unambiguously higher — but without a single volume data point, the conviction level of that read is structural only. In the context of today's broader scan — DOW breaking down, USO at ceiling, VIX coiling — a Japan 10-year yield pushing against annual highs adds a macro layer: rising JGB yields historically tighten global liquidity as yen carry trades unwind. At 99.6% of range with no volume to confirm exhaustion or continuation, this is a watch instrument, not a trade instrument. The structural signal says yields continue higher. The macro implication for risk assets is bearish.
Is That Crypto Pump Real? Data Says No. Here's Why.
Stop Losing Money to Fake Volume. Find Real Moves Now.
Trade the REAL Crypto Volume. Stop Getting Faked Out.  Long
Long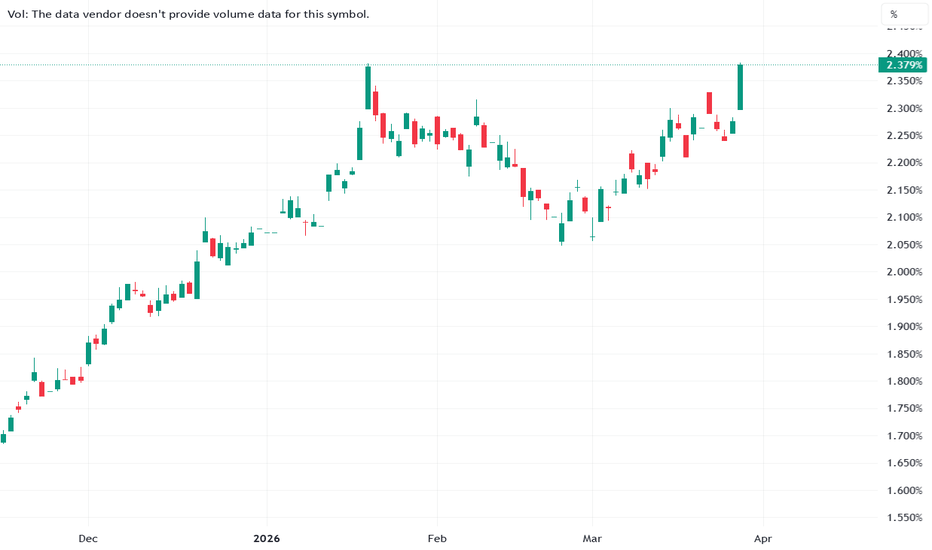
 Long
Long
Long 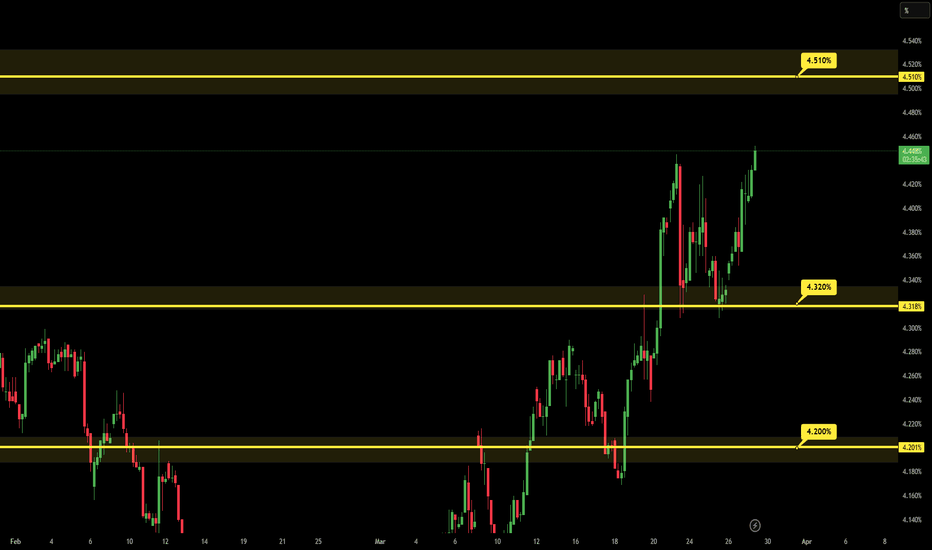
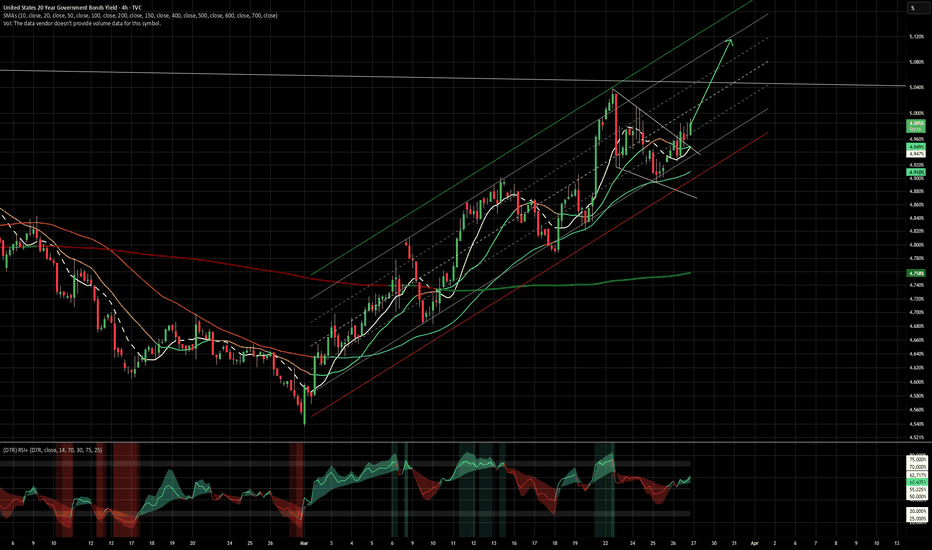
End the FedEither tomorrow (Friday) or Early next week, the bond sell-off will continue and yields will press back above 5%.
Extremely difficult for the equity markets or crypto to gain any footing while this is happening.
Yields going up like this tightens the money supply (credit).
Stocks will not find a bottom until the top in yields has been reached. I have no idea where the top will be. What I can tell you is it is not dependent on Oil anymore. That started this fiasco, but the coals in the fire were already hot before oil became a problem. There are many other issues under the surface in our credit system. It is the U.S. bond market that is the problem. We are in the death spiral now of debt.
You are about to enter the Great Depression of the 21st Century.
Congratulations.
(Whistling past the graveyard....)
...Everyone thinks the Fed will come save them.
The Fed, doesn't save anyone. Not people anyways.
They save banks. Because they were made by banks. For banks.
The Fed's job is to keep you working.
Work, work, work, little work slaves, you work so hard, but your life doesn't get any easier. All this new technology, but your lives are harder than ever, hmm...that seems strange.
It's so...strange isn't it. That no matter what we create or advance. No matter how fast of machines we make to help us, or jets to fly us around the world, amazing technology, a naturally deflationary force, keeps progressing and growing, all you get is more work. If you're lucky. Why is that? In fact, it seems like it's been that way for nearly a century. Technology has progressed so quickly that you can't even fathom what 100 years ago was really like.
If technology increases productive output, then why haven't your lives gotten better. Where has all this increased production gone? It's all so strange... Surely with all the computers and machines and solar power and nuclear physics, we can make medicines you couldn't fantasize about 30 years ago to treat the thing that we poisoned you with. Weird.
So where did all your labor go? Your production?
Certainly not to you.
Does your boss have it all?
Probably not.
Maybe the tax man has it... wait... he's in debt.
Oh, actually, my apologies, YOU are in debt.
Because it's your labor after all. Your production.
The tax man just spends it.
Inflation is where it goes.
But the Fed will save you.
Sure.
Right after they crash the entire monetary system on top of your head like a bathroom sink.
Then they'll save you. They'll say, "We're sorry all your hard work amounted to nothing. But don't worry. We believe you can still keep going even with nothing. So here, take this barcode, we'll deposit 1,000 U.S.coins in your account each month. Because we care about you.
We're not the face sucking alien monster syphoning the blood right out of you. We're not the organization that was formed in a secret meeting of elite bankers on an island where no one could listen in on our plans to establish control of you. No.... that would be weird.... The tv told you didn't it? You can't say things like that. You'll upset the other slaves.
You've got to think like everyone else, remember? Now go back to work, and watch your tv, and play your games, and let us worry about the direction of your country and your leaders. Here...we'll make it easy for you. We'll help fund a 2-party system so you just pick heads or tails. Then go back to work, and let us direct them. The catch is it doesn't matter who you pick! Isn't that great? Oh, but you stress about it each time don't you. Such a hard choice. Getting punched in the mouth or the gut.
We've been doing such a great job, haven't we?
We do it all for you. We definitely don't steal your production and create inflation only to enrich ourselves. No... you see it's just, necessary, this inflation well.. because it encourages investment! That's it! Yeah.. I mean who would buy a stock if there wasn't inflation? Or a new tv? Or game?
Why, if there wasn't inflation you might all want to save your money, or you might not be such a hard worker! If we didn't have inflation, my goodness, your house wouldn't be a nice little nest egg that you can't leave and that young people can't afford. All the house prices might just stay the same or even go down as materials become easier to produce with all this technology. We wouldn't want that.
So don't worry. Andrew Jackson was a terrible person after all. A wicked, cruel, awful man. Did you hear of all his crimes? Lol. Good. Yes, no other president of these United States has ever done something so terrible. Surely not. And surely there was no rational reason for what he did at the time. He didn't have any noteworthy ideas after all. He was just a murderous villain surely. So don't read about him. It would be a waste of your time to learn more about him.
Because he was not a good slave.
But, You, are my favorite. Long