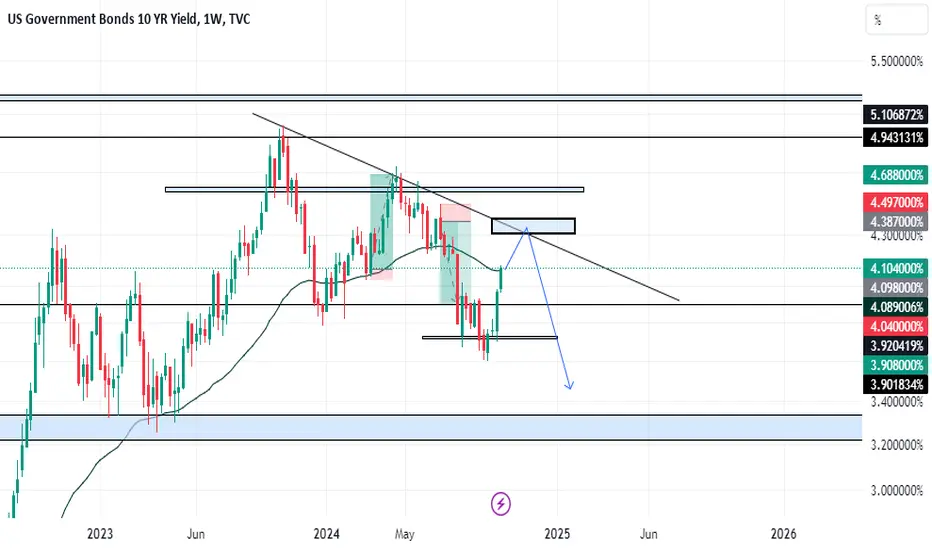
US 10Y TREASURY: driven by inflationThe inflation data were the ones that the market was watching closely during the previous week. The September inflation came just a bit higher from the market estimate. While core inflation remained elevated at 0,3% for the month and 3,3% for the year, the inflation figures were standing at 0,2% in September and 2,4% for the year. As inflation is holding modestly above Feds target of 2,0%, the markets are anticipating the next Feds move. Whether they will cut in November or maybe, the next cut w
Government bonds
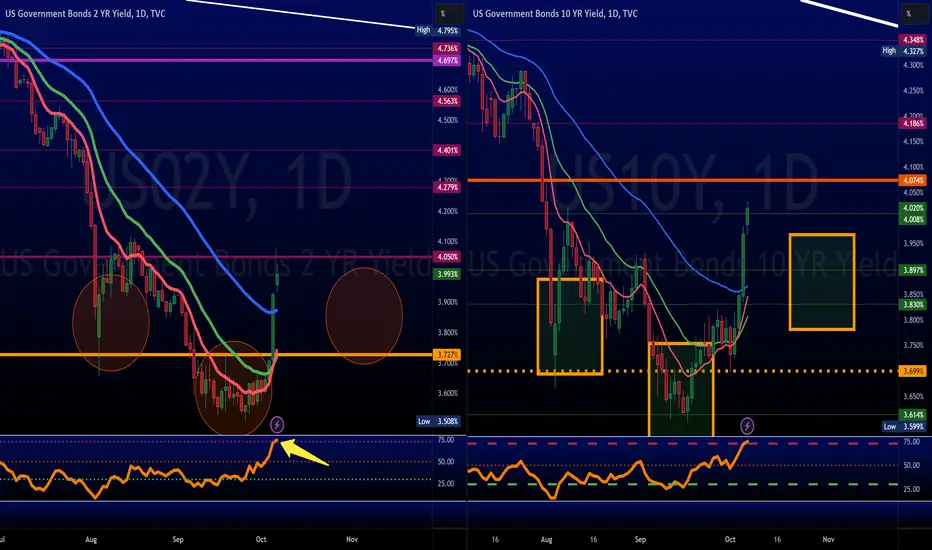
Bullish rates reversal signals US dollar downside riskIf you want clues on directional risks for the US dollar, there are worse places to look than US 2-year Treasury note futures, shown in the left-hand pane of the chart. As one of the most liquid futures contracts globally, the price signals it provides can be very informative for broader markets, especially in the FX universe.
Having tumbled most of October, implying higher US yields given the inverse relationship between the two, the price action this week looks potentially important. We saw
$TNX The little Yield that could. You think the Great Yield slaughter of the 40 years was something; just feast your eyes on the great Yield breakout, eons in the making.
In our next predicted cycle of disastrous economic, but not all that surprising or unexpected economic events; we will now see the Great Bond Slaughter coupled with treasury yields sky high. An event the likes of which the world has never seen.
As you can see the TVC:TNX is flagging on all high time frame charts and has several upper targets to reach befo
US 10Y Yields - Low Resistance Liquidity Run4 consecutive days of bullish price action with the potential to draw further up inside of the Feb 24 new week opening gap.
Short-term retracement is expected during conditions similar to now and would like to gee the NWOG for this week (still in a premium) filled with the last point of no return being a daily candle body closure below 3.946%
Very close to Yield Curve Inversion, AGAINAfter #InterestRates were cut people were expecting a furious wave of buying, this has not come into fruition.
Recent events:
2Yr Yield rallied substantially.
10Yr #Yield bottomed when we called it, has not run as much as it's shorter term counterpart.
We're close to inversion again!
Colored areas = POTENTIAL Inverse Head & Shoulder = BOTTOM.
Worth noting, TVC:TNX has a higher right shoulder.
Further analysis:
We are seeing a Negative Divergence on $DJI.
Volume has been lessening as the da
10Y bonds seeking support from April-July channelFrom April to July the 10 year Treasury yield was in a downward channel. It broke below that, retested the resistance-now-support for bonds, and kept moving until it recently re-entered.
The fundamentals for long bonds still seem strong, with the cutting cycle starting with an abrupt 50bp cut, but bonds seem to be seeking support. If yields break above this channel, then we may be seeing something unexpected sniffed out by the bond market. If we retest and continue the downtrend in yields, then
10Y is back in the April-July channel, testing supportFrom April to July the 10 year Treasury yield was in a downward channel. It broke below that, retested the resistance-now-support for bonds, and kept moving until it recently re-entered.
The fundamentals for long bonds still seem strong, with the cutting cycle starting with an abrupt 50bp cut, but bonds seem to be seeking support. If yields break above this channel, then we may be seeing something unexpected sniffed out by the bond market. If we retest and continue the downtrend in yields, then
Bond Yield Short (a.k.a Long Bonds): End of Corrective A-B-CThis is a call for Bonds yields to stop rising and to start falling. What this means is that treasuries will go up. I expect this fall in yield to be strong and accompanied by a fall in stock market.
Stop is shown on the chart. This is a rather aggressive stop.
Another great opportunity to work with U.S. T-BondsAnother great opportunity to work with U.S. government debt in the short term.
We have all noticed that after the 50 basis point rate cut by the Federal Reserve, the reaction of the fixed income markets was mixed. Geopolitical and domestic issues did not allow institutional investors to act freely, leading to a reverse effect.
Currently, another 50 basis point cut is expected, and the treasury curve is in a flattening phase. Yields have risen again.
This is exactly what we call a great opport
US 10Y TREASURY: surprised by jobs dataThe major macro news during the previous week were posted nonfarm and unemployment figures in the US for September. The nonfarm payrolls significantly beated market expectation, by reaching the figure of 254K, while unemployment rate dropped to the level of 4,1% from 4,2% during August. The markets are now convinced that the Fed will slow down rate cuts till the end of this year to 25 bps, considering the high resilience of the US economy. Previously, markets were pricing another 50bps cuts. The
2yr Yields Bounce in Downtrend 2year Yield hovering right around the declining 50d after bouncing from the 3.50% level amidst a major momentum divergence. Giving the broader technical picture, would still lean towards this being a countertrend bounce within the structural downtrend. Could this be a set up to buy back into Bonds?
Predictive Correlation the SG10Y Bond Yields on S&P500I have posted about this correlation previously. Perhaps this time it might be clearer to see...
This uncanny correlation between the SG10Y Govt Bond Yields as a leading indicator for the S&P500 was noticed some time ago, and tested since.
As shown, the major turning points were seen in trend changes of the SG10Y GBonds first, before the S&P500 reacted. The vertical time markings show when you would short or long depending on the trend breakouts of the SG10Y GBonds (see lower panel, blue line)
10Y - 02Y outlookMy recent assessments have been negated.
I am mostly skewed to the idea it will break negative again, correlating to sentiment fuel for the blow off top in the SPX (no recession sentiment short term?).
Once it flips negative again, to back test the purple bull penant, I strongly expect that to correlate to the markets topping and will potentially exit if I see further confirmation across other instruments.
Reason for exiting prior to it flipping positive again if it goes negative, is becaus
DRUCKENMILLER TIPS: Shorting Bonds and MoreInvestment Strategy
Stanley Druckenmiller, a renowned investor, shared his market insights at Grant's Annual Fall Conference. He revealed that he is shorting U.S. government bonds, representing 15% to 20% of his portfolio. While he is unsure when these bets will materialize, his strategy is based on the perception that inflation could return to levels similar to those of the 1970s.
Disinterest in China
Druckenmiller also expressed disinterest in investments in China under Xi Jinping's leader
US 10Y TREASURY: pricing the PCE easingThe inflation measured through the Personal Consumption Expenditure Index showed signs of further decrease in August. The Index was standing at the level of 2,2% on a yearly basis, which was a bit lower from market expectations. The US Treasury yields eased after the release of data, bringing the 10Y US benchmark to the level of 3,75% as of the end of the week. During the first half of the week, the 10Y yields were exploring higher grounds, reaching the highest weekly level at 3,82%. At the same
US02Y/US10Y Uninversion & RecessionsThe dynamics of the US Treasury yield curve, particularly the spread between the 2-year and 10-year yields (US02Y/US10Y), have long been studied as potential indicators of economic health. One phenomenon that garners significant attention is the inversion and subsequent uninversion of this yield curve. Lets delve into what these terms mean, their historical significance concerning recessions, and how investors might interpret these signals.
What is the Yield Curve?
The yield curve is a graph