Short
Short
 Short
Short
Short 
Short 
Short 
Short 
Short 
 Long
Long
 Long
Long
US 10Y Yield #1: Four Markets Since the August 2021 Yield LowThe chart
I put the US 10 year Treasury yield on the same chart with the dollar index, gold, the S&P 500 and bitcoin. I set the chart to percent, starting from the August 2021 low in the US 10 year Treasury yield, so every market is rebased to that same date and every line shows how far each market has come from it.
The channel
On the US 10 year Treasury yield I fitted a regression channel from the October 2023 high, and the number on the chart is Pearson's R, 0.13. That number is low and the channel is close to flat, so over these last three years the US 10 year Treasury yield has gone sideways at a high level rather than trended, and now sits near the channel upper band.
The four markets
Gold was around 1,800 in August 2021 and is around 4,400 today.
The S&P 500 was around 4,400 in August 2021 and is around 7,800 today.
Bitcoin was around 40,000 in August 2021 and is around 63,000 today.
The dollar index was around 92 in August 2021 and is around 100 today, and the dollar index is the line that moved least on this chart.
What the chart shows
The usual reading is that a high US 10 year Treasury yield holds risk assets back, because money earns more sitting in Treasuries. The US 10 year Treasury yield has stayed high since the October 2023 high, and over that same stretch gold and the S&P 500 both went to new highs. The dollar index barely moved over those years, so a falling dollar index does not explain the rise in gold and the S&P 500 either.
What I watch
What I watch are both bands of the channel. The US 10 year Treasury yield now sits near the channel upper band, and the US 10 year Treasury yield has kept the shape of this channel since the October 2023 high, so what I watch is not a single day at a band but whether the US 10 year Treasury yield settles outside the channel. If the US 10 year Treasury yield settles outside either band, what I would look at then is whether the four markets keep moving the way this chart shows. US Yields: Inflation Signals vs Technical Structure 2Yr 10YrWith incoming inflation prints coming in cooler than expected, macro narratives suggest yields should drop. However, the charts tell a much more nuanced story across timeframes. Let’s break down what the technical is actually signaling on the 2 and 10 Year yield.
Bullish Juice
1. RSI Trendline Breakouts
Across both the daily and weekly timeframes, RSI has decisively broken out of its long-term downtrend lines and reset into the key 50–58 equilibrium zone.
Rather than crashing below the 50 mid line (which would signal downside momentum), the indicators digested previous overbought levels through time rather than deep price decay. This is a classic trend continuation signature.
2. Multi Year Moving Average Alignment
The short and medium term EMAs (Red/Green) remain stacked above long term dynamic support (Blue) across both curves.
Daily Support (NOT SHOWN): Since March, the daily Red EMA line has repeatedly held as dynamic support for the 2Yr, proving buyers continue to defend pullbacks despite soft macro headline data.
3. Structural Break & Retest on the 10Y
The 10 Yr executed a clean breakout above its multi year descending trendline/pennant resistance and is currently in the process of a structural retest. Former overhead supply is attempting to flip into major structural demand.
The Divergence:
10Yr Yield reentering the pennant formation would be highly unusual and represent a major technical failure/fakeout. As long as a retest of support holds, the structural path of least resistance points upward toward the macro $5.17 supply ceiling.
2Yr Yield is highly sensitive to short term rate expectations. Given the cooler inflation narrative, the 2Y can easily pull back deeper into its multi-year bull flag structure without destroying the macro thesis. A retest on a support horizontal pivot remains a plausible scenario while still keeping the larger consolidation pattern intact.
Summary: Keep a close eye on Monthly candle closes. Daily/weekly breakouts are showing appetite, but until we see a decisive monthly close above the macro 5.13 / 5.17 ceilings, expect choppy retests inside these higher timeframe flags.
TGtg!
What's your take? Is the 10Y retest going to hold, or does soft macro data force a deeper pullback on the 2Y first? Drop your thoughts below! US 10-Year Yield: The Number That Controls EverythingLook at this for a second: one number moves by just 0.10%, and six different parts of the global economy react almost instantly: stocks sell off, borrowing costs rise, mortgage rates go up, the dollar strengthens, gold comes under pressure, and money starts leaving emerging markets. That's not an exaggeration. That's literally what happens, over and over, every time this number moves.
Most traders never look at this number properly. They watch their favorite stock, check the news, maybe glance at Fed headlines, but the real engine behind most of these moves is sitting quietly in the bond market. Let's break it down, one piece at a time.
First, what is the 10-Year Yield?
The US government borrows money by selling bonds. When you buy a 10-Year Treasury bond, you're lending the government money for 10 years, and they pay you interest for it. That interest rate is the yield.
The one thing beginners always get confused about: bond prices and yields move opposite to each other. If people are buying bonds, prices go up and yields go down. If people are selling bonds, prices go down and yields go up. So when yields rise, it usually means investors are selling either because they want a better return, or they're worried about inflation eating into their money over time.
This yield is called the risk-free rate because lending to the US government is about as safe as investing gets. Almost everything else in finance gets compared against it that's why this number carries so much weight.
1. Stock markets sell off
When big investors work out what a stock is really worth, they estimate the company's future profits and bring that value back to today's terms using a discount rate. The 10-Year Yield sits right inside that discount rate.
When yields rise, future profits are worth less in today's dollars, so stock prices tend to drop. This hits growth and tech stocks the hardest, since their value is based heavily on profits still years away.
Next time the 10-Year Yield spikes, watch how fast Nasdaq futures turn red, often before any actual news even comes out.
2. Borrowing costs rise for everyone
Companies borrow money to grow, hire people, and buy back their own shares. The rate they pay is basically the 10-Year Yield plus a bit extra depending on how risky the company is seen to be. When yields rise, borrowing gets more expensive across the board, even for financially strong companies. That means fewer stock buybacks, slower expansion, and real pressure on companies already carrying a lot of debt.
3. Mortgages and loans get more expensive
This is the one that hits regular people directly. Mortgage rates mostly track the 10-Year Yield, plus a margin added by lenders, not the Fed's rate decisions, as most people assume. If the 10-Year Yield jumps from 4.00% to 4.50%, mortgage rates usually move up close to the same amount. On a $400,000 home loan, that can add over $100 to your monthly payment. Multiply that across millions of buyers and the whole housing market slows down.
4. The US dollar strengthens
Money around the world is always looking for the best safe return. When the 10-Year Yield rises, US bonds become more attractive compared to bonds from other countries, so money flows into the dollar and it strengthens.
A stronger dollar creates its own chain reaction: US exports get more expensive for other countries to buy, debt gets more expensive for anyone who borrowed in dollars, and dollar-priced commodities like oil often get cheaper.
5. Gold and commodities come under pressure
Gold doesn't pay any interest it just sits there. So its appeal depends on what you're giving up by holding gold instead of something that pays you, like a Treasury bond. When yields rise, especially after adjusting for inflation, gold usually becomes less attractive and can fall.
When yields fall, especially while inflation stays high, gold tends to look more attractive and often rises.
6. Emerging markets see capital outflows
Countries like Brazil, Turkey, India, and Indonesia depend heavily on foreign money flowing into their stock and bond markets. When the 10-Year Yield rises, that "safe" American return looks more attractive, so foreign investors pull money out of these markets and move it back into US bonds.
This is called capital flight. A real example: 2013's "Taper Tantrum" when the Fed just hinted at slowing bond purchases, the 10-Year Yield jumped from around 1.6% to nearly 3% in a few months, and emerging market currencies fell sharply within weeks.
What happens when yields jump in a single day
Tech and growth stocks sell off within minutes as future profits get discounted more
Borrowing costs rise for companies trying to raise money
Mortgage quotes get adjusted higher, cooling down home buying
The dollar strengthens as money flows toward better US returns
Gold usually dips
Money starts flowing out of emerging markets back into the US
None of this needs a war, a crisis, or even a Fed meeting to happen. A single inflation report or a weak bond auction can set the whole thing off in one trading session.
A real-world example: banks feeling the pain
Banks hold large amounts of government bonds because they're considered safe. But when yields rise fast, the bonds a bank is already holding, bought back when yields were lower, lose value.
This is exactly what happened with Silicon Valley Bank in March 2023 . SVB had parked a big chunk of customer deposits into long-term bonds when yields were near zero. As yields climbed, those bonds lost value. When depositors got nervous and pulled their money out, the bank had to sell those bonds at a big loss, and it collapsed within days.
How to actually use this as a trader
Keep the 10-Year Yield chart open next to the Dollar Index, S&P 500, and Nasdaq to see the relationship in real time
Watch CPI reports, jobs data, and Treasury bond auctions; these move yields the most
Watch the gap between the 2-Year and 10-Year yield; when the 2-Year goes above the 10-Year, it's called an inversion, historically a strong recession warning sign
Don't trade off the yield alone; use it to confirm what your chart already shows
Remember: the real yield (10-Year Yield minus inflation expectations) matters most for gold, not just the raw number
My thought
Most traders spend all their time staring at one stock's chart and never realize the real force moving the market is sitting quietly in the background. The 10-Year Yield isn't just a bond thing. It touches stocks, borrowing costs, mortgages, the dollar, gold, and entire economies at the same time. Next time you see it move even a small amount, don't scroll past it. That tiny number is quietly moving trillions of dollars, and now you know exactly how.
Thank you,
@VertexQore
Education 
Short 
US10Y- The Most Important Chart Is Sending a Warning for StocksThe most important chart in the market right now is the US 10-Year Treasury Yield.
And the chart looks BULLISH. Extremely BULLISH. Which is a problem. A BIG problem for stocks, especially growth stocks and the Nasdaq in particular.
The US10Y yield is the market’s benchmark risk-free rate, representing the return investors can earn by lending money to the US government for 10 years. Because almost every asset is priced relative to this rate, a rise in the 10-Year yield increases the discount rate investors use to value future cash flows, putting pressure on equity valuations especially growth stocks, with the Nasdaq being particularly sensitive to changes in yields.
The situation today is starting to resemble the oil shocks of the 1970s, October 1973 and January 1979 in one key way, oil prices aren't just spiking and then quickly reversing, as they did after Russia's invasion of Ukraine in 2022. Instead, they're staying elevated.
The seventies were different. Prices quadrupled in 1973 and tripled again in 1979, There was no reversion. That's what turned an energy shock into an inflation era.
That's the pattern forming now: oil price is elevated for almost six months, with no resolution in sight. To be clear, I'm not calling for prices to quadruple like in the seventies, the point is the dynamics, not the magnitude.
When an oil spike lasts only a few weeks, the Fed can look through it as a temporary shock. But when elevated prices persist for months, the market starts treating it differently, oil is no longer a short-term disruption, but a lasting factor that can keep inflation higher and influence the Fed's rate decisions. Once that happens, it feeds into core inflation expectations, into the rate path, and into yields. The bond market is starting to price exactly that shift.
US10Y Technical Analysis-
The 10-Year Treasury Yield has been consolidating inside a symmetrical triangle since October 2023.
In May, yields attempted to break above the upper trendline, but the breakout failed to hold. At the beginning of July, yields made another breakout attempt — this time consolidating around the breakout level for two weeks before continuing higher. This move now looks like a much more confirmed breakout.
The official breakout point of this pattern is the second high of the triangle structure, marked by the green horizontal ray at 4.805%.
Using the HVF method to calculate the potential breakout targets, the measured moves point to Target 1 at 5.33% and Target 2 at 6.079%.
The last time the US10Y broke above a long-term symmetrical triangle was on January 6, 2022. Here is the chart:
Interestingly, this date marked the beginning of the collapse for NASDAQ that led to the 2022 bear market:
The current US10Y breakout and Nasdaq setup are starting to look very similar to what we saw in early 2022...
US 10Y Treasury Yield | Weekly Structural Analysis | 02-AUG-2026Compared with the previous weekly assessment (Week 26), the broader structural framework remains largely unchanged. During the past five weeks, the US 10Y Treasury Yield has continued evolving within its established structural zones, with the most notable development occurring through improving recovery participation rather than structural transition.
The yield continues to operate within a Range Structure, while Recovery Participation remains the dominant market behaviour. Current price action is developing above the Structural Pivot within the Behavioural Pivot Zone, reflecting improving participation while remaining inside the broader range framework.
The Behavioural Pivot Zone now represents the primary structural reference. Continued acceptance around this area will determine whether recovery strengthens or the market returns toward the Structural Pivot.
Structural Position
• Structure: Range Structure
• Structural Phase: Recovery
• Behaviour: Recovery Participation
The broader range structure remains intact. Recovery Participation reflects improving market behaviour within that range rather than confirmation of a new structural advance.
Market Context
The US 10Y Treasury Yield is currently trading above the Structural Pivot within the Behavioural Pivot Zone, where recovery participation continues to develop. This suggests improving participation while maintaining the existing higher-timeframe range structure.
Current observations continue to favour monitoring Participation, Acceptance and Behaviour rather than anticipating directional outcomes.
Structural Triggers
Continuation
Acceptance above the Behavioural Pivot Zone would strengthen the developing recovery and improve the broader structural outlook.
Review
Acceptance below the Structural Pivot Zone would require a review of the current structural assessment.
Key Structural Observations
• Recovery Participation continues to develop above the Structural Pivot.
• Behavioural Pivot remains the primary structural reference.
• Recovery is strengthening within the existing range structure.
• The broader structural framework has remained stable since the previous weekly assessment.
Educational Perspective
The period between Week 26 and Week 31 demonstrates that recovery can continue developing without changing the broader market structure.
For the US 10Y Treasury Yield:
Structure remains a Range Structure.
Participation continues to develop within the Behavioural Pivot Zone.
Behaviour reflects ongoing Recovery Participation.
Recognising the distinction between Structure, Participation, and Behaviour helps separate improving participation from confirmed structural transition.
Structure → Level → Trigger → Probability
Disclaimer
This publication is an educational structural market study. It is not investment advice, trading advice, or a prediction of future market direction. The analysis focuses on market structure, participation, and behaviour within a higher-timeframe framework.
#US10Y
#BondMarket
#TreasuryYield
#MacroMarkets Long 
Why I Watch the 30-Year U.S. Treasury Yield Before the S&P 500Many investors spend their days analyzing stocks but overlook a chart that influences virtually every market: the 30-Year U.S. Treasury yield (TVC:US30Y on TradingView).
In my view, it is one of the best barometers of the long-term cost of capital.
When yields rise, companies face higher financing costs, valuations become more demanding, and growth-sensitive sectors such as technology, real estate, and utilities are generally the first to come under pressure. Conversely, a lasting decline in yields often supports risk assets.
THE INDICATORS I USE ON TRADINGVIEW
📈 SMA 200
This is my primary indicator.
• Yield above the 200-day SMA: yields are in an uptrend.
• A rising 200-day SMA: structural pressure remains on bond prices.
• The further the yield moves above its 200-day SMA, the greater the risk of a pullback or consolidation.
☁️ Ichimoku
I mainly monitor:
• the yield’s position relative to the cloud;
• the slope of the Kijun-sen;
• the slope of the leading cloud, especially Senkou Span A;
• the Chikou Span.
A yield that remains above the cloud with a rising Kijun-sen generally reflects a solid trend.
📊 ADX (14)
ADX measures the strength of the move.
• below 20: no clear trend;
• above 25: a trend is developing;
• above 30: a strong trend.
📉 MACD
I mainly look for:
• moves above the zero line;
• signal-line crossovers;
• divergences.
MACD often helps filter false signals when yields move in a directionless market.
📦 Volume Profile
Even though the yield itself has no true traded volume, Volume Profile can still highlight the price zones where the market has spent the most time.
I pay particular attention to:
• the Point of Control (POC);
• High Volume Nodes (HVNs);
• Low Volume Nodes (LVNs).
📐 Linear Regression
This is very useful for judging whether yields are trading near the center of their trend or in an overextended area.
📏 ATR
ATR simply measures volatility.
A simultaneous rise in ATR and ADX often confirms an acceleration in the trend.
WHAT ELSE I MONITOR
I regularly compare the 30-year yield with:
• the 10-Year U.S. Treasury yield;
• the S&P 500;
• the Nasdaq;
• the U.S. Dollar Index (DXY);
• gold.
This cross-market view often makes sector rotations easier to understand.
MY DASHBOARD
⭐ 200-day SMA
⭐ Ichimoku
⭐ ADX
⭐ MACD
⭐ Volume Profile
⭐ Linear Regression
⭐ ATR
In my view, following equity indices without monitoring long-term interest rates is like driving without looking several hundred meters down the road.
The bond market often sends the first signals. US 30-Year Yield to 6.5% - Three resistance tests - July 2026SYMBOL: TVC:US30Y | DIRECTION: YIELD HIGHER | TIMEFRAME: 1-Month
Published: July 2026
Three times the 30-year yield approached the 5.0-5.2% resistance band. Three times it was turned back. Three times the subsequent pullback was shallower than the one before it. A market that keeps returning to a level with less and less willingness to retreat from it is not a market that wants to go lower. It is a market building pressure for a move through.
Note: this idea is long the yield. Higher yield = lower bond price. Position accordingly.
On the above monthly chart the 30-year US Treasury yield is about to break out of a multi-year ascending triangle. Several reasons now exist to expect further upside in yield. They include:
1) Ascending triangle: textbook geometry. Horizontal resistance at 5.0–5.2% tested in 2023, early 2025, and mid-2026, each marked by a downward arrow on the chart. Each rejection produced a higher low than the last, creating the rising diagonal support line that defines the pattern. The measured move from the breakout projects a further +1.489 percentage points, or 29.57%, targeting a yield of approximately 6.5%. That is the mathematics of the pattern. The chart is doing the work.
2) The trend channel confirms the structure. The Gaussian channel has tracked this entire advance from the 2020 lows without interruption. Price is above it. The channel is rising beneath it. This is not a structure that is turning down. It is one that has absorbed three tests of resistance and remains pointed upward.
3) The macro case has not gone away. US debt issuance is at a structural high. The term premium is the extra yield investors demand for lending long. It has been repricing upward for three years. When a government needs to borrow more and buyers demand more to lend, the direction of long yields is not a mystery. The chart and the macro are saying the same thing.
One caveat worth acknowledging
RSI has been operating within a descending channel since the 2022 yield peak, making lower highs each time yield retests 5.0%+. That is bearish divergence and it deserves respect. It has not prevented the ascending triangle from forming, and it has not prevented the resistance breakout. But if RSI continues to decline as yield pushes toward 6.5%, that divergence will eventually have something to say about it. Watch the RSI channel. A breakout above it removes the concern. A continued decline raises it. A break above 64 will result in a melt up for markets and a melt down for precious metals.
Forecasts (yield)
1st target: 5.5%. Prior reaction zone within the advance.
2nd target: 6.489%. The ascending triangle measured move. A monthly close back below the ascending support line, currently near 4.6% and rising, cancels the thesis.
The crowd
The consensus has been calling for lower long yields, and therefore a bond rally, for the better part of three years. The Fed will cut. Inflation will moderate. The long end will recover. Three tests of resistance and three higher lows later, the yield has not cooperated. The bond market is considerably larger and considerably less sentimental than anyone forecasting it. It is not interested in what the consensus thinks should happen. The ascending triangle is what is happening as most publishers on tradingview go short. Bless.
Is it possible the breakout fails, yield retreats and the long bond finally gets its recovery? Of course. The RSI divergence exists for a reason.
Is it probable, with an ascending triangle, three years of higher lows, a rising trend channel, and a macro backdrop that has not solved the debt question? Look left. Look at the diagonal. Is this time different?
What should I do with this information? Boring Bond markets don't apply to me!
Got debt? In 10-12 month you'll wish you hadn't. Pay it off as quickly as possible.
Ww
Type: Macro / yield direction | Timeframe: 12–24 months
======================================================
Disclaimer : This idea is for educational and informational purposes only. It is not financial advice. Government bond yields and fixed income markets involve significant risk. Higher yields imply lower bond prices and potential capital loss for existing holders. Always do your own research and consult a qualified financial adviser before making any investment decisions. Past performance is not indicative of future results.
Long 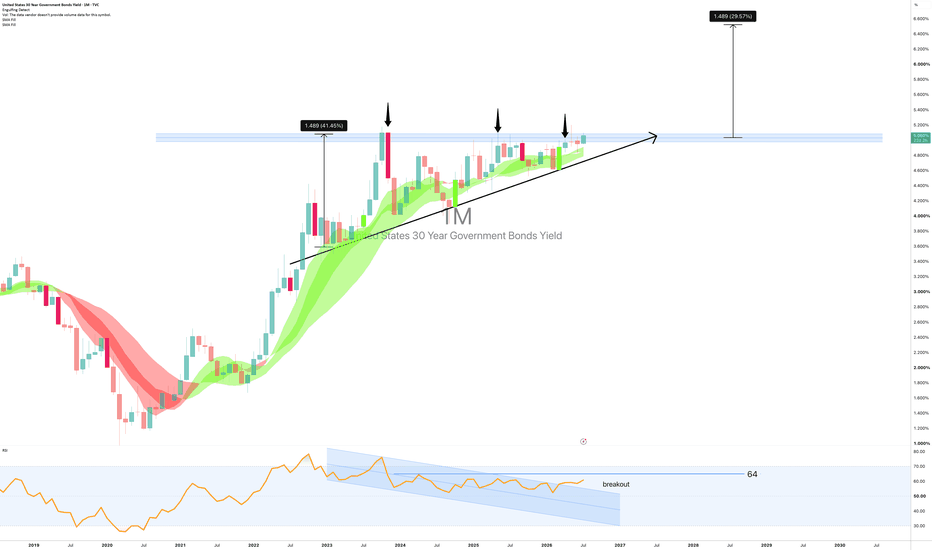
Yield Curve Twist: Why Short Rates Drop While Long Rates Surge1. Front End: Tied directly to Fed expectations
The 3 and 6 month yields are dropping because the ultra short end is anchored almost entirely to near term Fed policy.
The sharp drop on the 3 month chart shows the market aggressively pricing in Fed rate cuts or a pause in rate hikes over the immediate quarter or two. I know, CRAZY!
When traders expect short term official policy rates to come down or stay anchored, T bill yields plunge first.
2. Intermediate: The transition zone
The 1 and 2 Year charts are holding ground, hovering near their key moving average baselines.
The 2Y is often considered the barometer for the average Fed policy rate over a two year horizon. Because it sits right on the pivot line, it's torn between short term rate cut expectations and the longer term structural inflation/growth picture, causing it to trade sideways/consolidate rather than break down with the T-bills. These are usually the one uses to “manipulate” yields.
3. Long End: Driven by supply, inflation, and term premium
While short rates drop on Fed easing bets, the 10 and 30 year yields are ripping higher. This divergence happens for three main reasons:
Fiscal Supply Glut: Massive ongoing Treasury issuance forces the market to demand higher yields to absorb long term debt. TVC:TNX
Inflation Risk / "Un-anchoring": If the Fed eases policy while inflation or growth remains sticky, bondholders demand a higher term premium to offset long term inflation risk.
Uninverting the Yield Curve: After a prolonged period of yield curve inversion, curves naturally uninvert and steepen. When the long end rises faster than the short end falls, long duration bonds suffer while cash/bills rally.
The Takeaway:
The short end reflects near term policy expectations, while the long end reflects structural bond supply and macro inflation risks. Understanding this divergence keeps you from getting caught off guard when short term rates fall while long term yields continue their macro push higher.
TGTG