10y Bond Break out! We called it!SP:SPX folks we have a technical break out lets watch and see if it confirms after the close, if it does : two tings can happen we either retrace back from where it broke out from and find support then move higher or the bull flag move is too strong and we go straight up to the measured move and the markets continue to go lower as we see the futures pull back here!
Government bonds
“Mastering Government Bond Yield Curves”Comprehensive Guide to Analyzing Government Bonds Yield Curves
This article examines government bond yields across countries and analyzes their implications for the economy, investors, and commodity markets.
1. Chart Components
X-axis: Bond maturities (from 1 month to 30 years)
Y-axis: Yield (%)
Colored lines: Different countries/regions (USA, UK, Germany, France, China, Japan)
Numbers next to countries: 10-year yield and recent changes (+2.54%, etc.)
2. Yield Curve Concept
Normal/Upward Slopi
[May '26 Macro] Post 1 - US 10-Year Treasury Yield (US10Y)
(※ This is the introduction that will be identically placed at the top of 5 posts: US 10-Year Treasury Yield, Dollar Index, NASDAQ Index, Gold, and Bitcoin.)
The recent rise in the NASDAQ has been exceptionally steep, and until relatively recently, gold was hitting new all-time highs.
The market cheered, calling it the blessing of the AI era and a geopolitical hedge, but I think it is time to look at the trend slowly changing behind the party.
At the foundation of this thought are three pillar
Rising yields....Bond MarketDon’t let the pullback in gold and silver fool you.
A bond market starting to crack is one of the most bullish macro forces metals can have behind them, and almost no one is positioned for it.
Long end yields are rising across major sovereign markets. The U.S. 30 year is back above 5%, the U.S. 10 year is pressing toward 4.5%, Australia’s 10 year is above 5%, and Japan’s 10 year keeps pushing into levels that would have seemed unthinkable a few years ago.
When bonds weaken together across majo
The Great Secular Shift: US10Y and the Death of the 40-Year BullThe Structural Pivot
For four decades (1981–2020), the fixed-income market followed a singular, predictable path: Lower highs and lower lows. This era of cheap money and disinflation defined the markets' behavior. However, the post-pandemic landscape hasn't just paused this trend—it has shattered it.
The aggressive rate hikes we witnessed in response to the pandemic and high inflation were not a temporary spike. They have left a permanent scar on the macro environment. We are no longer looking
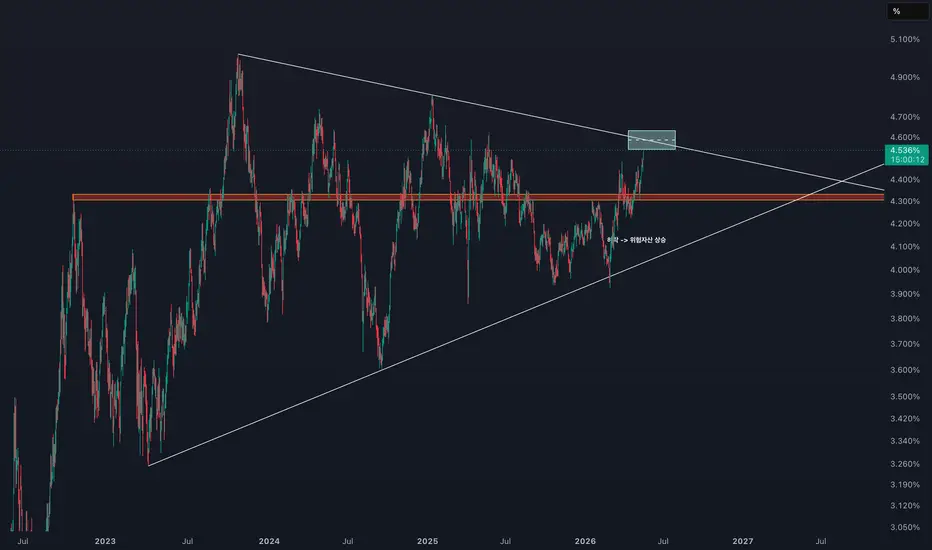
US10Y Retesting Major Resistance: Important for Risk AssetsPYTH:US10Y TVC:US10Y is now testing an important resistance area.
The 10-year yield has been moving inside a large triangle structure, and price recently pushed back above the 4.3% area.
Now the key zone I’m watching is around 4.55%–4.60%.
If US10Y breaks above this area, it could put more pressure on risk assets like stocks and crypto.
If it gets rejected here and falls back below 4.3%, that could be more supportive for risk assets in the short term.
Simple view:
Break above 4.6% = ris
The bond market may have just confirmed the beginning of Wave 5US 10Y Yields
From the historic 2020 low, the US 10-Year Treasury yield appears to have developed a textbook long-term Elliott Wave impulsive structure, potentially setting the stage for the final major upside leg.
Technical Structure:
Wave (1)-(2): post-COVID reversal
Wave 1-2: initial inflation repricing
Wave 3: aggressive Fed tightening expansion
Wave 4: multi-month contracting triangle / consolidation
Current breakout: possible launch of Wave (5)
Key Levels:
Primary resistance: 5.00%
Conser
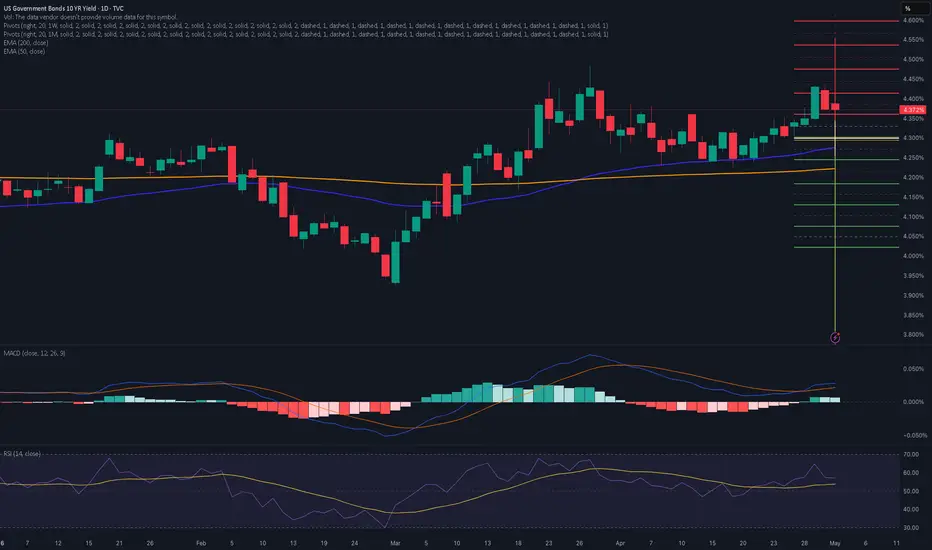
10-Year Yield Tests Range Resistance as Trend Structure ImprovesThe U.S. 10-Year Treasury Yield is pressing back into the 4.450% resistance area on the daily timeframe, a level that has capped several recent upside attempts. Price action has been forming a sequence of higher lows since the early March rebound, showing that the yield structure has shifted more constructive compared with the prior decline.
The moving averages support this improvement. The 10-year yield is trading above both the 50-day SMA near 4.302% and the 200-day SMA near 4.187%, while the
US 10Y TREASURY: Relaxation continues?The 10-year U.S. Treasury yields were traded modestly lower during the week as investors focused on key macroeconomic data and ongoing geopolitical developments in the Middle East. Bond markets remained highly sensitive to expectations surrounding Federal Reserve policy, particularly ahead of the latest U.S. labor market reports and upcoming inflation figures next week. Stronger than expected payroll data reinforced the view that the Fed could keep interest rates elevated for longer, although so
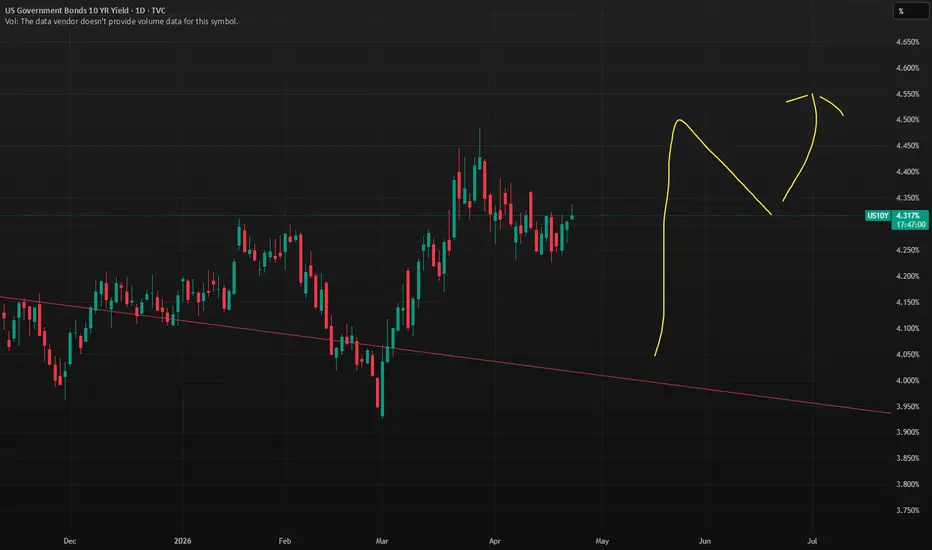
Dubious speculation on the 10Y bond market.Here I'm just giving my thoughts on the short term of the 10y. Then we go more in depth and have fun exploring the chart dubious speculation using TA. But short term i do believe the 10y will go higher and could result in the markets to have a major pull back soon.
30Y Yields Coiling at 5% — Breakout to 6% or Rejection Incoming?The U.S. 30-year yield is compressing just below a major resistance zone around 5%, after a strong multi-year uptrend.
Price action is forming a tight consolidation at the top of an ascending channel — a classic setup for a large move.
Here’s what matters:
📈 Trend remains intact (higher highs & higher lows)
⚠️ Momentum is slowing (RSI + MACD flattening)
🎯 Price is sitting right at a macro decision level
Two scenarios from here:
Bull case:
A clean breakout above 5% opens the path toward 5.8–
The 30-year U.S. Treasury yield at 18-Year High !!!-The 18-Year High: The 30-year U.S. Treasury yield is currently sitting just 8 basis points away from a new 18-year high, signaling a massive structural shift in the bond market.
-The Buyer Strike: Global investors are demanding higher yields to compensate for the mathematical certainty of future dollar debasement, leading to a shrinking pool of Treasury buyers.
-The Deficit Death Spiral: The U.S. is running a $2.5 trillion budget deficit run-rate in 2026, with $1.3 trillion going to interest ex
UNITED STATES 10 YEAR TREASURY BONDYIELD. US10YThe united states 10year treasury yield closed Friday at 4.372% in the fx window. The monthly chart shows enormous upswing potential based on the breakout of the monthly supply roof ,on technical i need a pull back as retest candle to the broken supply roof to go long and target 5.2%
the flip side will be a break and close of the current ascending trendline and the target will be 3.3%-3.4% zone .
the structure is showing me a bullish potential and it has a lot to do with the dollar index perfor
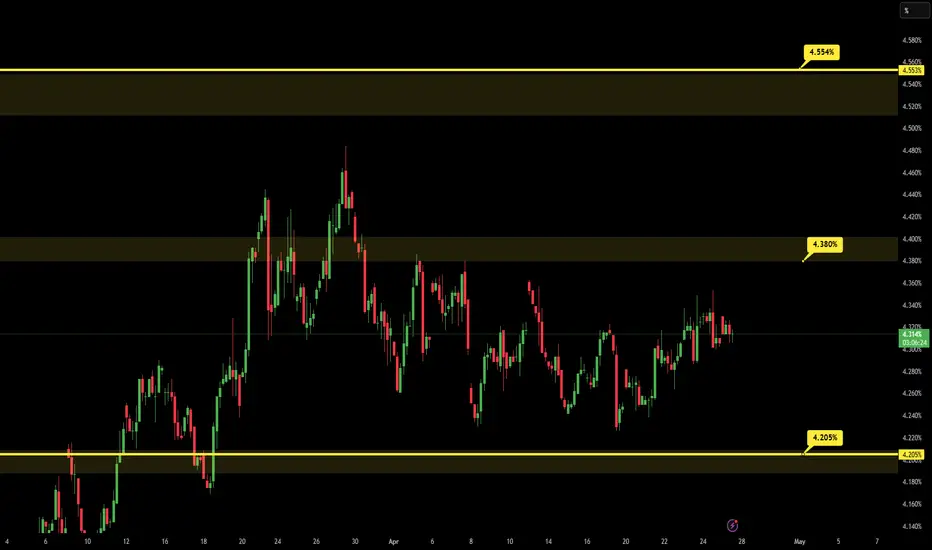
10Y BOND Expectation:BOND start the up trend and it has open target on 4.554 point, but for this price should win the 4.4 point, where is the price now, but it is under the zone and it can start the decrease, and reach the 4.205 point one more time but for this price should lose the Red line
When bond is increasing, it means that on the market there is exist the fear, and investors are trying to use safe way and they are buying the bond, until the bond is in the up trend general market, is under the risk, only Tr
US 10Y TREASURY: Double topped?U.S. 10-year Treasury yields moved higher, approaching the 4.4% area, as markets reacted to a combination of resilient macro data and rising inflation pressures. Solid GDP growth around 2% and persistent price pressures, amplified by higher energy costs, have reinforced expectations that interest rates may stay elevated for longer. The Fed held its regular meeting, with a decision to keep interest rates unchanged, as was widely expected. Overall, the bond market reflects a macro environment wher
High Probability of a incoming Yield Curve InversionIt seems pretty clear to me that the yield curve is on track to invert in the relatively close future. We have a very strong technical set up suggesting an inversion is inbound. In order to keep things simple I have focused on just 3 indicators on the main chart (because those are bad enough).
In addition to those three indicators we can also see that price action has fallen out of a bearish rising wedge. The traditional target of a rising wedge is the base of the wedge. That would set up a p
10Y BOND Expectation:BOND start the up trend and it has open target on 4.554 point,
but for this price should win the 4.380 point, 4.205 point is the
decision of the up trend.
When bond is increasing, it means that on the market there is exist the fear,
and investors are trying to use safe way and they are buying the bond, until
the bond is in the up trend general market, is under the risk, only Trump
bought 52 Million of bond in the March!
US 10Y TREASURY: Volatility ahead of the FOMCThe 10Y U.S. Treasury yields traded in a volatile manner this week as markets reacted to shifting expectations around Middle East developments and U.S.–Iran ceasefire dynamics. Early optimism that geopolitical tensions were easing briefly pushed yields lower, as oil prices declined and inflation fears softened. However, that move reversed as ceasefire optimism faded and markets reassessed the persistence of supply risks through the Strait of Hormuz, supporting a rebound in yields.
At the same ti
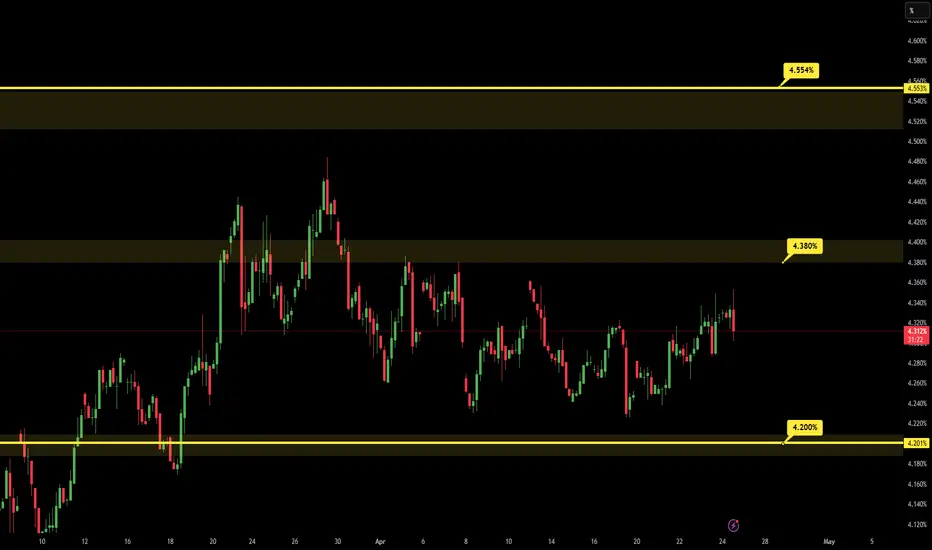
10Y BOND Conclusion:BOND start the up trend and it has open target on 4.554 point,
but for this price should win the 4.380 point, 4.2 point is the
decision of the up trend.
When bond is increasing, it means that on the market there is exist the fear,
and investors are trying to use safe way and they are buying the bond, until
the bond is in the up trend general market, is under the risk!
10Y bond warning!Folks the 10Y bond yield is forming a bull flag! This isn't good for the markets as it can have a couple of meanings and outcomes.
If this goes up it could mean inflation expectations would go higher. The cause could be many things such as oil goes back up, or very strong economic data the list can go on.
if it goes up by oil then the war escalates further. If its too strong economic data then the FED cant cut rates because of the fear to cut too soon on strong economic growth would bring i
Expect higher US interest rates now that the wedge resolved upBullish for rates,
If the wedge has resolved upwards direction then this chart shows that the Fed just follow the yield on the US 2 year
They take their time but its clear this is the historical precedent in the Green line is US interest rates
The blue line is JPY interest rates as a looksie
Also not shown here the US 10 yr looks to be moving higher too