correlation between the yield curve and the unemployment rate correlation between the yield curve and the unemployment rate by adiadiadi0520520524
correlation between the yield curve and the unemployment rate correlation between the yield curve and the unemployment rate by adiadiadi05205205214
US10Y Look for a 1D MA50 rejection.A month ago (August 21, see chart below) we argued why the U.S. Government Bonds 10YR Yield (US10Y) would go lower with the Fed having no choice but the cut the Interest Rates: Well the Fed did it and cut the rates not just by -0.25% but -0.50%, initiating the new cut Cycle. Now let's look at the US10Y's price action on a smaller time-frame, namely the 1D. As you can see the pattern is a double Channel Down, with the price trading below the 1D MA50 (blue trend-line) since July 03 2024. ThaShortby TradingShot14
Five Market Correlations You Can UseAs a trader, I've discovered key market correlations that provide valuable insights. Here are 6 you can use: 1️⃣ US Dollar Index & Commodities (DXY & Commodities ): The US Dollar Index often moves inversely to commodities like gold and oil. Monitoring this correlation helps gauge potential moves in commodity prices based on the USD's strength or weakness. 2️⃣ S&P 500 & Volatility (SPX & VIX): The S&P 500 and the VIX (CBOE Volatility Index) exhibit an inverse relationship. A rising VIX indicateEducationby AlexSoro421
US 10Y TREASURY: surprising 50 bps cutAlthough markets were divided on whether the Fed will cut interest rates by 25 bps or 50 bps at their September meeting, still, the Fed brought some sort of surprise by cutting interest rates more aggressively, by 50 bps. Considering Fed's dual mandate, to keep inflation at targeted levels and a stable jobs market, the analysts are now noting that, with the latest rate cuts, the Fed switched attention to the US jobs market. The US yield reacted to the Fed's decision in a mixed manner. Still, theby XBTFX11
Discounted Free Cash FlowCreate discounted free cash flow model with annual free cash flow. Perpetual rate of 2.5 discounted rate of 7.5by vstefanovofm15
Recession Now Well Underway The yield curve is now fully inverted after reaching EXTREME levels. With that, we can conclude the recession has officially contaminated the financial sector. Soon (likely before year end) we will see a significant selloff in equities. Suggest: sell stocks & buy US Treasury Bonds.Shortby ChiefMacro3
Re-elect Mayor Goldie Wilson 10-yr yields 100 bps below target & trending lower US Election 2 days before next FOMC Expect October surprise? FOMO into US10Y now & sell the election/emergency With this sentiment, looking for clown-world short setups in fx Longby fullretardforex14
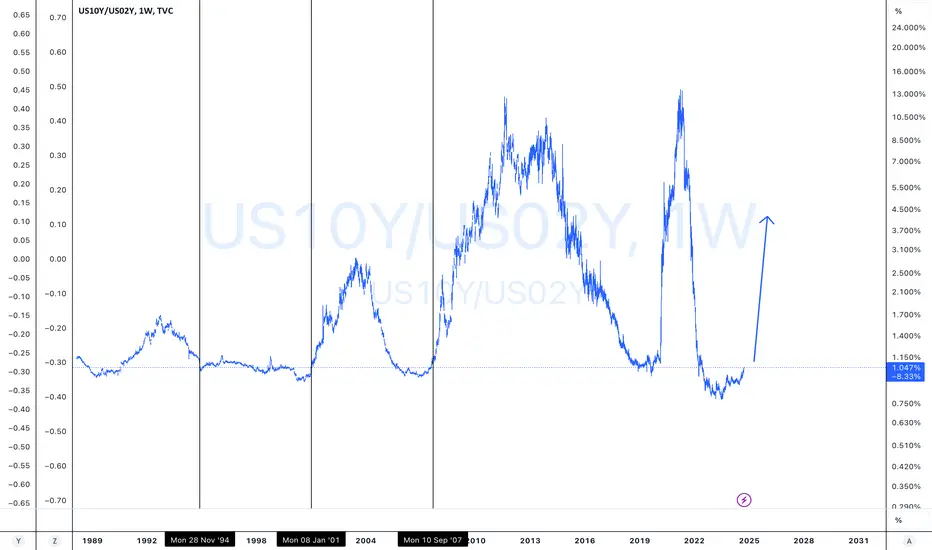
US10y-US02y Yield Curve Reversion - Watch StocksUS 10y and 2y yield curve has reverted (i.e. is no longer inverted) and historically this has been a bearish signal for stocks in the months ahead. Whilst stocks have continued to gain for a few weeks to months, ultimately there seems to always have had a precipitous drop to follow. Keep a solid cash position and potentially look to hedge longs moving into October/November and onwards. These drops have presented FANTASTIC buying opportunities, but ultimately you can only buy if you have dry pby Long_Game_Trading6
Lower Rates Expected by 9/27/24Ahead of the Fed meeting Wednesday the market was pretty much 50/50 split on whether the fed funds rate would be cut by 25 or 50 basis points. After the 50bps announcement the counter intuitive move occurred, which was rates began rising, but this should have been a surprise. This was as straight forward "buy the rumor, sell the news" gets. Today however it appears the rates attempted to rally past 3.76% but failed. 3.76% happens to be the 50% fib level from the recent highs to lows and now we'Longby jpoma134
US10Y - US02Y OutlookBacktest of bull flag intersecting .618 fib retracement then up we go Also looks like 200 DMA will intersect - Idea - Not financial adviceby mypostsareNotFinancialAdviceUpdated 38
1 year T bill yield on Fed DayJust a quick visual of the yield chart for the 1-year Treasury Bill. Disclosure: Not a recommendation to buy or sell securities. by jpmonaghantradeview6
20yr yield breakout from C waveCurrently monitoring the 20yr bond yield. On this Chart. I've found a desc. Triangle breakout set up with a bullish wave count. Also notice the yield is at an oversold level for this time frame and below the cloud. I'm looking for the yield to retrace back up above the 5th elliot wave and close above 4.367at minimum before going higher. Disclosure: I have puts on NASDAQ:TLTLongby moneyflow_trader56
US10Y - Sluggish Downside DeliverySeptember has been a red month. With business being conducted at macro Sellside 3.666%, we are starting to see a few more bullish days leading to the potential for a short-term relief rally. But where could we reach up into? Long06:25by ClosingTicks3
Adapting Your Strategies to Stay AheadThis is how I embrace market adaptability and recognize (and navigate) changing market conditions! As a trader, I've learned the art of adapting my strategies to stay ahead and here's how: 1️⃣ Market Awareness: I continuously monitor market trends, economic data, and global events to stay informed. Recognizing shifts in volatility, sentiment, and liquidity (if not trading FX) is key to adapting. I make sure to have a baseline short and mid term outlook, so I can spot deviations which could signEducationby AlexSoro16
Chart Analysis of 10-Year U.S. Treasury Bond Yields Based on current chart patterns and Elliott Wave Theory, it appears we are in Wave 4 of a higher-degree cycle for the 10-year U.S. Treasury bond yields. Wave 4 is typically a corrective phase following a strong trending Wave 3, suggesting that this phase may involve consolidation or retracement. Key Levels to Watch: 38% Retracement (Lower Orange Line) : If yields bottom near this retracement level, it may indicate a potential support zone where Wave 4 could complete its correction. 61% Retrby imkhushal15
US 10Y TREASURY: Fed on the moveThe US inflation data, posted during the previous week, clearly showed that the inflation in the US is slowing down. It is still above the Fed's target of 2%, but it opens the space for the Fed to cut interest rates. Markets are almost sure that the first rate cut will occur at September's FOMC meeting, which is scheduled for September 19th. The market positioned itself in accordance with expectations during the previous weeks, by decreasing yields on the US Treasury bonds. The 10Y US Treasury bby XBTFX12
Yield Spread UST 10Yr and 2Yr and S&P500 CrashThey said when Spread Yield TVC:US10Y 10Yr and TVC:US02Y 2Yr return to positive area after spending some time in negative area, within 3 to 6 months, TVC:SPX will crashby mmdcharts3
30-year US10Y trend vs. 10-year Bitcoin trend divergence vs. disparity o1-mini: **Understanding Divergence vs. Disparity** - **Divergence** refers to a situation where two related data sets, indicators, or trends move in opposite directions. In financial markets, divergence often signals a potential reversal or shift in the prevailing trend. For example, if the price of an asset is rising while a momentum indicator is falling, this negative divergence may indicate weakening upward momentum and a possible downturn. - **Disparity**, on the oby Surfwave10
US bond market is yelling Crash coming!US02y/US10y suggesting a change on the trend pretty soon. Last two times MACD was this close to visit the 0 line It took about 120 days to start the crash in 2007 and less than 30 days in 2020. It is just a matter of time folks. Pain is close Shortby elalemiami7
Bear flag on 20yr treasure bondBear flag showing with overbought stoch rsi. Looking for a possible bearish continuation to higher time frames. Target 97 on NASDAQ:TLTShortby moneyflow_trader385
US Dollar Short: Crash comingBased on my updated Elliott Wave counts, USD is currently in a wave 3 down. I analyze this based on DXY, EUR/USD, USD/JPY, and USDSGD. Additionally, I also discussed the Fed rate cut. Instead of 25 basis points, the Fed might even cut 50 basis points.Short05:25by yuchaosng16
What if bonds are kinda important?Lets draw few parallel lines. Looks like cross of green supports shows start of the party and crossing red resistances means music isn't playing anymore. Could be coincidence. Looks like green support is coming. If we pierce it could be bullish. Unfortunately this time is different because of inversion. We will see.by wratislavian13
Plotting the decline in ratesplease approximate the next number in the following number sequence: 1187, 850, 455, 266 ... Therefore, the next number in the sequence might be approximately 163 falls in rates are happening faster and faster. forecasts.org predicting 2% rates by april in the 30Y with the drop starting in oct/novby GoodTexture1
 Short
 EducationShortLongLongLongLong
 EducationShortShortShort