Weekly Leading Indicators are all GO BearPretty much enough said.
Warning given weeks ago.
Now it is turning.
ALL the leads are bearish, red flags ON
Just waiting for the playbook to pan out with a hard pull back. Last week we already saw the equity markets do a trend reversal pattern of Lower Highs and Lower Lows.
Time to deliver the main Bearish course...
Stay safe!
Government bonds
SG10Y - a peek into the next few weeks.As pointed previously for the last few years... the SG10Y Singapore Govt 10 year Bond Yields chart have an uncanny correlation to give us a heads up on when the US Equity markets like the S&P500 SPY SPX are going to keel over and drop.
On such instance is here and now.
A higher high and a clear breakout after a Fibonacci retracement, within a bigger retracement. This is a clear and present indication that (US) equity markets are going to keel over and drop.
Bears are just around the corner.
P
US 10Y TREASURY: surprise, surpriseThe US jobs data posted during the previous week was the highest surprise for markets in the recent period. The US economy added 256K new jobs in December, which was much higher from market expectations. At the same time, the unemployment rate dropped to the level of 4.1%. Certainly, such developments are positive for the US, however, investors were not happy. A strong jobs market and a too strong US economy will make the Fed halt further cuts of interest rates. Some analysts already came up wit
[EUCHF] Reallocating your FIAT-Cash to your friendly neighbour OANDA:EURCHF
Hello all,
TL;DW:
Without seeing a precise trade entry/exit this 'trade' is more about positioning you FIAT into another country.
🧀 The reward is (more) cheese
Knowing that inflation will (hopefully not!) come back in full in 2025, it can be a wise move to prepare for it in advance and position yourself accordingly.
🧀 Super Swiss Cheese Target of below 0.9 and below
I assume a continuation in this drawn channel of standard-deviations, which will lead to a target over
Market Update: UK 10Y Yields Back on Nov 4th, we highlighted a potential triangle pattern on UK 10Y yields. 📈 At the time, we noted that a weekly close above 4.75% would complete the pattern, offering a potential longer-term upside target of 6.6%.
Last week, we got a weekly close above 4.75%! While a monthly close would strengthen the case, for now, as long as yields stay above 4.50%, I'm leaning into this scenario.
Disclaimer:
The information posted on Trading View is for informative purposes and is not intended to cons
Bond prices under pressureThe price on the US 10-year Treasury note fell to almost 96.0 on Friday, after payrolls report came stronger than expected, reinforcing the view that Fed would need to slow down rate cuts.
The price on the UK 10-year gilt fell to 89.6, the lowest since August 2008, and broke down the support at 91.0.The pressure in the UK bond market has been further amplified by mounting investor concerns over the nation’s debt levels and the government's ability to restore public finances while implementing
10y+ bonds are becoming even more attractive for investorsThe US economy in December added the most jobs since March and the unemployment rate unexpectedly fell, capping a surprisingly strong year and supporting the case for a pause in Federal Reserve interest-rate cuts.
Nonfarm payrolls increased 256,000, exceeding all but one forecast of economists. The unemployment rate fell to 4.1%, while average hourly earnings rose 0.3% from November.
YIELDS are rising, and traders are fully pricing in the first rate cut in October. The 10-year yield may aim for
1Q2024 outlook pre-December NFP'sBack in December before the November non-farm payroll print, the US 10-year yield was sitting just below the 4.20% which coincided with the 50- and 200-day MAs. Since the stronger than expected payroll print of 227 thousand, yields have spiked aggressively to highs just above 4.7% earlier this week. (See the attached idea from December)
It is difficult to gauge how the payrolls will affect the US bond market today but I still believe the US 10-year yield will reach the 2023 highs of 5% given th
Bond market bottom ? Equites down bonds to change and move up?Simply put, USA needs the interest rate to be lower, it bounces off the long term KLOS then we could see a change in direction for bonds something that next to no one is expecting. Trump is coming into help save the world. So his new team will make structural changes Elon could tweet to all to buy bonds and hey everyone who follows him takes action to save their own butts. Elon fixes the deficit hugely in relative proportions without putting the jobs at risk.
That would on the one hand help sa
ULong
British bond yields breakoutBritish long bond yields, in this case 30 year yields are breaking out from a long term ascending triangle pattern. Higher long bond yields tend to translate to higher interest rates so if this trend continues could impact the housing market and the overall economy of Britain.
2024 review and where to from here for US10yRisk-off sentiment doesn’t seem to last long in this current market despite all the geopolitical tensions, election volatility and inflation fears we witnessed this year. In spite of all the volatility and the odd carry trade squeeze the SPX is set to end the year up more than 25%, its second year on the trot of more than 20% gains. Never the less the US10 is on its way to close the year down roughly 4.5%. Meanwhile gold, a risk-off asset similar to US long-term treasuries, touched fresh all-tim
US10Y afternoon analysisTechnical analysis for US10Y.
Bearish on long-term bonds, this analysis has yields continuing to go up.
Displayed count has A wave beginning off 9 March 2020 low, completed 23 October 2023. B wave as completed zigzag to September 17 2024 low.
C wave count in wave 3 of 3, with targets of 5.337% and 5.592%. This count shows C wave completing at top of pitchfork (drawn off 9 March 2020 low), but with measured move I would expect the C wave to complete north of 6.496%.
Key supports: 4.507% and 4
US 10Y TREASURY: expected economic outlookInvestors continue to weigh the US economic outlook for the year 2025, and adjust their positions accordingly. Although there has not been significant US macro data released during the previous week, still, the ISM Manufacturing PMI report for December showed that the US manufacturing remained under pressure. Also, weekly jobs data missed the investors’ expectations. The market reacted with further decrease of the price of the US Treasuries, increasing the 10Y benchmark yield to the highest week
Potential Bond Duration Spread - 'Riding The Yield Curve'I expect short-dated treasury yields to drop, increasing their price
ie. buy short-dated treausries
could also go short ultras but my view is that yields will slowly come down across the board so I will not be buying the spread
COT positioning shows commercials favour shorter duration bonds
Reversal Imminent as Bond Yields Hit Key Support🚨 Why Record-Low Bond Yields Matter for Chinese Stocks 🚨
When bond yields hit record lows, it sends ripples across financial markets, and for Chinese stocks like NYSE:NIO , NYSE:BABA , and NASDAQ:JD , the implications are particularly impactful. Here's why:
1️⃣ Lower Borrowing Costs
Low yields equate to reduced interest rates, making it cheaper for companies to finance debt or raise capital. For capital-intensive firms like NYSE:NIO , NYSE:BABA , and NASDAQ:JD , this means:
Improved fina
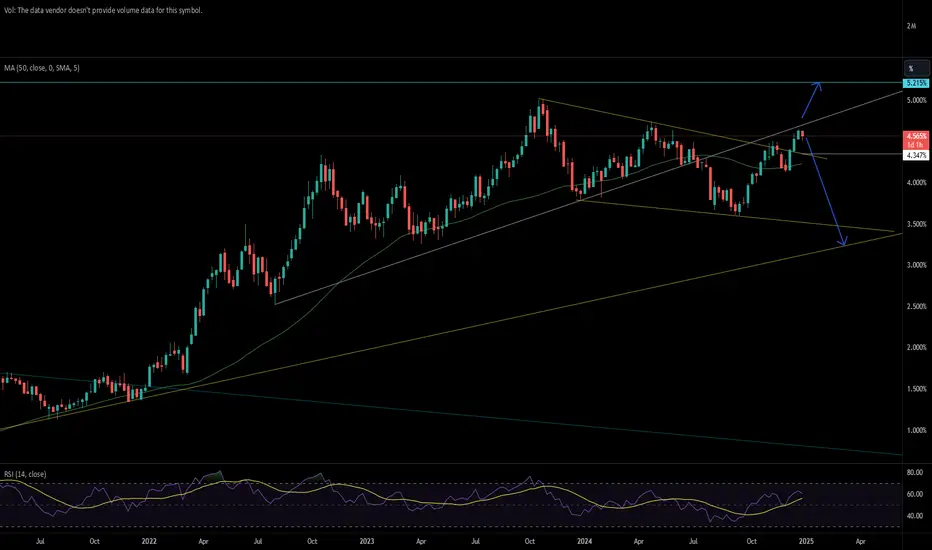
US10Y yieldsYields are the factor that dictates what happens to the market next.
In case of a break above the white trend around 4.8% expect another push higher towards 5.2% which will mean the stock market might a final push higher, then a recession should hit at this rate.
in case of a break below the yellow channel around 4.35% expect further downside to 3.2% which should coincide with a healthy market correction and a run to safety with a rise in bonds, below this level should means recession is alread
Did the 10 year yield break in 2008?Good day Traders and investors,
The 10 year yield on the 6 month chart. This is the entire history on one chart.
What is going on with the 10 year yield? It is getting very, very volatile. It all started in 2008 with the financial crisis just looming around the corner. At the same time it broke the .236 on the Fibonacci sequence and has been diving ever since. That is until the next major crisis of the pandemic where is seems to have bottomed and took a strong bounce off a cliff dive. What d