A fascinating chart - monthly JP20YWhilst the worlds and his wife has been focused on AI and Bitcoin there have been other moves afoot which should also be of concern. One of these is the move in long dated Japanese Government Bond Yields.
I am in now way any sort of expert in JGB, but I know an interesting chart when I see one. The trend on the JGB20YR Yield has been one way traffic since that double bottom back in 2021. Last week the yield hit 2.85 - the highest this century.
Why is this of any interest?
Whilst the BoJ sho
Government bonds
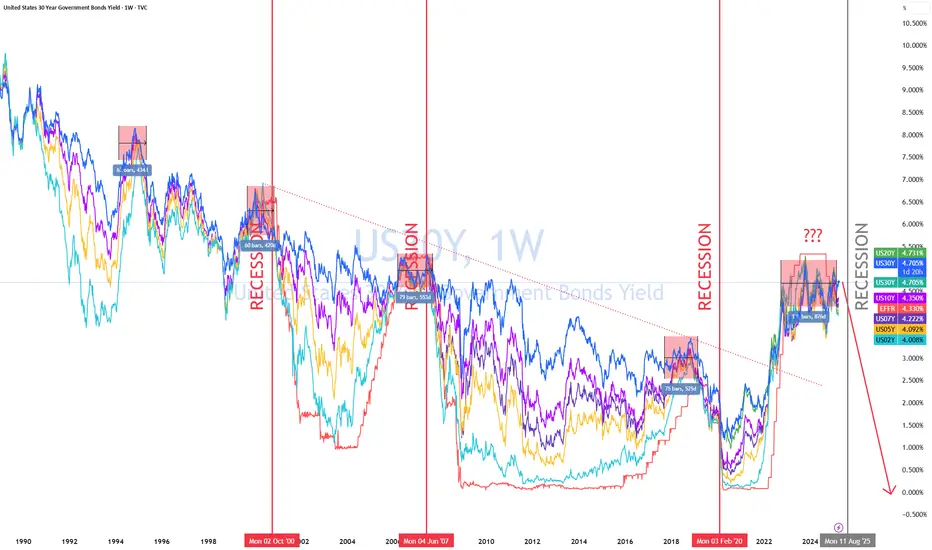
Crash / Clear Recession (Confirmed Later)??? or Mild RecessionI have Labeled all the phases in Color Coded lines
The color of the lines is tied to Equities and their "current stance" during the time period.
Each colored line is also labeled with the ( 10 Year - 2 Year Yield Curve ) Cycle for the time period.
I label at the current date the two possible situations going into 2026
US 10Y TREASURY: Holds tight rangeDuring the previous period markets were moving based on sentiment, considering that official macro data were not at disposal. The first data were posted during this week, showing relatively mixed signals for the jobs market. The NFP added 119K new jobs in September, surpassing market estimates of only 50K. On the other hand, the US unemployment rate has risen to 4,4% in September, from 4,3% previously. The 10Y benchmark yields were moving between 4,16% and 4,06%. Friday brought another push towa
UST 10Y OUTLOOK FOR THE WEEK NOV 34-28
The US 10-year Treasury yield closed the prior week at ~4.06%, down sharply on dovish comments from NY Fed President John Williams supporting a potential December rate cut. Market-implied odds for a 25bps Fed cut on Dec 9–10 have rebounded to >50% (from lows near 30–40% earlier in the week), driven by softening labor signals and heightened uncertainty. Key data this holiday-shortened week includes flash PMIs (Mon), advance GDP Q3 revision & durable goods
US Recession Imminent! WARNING!Bond traders are best when it comes to economics. Stock traders not so much.
As the chart shows, historically, when rates bunch up, what follows is a recession. During the recession, the economy tries to fix itself by fanning out the yield curve, marking it cheaper to borrow and boosting the economy.
The best time to be buying up stocks and going long the market is when the yield curve is uninverted and fanned out wide—not when it is bunched up like this.
My followers know this is my first wa
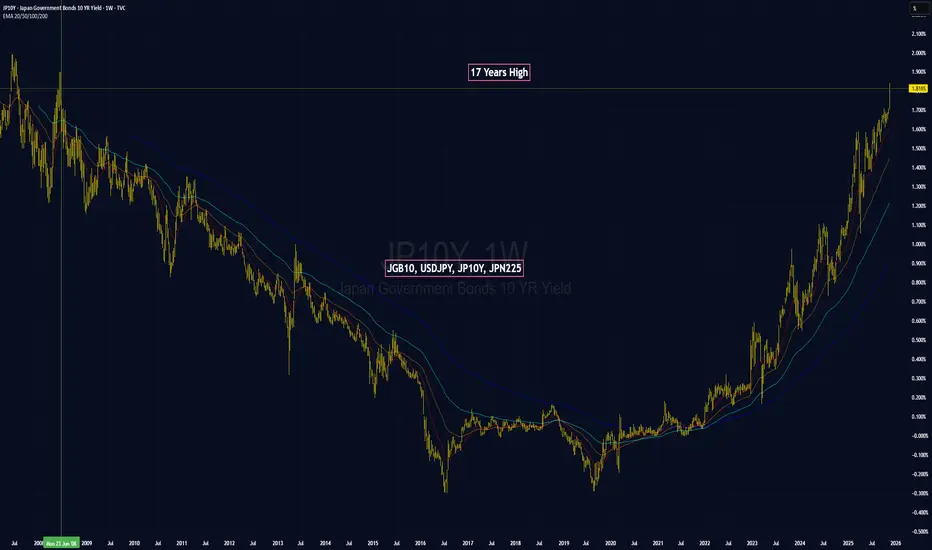
JGB Selloff Flags Rising Fiscal RiskJapan 10Y Yields Hit 17-Year High: JGB Selloff Flags Rising Fiscal Risk
Idea Summary
Japan’s 10-year government bond yield has climbed to around 1.8% for the first time in more than 17 years, driven by concerns over an aggressive fiscal stimulus package and a deteriorating debt outlook. At the same time, ultra-long JGB yields are surging, signaling that investors are demanding a higher risk premium to hold Japanese debt. In this note, I focus on what this means for JGBs and JPY going forward
WTO’s Role in Global Trade1. Ensuring a Rules-Based Trading System
One of the fundamental roles of the WTO is to provide a structured, predictable, and transparent system of global trade rules. These rules cover goods, services, intellectual property, investment, and dispute settlement.
Key goals of the rules-based system include:
Reducing trade barriers such as tariffs, quotas, and subsidies
Ensuring fairness by preventing discriminatory trade practices
Promoting transparency so countries publish and follow their t
EUR/USD long: Expect volatility leading up to US NFP dataHello traders
I have closed my EUR/USD short for a 63 pip profit.
I have initiated a long EUR/USD position at 1.1583 with a stop at 1.1560.
The USA NFP data on Thursday is guaranteed to create volatility for the rest of the week.
TECHNICAL:
EUR/USD is holding steady above a weekly close level.
GOLD is also steady above the weekly close of 4000/oz
DXY is below a weekly close and formed a Doji candle yesterday. If tomorrow's close is lower, it will be an evening star pattern.
US Government Bond
TRADINGVIEW — NY SESSION UPDATELondon pushed the Dollar into 99.591, but DXY remains inside yesterday’s structure.
Compression unchanged.
Yields softer into NY — 10Y −1.11%, 2Y −1.27% — defensive tone with no directional commitment.
ES reclaimed the 6655.50 London low and trades back inside its range.
Gold steady above 4019.57.
Volatility stable.
NY opens into a tight Dollar and softer yields.
First expansion sets the tone.
— CORE5DAN
Institutional Logic. Modern Technology. Real Freedom.
PRE-LONDON CONDITIONS — DXY Range-Bound, Yields Slide, ES HeavyU.S. Dollar Index (DXY) holds a tight 98.99–99.59 range in a third consecutive inside bar.
U.S. 10-year yield drops ~1.01% in Asia.
U.S. 2-year yield falls ~1.27%.
S&P 500 futures (ES) extend lower toward the 6.571 fractal.
Gold tests support after filling imbalance.
Volatility remains elevated.
DXY — Dollar Index
Dollar stays inside 98.991–99.591.
Inside-bar stack remains unbroken.
Price sits near the 0.6 premium zone.
Neutral until London breaks the range.
Yields — 10Y & 2Y
10Y yield: -1.0
PRE-NY CONDITIONS — 17 November 2025New York inherits a defensive London session: steady Dollar, firm short-end yields, weaker equities, and rising volatility.
1. Market Environment (London → NY Transition)
Dollar:
DXY holds mid-range near 99.40. No shift in macro tone during London.
Yields:
US10Y near 4.15%, US2Y near 3.60%. Both stayed contained inside narrow ranges — policy tone unchanged.
Risk Tone:
ES weakened through London. Volatility elevated. Global tone remains cautious.
Liquidity:
Thinner into NY as VIX climbs and
US 10Y TREASURY: Fed might (not) cut in DecemberThe US Treasuries were moving in a swing manner during the previous week. The 10Y US benchmark reached the lowest weekly level at 4,05%, but ended the week at 4,18%. The US Government ended its longest “shutdown” in history, however, there is some indication that the macro data for the “shutdown” period will probably not be released. Investors are attempting to assess the health of the US economy amid a lack of fresh data and uncertainty about policy direction. The pause in key statistics has le
PRE-LONDON CONDITIONS — 17 Nov 2025I. Market Environment
Dollar: Neutral overnight. No directional pressure in Asia.
Yields: US10Y and US2Y stable — policy expectations unchanged.
Risk: Equities firm but stretched. Volatility elevated from Friday.
Focus: Light session before a heavy macro week.
Liquidity: Cautious, headline-sensitive.
II. Six-Chart Snapshot
(All structural notes shown on your chart image — not repeated in text.)
III. Cross-Asset Signals
Yields keep the Dollar capped.
Equities supported but fragile.
Gold soft
Federal Reserve is about to Panic and dump the Fed Funds RateFederal Reserve is about to Panic and dump the Fed Funds Rate. The Federal Reserves wants us to believe that they set the Interest Rates for America. They want us to believe that they are relevant and important. When in actuality it is the 2 year Treasury Note that sets Interest Rates.
The Federal Reserve chases the 2 year Note. If the 2 year note goes up, the Federal Reserve follows it up. If the 2 year note goes down, the Federal Reserve follows it down.
The 2 year Note is preparing to p
Agencies’ Impact on Finance in the World Market1. Role of Financial Agencies in the Global Market
Financial agencies are entities that oversee, regulate, or evaluate economic and financial activities at both national and international levels. Their main functions include:
Maintaining financial stability by monitoring market trends and risks.
Providing credibility and transparency through accurate data, ratings, and analyses.
Ensuring fair practices in banking, trade, and investment.
Supporting economic growth by setting monetary policie
US 10Y TREASURY: The 4% expected to holdWith the U.S. government shutdown limiting official data, investors are turning to alternative economic indicators to gauge the economy. A University of Michigan survey on Friday showed consumer sentiment fell to 50.3 in November, well below the expected 53.0 and near historic lows. Concerns deepened after Challenger, Gray & Christmas reported October job cuts surged to 153,074, triple September’s figure and the highest for any October since 2003. In the environment of economic data blackout, it
US10Y UNITED STATES 10YEAR TREASURY BOND YIELD. WEEKLY TF US10Y=4.09% weekly close and i see a pull back into confluence where i expect the US10Y to keep rising possibly into 5.0% 2026
FUNDAMENTALS OF US10Y AND US10.
The US 10-Year Treasury note (US10Y) is a debt security issued by the U.S. Department of the Treasury with a maturity of 10 years. It is a key benchmark in global finance and plays a vital role in the U.S. economy and monetary policy changes .
The US10Y yield represents the return investors demand for lending money to the U.S. government
Gold and Silver have a unique relationship with the US10Y.Gold and Silver have a unique relationship with the US10Y since 2011.
Gold+Silver have always had a cool-off period when the US10Y relative touches this range bottom.
Nov US10Y auctions = gold/silver cool-off period.
The bond market MIGHT disagree with rate cuts again.
US 10Y TREASURY: 4% remains in focusThe most important event during the previous week was the FOMC meeting, held on Wednesday, where the Fed decided to cut interest rates by another 25 basis points. Although the market was expecting that another rate cut is coming in December, still, comments from Fed Chair Powell, that such a course of action might not be in the store, set investors to re-positioning. The 10Y US benchmark yields strongly reacted to Powell's comment, bringing yields back toward the 4,1%. The lowest weekly yield le
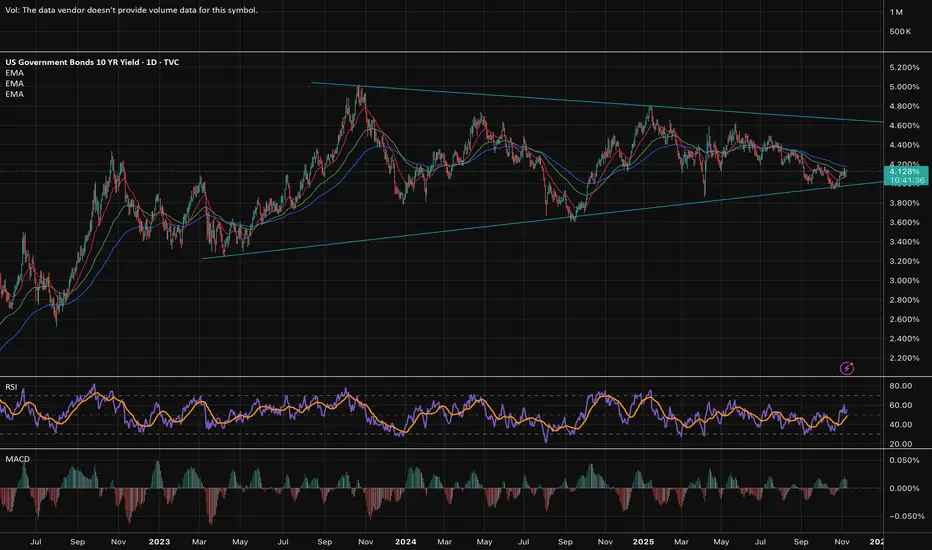
US10Y This break-out can be the next Buy Signal.The U.S. Government Bonds 10YR Yield (US10Y) has been trading within a long-term Triangle pattern and more recently since May 22 2025 it has found itself declining inside a Channel Down.
This Bearish Leg (Channel Down) almost hit the bottom of the Triangle and has been rebounding in the past 10 days. As long as the 1W MA200 (orange trend-line) holds (right now almost at the bottom of the Triangle), the probabilities of a rebound and new Bullish Leg remain strong.
The confirmation for such Bull
CA10Y CANADIAN GOVERNMENT 10YEAR BOND YIELD CA10Y stands for the Canada 10-Year Government Bond Yield. It represents the yield or return that investors receive when they buy a Canadian government bond with a maturity of 10 years. This yield is a key benchmark interest rate reflecting the cost for the Canadian government to borrow money over a decade.
The 10-year bond yield is closely watched by central banks, including the Bank of Canada, because:
It reflects long-term market expectations for inflation and economic growth.
It serves as a