
Government bonds

short 10y bondsinfaltion is falling with it the intrest rate therefore the easing of monetary policy makes the bonds less attractive to investors as they could get a much higher returens on other assets or equity
Short
Bull Market in Housing to continue till 2027It would surprise many.
So far House prices have been holding up with rates going parabolic
Strong economies can usually handle a few years of stable rates in around 5%
Supercycle's generally last 16-18 years
As we saw in the great Bull run of 1982 to 2000
A repeat of this cycle timeframe: would mean
#Bitcoin top 2025 (2009 inception)
#Stocks 2026 (march 2009)
#property 2027 due to lag and time to make a sale. (End of 2011)
Long
US 10Y TREASURY: easing with lower groundsInflation data posted during the previous week were the ones that the market was closely watching. A better than expected inflation in June in the US made an impact on Treasury yields. The consumer price index in June was down 0.1% from the figure posted in May, bringing CPI to the level of 3.0% on a yearly basis. At the same time core inflation was higher by 0.1% on a monthly basis, bringing core inflation to the level of 3.3% y/y. The evident slowdown in inflation figures supported market expectations that the Fed might cut interest rates in September this year, in which sense, 10Y Treasury yields dropped to the level of 4.18% as of the end of the week.
In terms of technical analysis, the 10Y Treasury yields are still testing the 4.20% level. In this sense some lower volatility might be expected in the week ahead. The market might turn once again to the upside, to the levels modestly above the 4.20% level. Charts are indicating probability for 4.30%, however, this might be the case for a week or two weeks ahead. In any case, the longer term perspective for Treasury yields is further decreased.

US10 YEAR BONDS NEXT MOVEHELLO TRADERS
As i can see US10Y testing a strong support and trading inside triangle zone rate cuts are coming but still not happened tecnically it q very low risk based trade with a higher rewards Bond markets are big they move in days .... its just a trade idea with tecnical analysis share ur thoughts with us Stay tuned for more updates
Long
chf/jpy trend reversal?Has the pair chfjpy finally topped in? Maybe it's too soon to state that but we can say for sure that during this epic bull run it has remarkably moved away from its fair value (given by the yelds spread) . The target imho is at around 142/143 area (around 3400-3500 pips from current price).
 Short
Short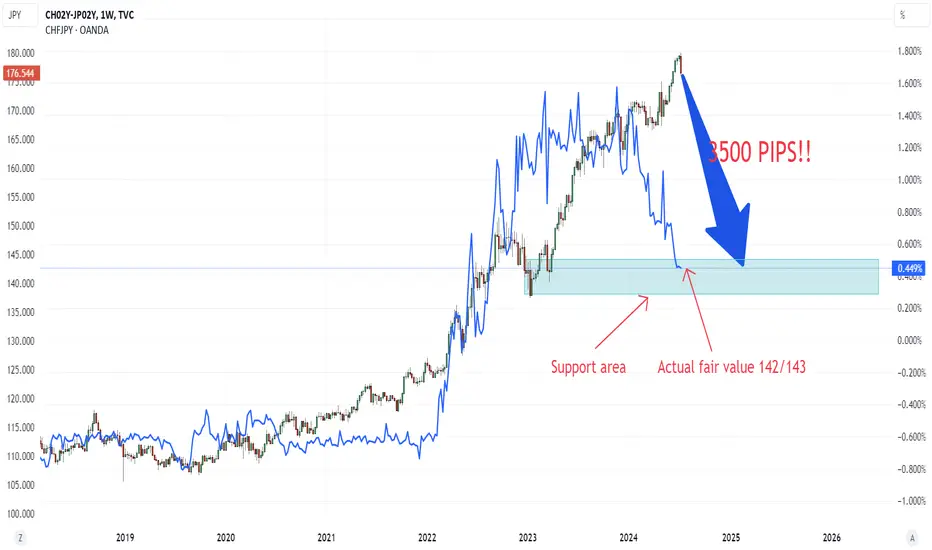
Bullish case for #gold and #miners playing out.Bullish case for #gold and #miners playing out.
10 versus 2 Year Yields
Gold Versus Inflation

US10Y - Peek 'A' Boo, I See YouExpecting a orderblock attack @ 4.197%. This week will be interesting!
Short
Why Are Bonds Still Crashing?Why are US, UK, and EU bonds still crashing since March 2020?
In this video, we are going to study the relationship between bonds, yields, and interest rates, which many of us find confusing. How can we understand them, and why are bond prices leading the yield, followed by interest rates this season?
10 Year Yield Futures
Ticker: 10Y
Minimum fluctuation:
0.001 Index points (1/10th basis point per annum) = $1.00
Disclaimer:
• What presented here is not a recommendation, please consult your licensed broker.
• Our mission is to create lateral thinking skills for every investor and trader, knowing when to take a calculated risk with market uncertainty and a bolder risk when opportunity arises.
CME Real-time Market Data help identify trading set-ups in real-time and express my market views. If you have futures in your trading portfolio, you can check out on CME Group data plans available that suit your trading needs www.tradingview.com
 Education
We are close folks. 2 year bond market close to shift to a downtrend that could be trigger a major correction on spy . Recession time ahead folks
Short Short
Short
US 10Y TREASURY: June inflation and PPIMarkets reacted to released unemployment data during the previous week. The increasing unemployment to 4.1% in June from 4.0% in May was an indication to investors of a possibility that inflation pressures will slow down on decreased employment and that it will provide the necessary space for the Fed to cut interest rates in September. After struggling to sustain yields during the past several weeks, the market finally reacted in a relaxed manner during the previous week, by bringing the 10Y benchmark yields down to 4.28% on Friday. Yields started the week around level of 4.48%.
For the week ahead, it should be considered that June inflation and PPI data will be published. Although surprises in inflation data are not expected, still, in case that posted figures do not fit market expectations, the market will correct current pricing. As per current charts, the level of 4.20% is indicated as the next level to be tested. However, some volatility might be expected, but not higher from 4.30%.

Can higher projected US02Y impact GOLD price ?TVC:US02Y has been trading to attractive levels fibonacci levels of 50% resulting in formation of bullish flag. Price is projected to go to 5.5% according to flag pattern. Recent NFP had higher than expected unemployment claims. Will this scenario attract investors to buy more bongs ?
What do you think will be impact of bullish bonds yield to the price of GOLD ?
Long
Be careful when the RSI for the US10Y gets to 46. For the DOT COM crash + Financial Crisis crash, the market tops happened when US10Y monthly RSI touched 46. Only downhill after.
Pay attention!
Short
US01Y Treasury Head and ShouldersBeen watching the US01Y treasury as its chart patterns certainly are just as valid as normal stocks, but it really reflects the basis of the whole US economy being highly correlated to the fed interest rate.
Right now we have a very well-defined head and shoulders pattern after quite the straight line up from near-zero from the covid era.
The action this week in particular is interesting, in that it may be starting to reveal an initial tipping point.
Up until this week, I wasn't sure if it was going to be a head-and-shoulders fakeout leading to a continued uptrend in rates, but this looks more like the possible beginning of a new trend back down, **if this decline continues over the next few weeks...**
The 200-week SMA on the left screen would be a likely target, so somewhere between 2.5% - 3%...
Let's see!
Short
2Yr Yield Rolling Over?And there goes the the 2Yr Yield, it is whimpering.
Unless something happens this is rolling over further.
10Yr Yield had a nice bounce but it is also rolling over.
TVC:TNX is only 33 basis points from normalization!
Short term #yield is looking very weak, 6 month and 1 Yr, not shown.
More info see profile...
