The Bond Shark Attack.The bond yield has taken its first dive to the 0.88 level, and according to the ever-so-fishy harmonic shark pattern , we’re bracing ourselves for a dramatic tumble at the 1.138 level.
Now, what does this mean for the stock market? Well, think of it as a domino effect but with a flair for drama.
Investors might start sweating over higher borrowing costs, causing a ripple of caution through equities.
Government bonds
US GOVERMENT 10 YEAR BOND YIELD US10Y Among the US Treasury bond yields—2-year (US02Y), 10-year (US10Y), and 30-year (US30Y)—the 10-year Treasury yield (US10Y) generally reflects the strength of the US Dollar Index (DXY) most closely.
Explanation:
The US10Y yield is widely followed by currency traders and investors as a key indicator of market sentiment, interest rate expectations, and economic outlook. It balances short-term monetary policy effects and long-term growth/inflation expectations, making it a comprehensive gauge for the
The break-up (a must-watch chart)One of the most important—and unusual—developments in the market right now is the combination of rising US bond yields and a falling US dollar.
Normally, when bond yields go up, the dollar strengthens. It's similar to a high-interest bank account: if you can earn more by holding US assets, global investors tend to pile in, increasing demand for the dollar.
But that’s not what we’re seeing today.
Instead, yields are rising while the dollar weakens—something that’s more often associated with eme
JAPAN GOVERMENT 10 YEAR BOND YIELD JP10YJP10Y, Yen Strength, and Bond Price Correlation
Key Relationships
JP10Y (Yield) and Bond Price:
Inverse Correlation: Bond prices and yields move inversely. When Japan’s 10-year government bond yield (JP10Y) rises, bond prices fall, and vice versa.
JP10Y (Yield) and Yen Strength:
Positive Correlation (Typically): Rising JP10Y often strengthens the yen (JPY) by attracting foreign capital into Japanese bonds. Higher yields make yen-denominated assets more attractive, increasing demand for JPY.
Exce
UK GOVERMENT 10 YEAR BOND YIELD The correlation between the UK 10-year gilt yield (GB10Y) and GBP currency strength is nuanced and influenced by multiple factors, as of May 2025:
Key Points on GB10Y and GBP Strength Correlation
The UK 10-year gilt yield recently rose to 4.77%, its highest since April 2025, driven by hotter-than-expected inflation data (CPI at 3.5% YoY, above forecasts) and reduced market expectations for Bank of England (BoE) rate cuts this year.
Typically, higher gilt yields attract foreign investment, increa
apan’s Bond Market Is Flashing Alarms – Carry Trade at Risk?🚨 Japan just witnessed its weakest 20-Year Government Bond auction since 1987, triggering a spike in long-dated yields:
📉 Bid-to-cover ratio at lowest since 2012
📉 Tail (spread between avg. & lowest accepted bid) was massive
📈 40Y JGB yield hit all-time highs
📈 30Y at highest since it was introduced in 1999
📈 20Y at highest level since 2000
This is a BIBLICAL move in the JGB complex.
📌 The implications?
Japan’s carry trade—a pillar of global liquidity—could be under pressure
Global bond
US 10Y OUTLOOK FOR THE WEEK MAY 19-23 (UPDATED DAILY)US 10y Treasury Outlook for the Week May 19-23,2025
May 19, 2025
Friday Fundamental Recap
U.S. Treasuries rose, with the 30-yr yield nearing its mid-January peak (5.005%). Gains followed Japan’s Q1 GDP contraction (-0.2%; expected -0.1%) and a strong eurozone trade surplus (EUR36.8 bln; expected EUR17.5 bln). Weak U.S. data—April Housing Starts and May Consumer Sentiment—limited gains and Moody’s U.S. credit downgrade from Aaa to Aa1 on May 16, citing $36 trillion debt, pushed yields higher.
20
US 10Y TREASURY: US downgradeThere is no rest for US Treasuries. The minute the trade tensions between the US and China were settled, at least for the period of 90 days, a new storm hit the market throughout rising concerns over the sustainability of the US debt. At least as this sustainability is perceived by the rating agency Moody’s, which downgraded the US sovereign rating by one notch late Friday. This news had an negative impact on the investors sentiment, but the most volatility in the US Treasury yields occurred in
US30Y : Not perfect anymoreS&P in 2011
Fitch in 2023
Now Moody downgraded it from AAA to Aa1
The reason is clear. The market thinks debt and interest payments are not sustainable for the US, Europe, Japan, and elsewhere. Bottom line: Nowhere is safe. No government bond is safe.
If it keeps climbing, above 5.25%, the Fed will have to act. The only way is QE. However, this time US will print to save just itself. No more life line swaps for the rest. Tariff would be in place. No trade with uncle SAM anymore. If you reject
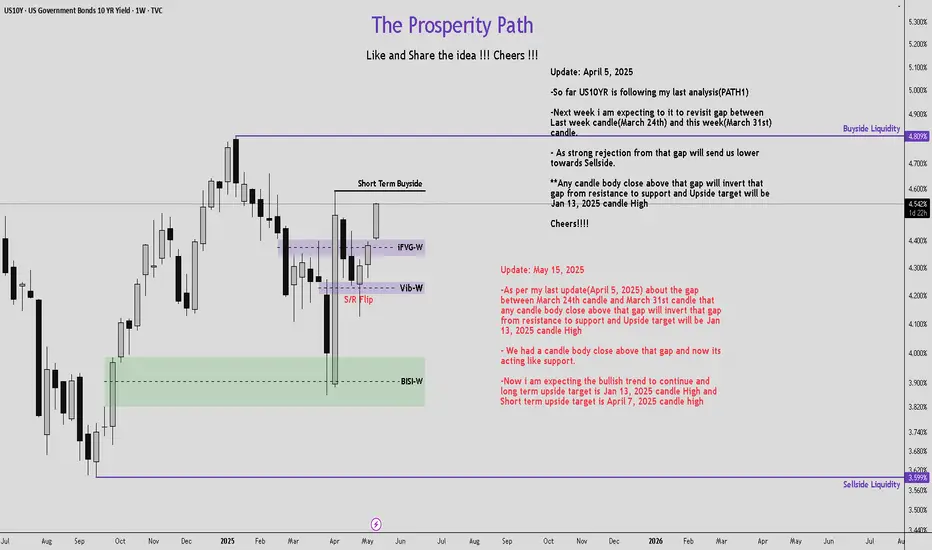
US10 YR Yield Weekly Chart Analysis: NFAUpdate: May 15, 2025
-As per my last update(April 5, 2025) about the gap between March 24th candle and March 31st candle that any candle body close above that gap will invert that gap from resistance to support and Upside target will be Jan 13, 2025 candle High
- We had a candle body close above that gap and now its acting like support.
-Now i am expecting the bullish trend to continue and long term upside target is Jan 13, 2025 candle High and Short term upside target is April 7, 2025 candl
US10 YR Yield Weekly Chart Analysis: NFAUS10 YR Yield Weekly Chart Analysis: NFA
-After sweeping the previous swing high we retraced back to 50% Fib(Equilibrium)
-Expecting this Week's candle wick to sweep Sellside Liquidity-1 and bounce
-If we bounce from here, iFVG-W (red rectangle) will be our resistance zone
-Rejection from that level can send it back to sellside and our next target will be BISI-W(green rectangle)
If any of these Support/Resistance levels are invalidated i will update the idea next week.
**Major economic e
"The President wants lower rates"On February 5th we heard the following from US Treasury Secretary:
“The president wants lower rates,” Bessent said in an interview with Larry Kudlow, “He and I are focused on the 10-year Treasury and what is the yield of that.”
Bessent has further stated:
“He wants lower rates. He is not calling for the Fed to lower rates,” Bessent said. Trump believes that “if we deregulate the economy, if we get this tax bill done, if we get energy down, then rates will take care of themselves and the dollar
US 10Y TREASURY: tariffs negotiationsAnother rollercoaster of US Treasury yields calmed down after the FOMC meeting held during the previous week. As expected, the Fed did not make any changes to the current levels of interest rates. However, in case that trade tariffs cause some harm to the US economy, the Fed is in position to react swiftly. The economy is still growing at a solid pace, as Fed officials see it, and the jobs market is relatively strong while the inflation is still on the target to reach gradually 2% in the coming
US 10Y Monthly, Weekly and Daily Bias(note ill be using the charting tool Trading view for faster annotations for multi-timeframe analysis)
A. Please check relevant US Economic news that might influence price action {eco us }
May 13 US Cpi & Inflation day
May 15 Jobless Claims, Retail sales, PPI, Empire Mfg Index, Fed Powell Speech
May 16 Housing Starts
you may also access in the web and filter the high impact news feed (www.myfxbook.com)
B. Monthly Range
Price action is currently confined to April range h
US10Y - Yield Volatility Amid Fed Policy StanceThe 10-year Treasury yield fluctuated between 4.30% and 4.39% this week, closing at 4.382% on May 9.
The Federal Reserve maintained benchmark rates at 4.50%, dismissing pressure from the Trump administration for cuts. Chair Powell emphasised persistent inflationary risks and labor market stability, reinforcing a cautious "higher-for-longer" stance.
4.400% intermediate term buyside liquidity is a point of interest going forward.
How US01Y may relate to stock crashesUsing the 200 Week Moving Average,
we spot that stock crashes often relate with drop in short term bond yields.
Prior to 2008, yield rates usually drop by a few percents by hardly below 0.5%.
However since QE in 2008, bond yield decrease to a nearly 0% level.
These features allow us to spot these financial crisis on the graph easily.
However, whether if this indicator is leading indicator or lagging indicator requires future research.
The Long, Flat Road AheadWith the Federal Reserve’s rate decision in focus, I wanted to revise a previous idea that called for 6% on the 10 year T-bill, and provide a clearer read on what I’m seeing as the larger trend, which could provide important clues for the future of everything from monetary policy, to mortgage rates, and stocks.
Starting with the 500R chart, I think we are seeing a clear flat correction form, with the current segment of the trend being Wave C of (B). In a flat correction, the endpoint of (B)