Long
Long

US 10Y TREASURY: Oil decline lifts bonds U.S. Treasury yields moved lower over the week, with the 10Y benchmark easing to 4,43%, as markets reacted to improving geopolitical sentiment surrounding a potential U.S.–Iran agreement. Hopes that a deal could reopen the Strait of Hormuz helped drive a sharp decline in oil prices, reducing near-term inflation concerns tied to energy costs and easing pressure on the long end of the curve. While headline inflation has remained elevated due to earlier energy shocks, recent developments suggest that further upside pressure may be limited if oil supply disruptions continue to ease. This has supported demand for Treasuries, particularly in the 10Y sector, as investors reassess the persistence of inflation risks.
Thursday brought a sharp drop in yields from the previous level of 4,56%. Yields closed the week at 4,48%. However, the week ahead will bring back some nervousness as the next FOMC meeting is scheduled for Wednesday. Not only that the Fed will discuss interest rates, but this meeting will be a debut for the new Fed Chair Warsh. Some modest reversal in yields should not be a surprise. The level of 4,5% could be tested again, while the market sentiment will decide whether this level will be breached, or the markets will continue with the correction.
US10Y UNITED STATES GOVERNMENT 10YEAR TREASURY BONDYIELD.The United States government 10year treasury yields rejected by monthly Supplyroof at 4.671%,break and close above this zone could target 5.0% yearly.
Core PPI m/m 0.4% 0.5% 0.7%
USD PPI m/m 1.1% 0.7% 1.1%
Unemployment Claims 229K 220K
• Headline PPI m/m: Actual 1.1% (vs. forecast 0.7%, previous 1.1%). This came in notably hotter than expected. Year-over-year, it rose to 6.5% (highest since late 2022), driven heavily by energy/goods prices — especially a big jump in gasoline (~23% contribution to the goods increase). 
• Core PPI m/m (ex-food & energy): Actual 0.4% (vs. forecast 0.5%, previous 0.7%). This was slightly softer than expected and a clear slowdown from the prior month. Year-over-year core was around 4.9%, also below forecasts. 
Overall takeaway on inflation: Headline PPI shows persistent upward pressure, largely from volatile energy/fuel costs (goods prices +2.8% m/m). However, the core measure — which better reflects underlying trends — cooled, suggesting the surge isn’t fully broad-based yet. Services prices rose more modestly (+0.3%). This mix indicates cost pressures remain elevated but may not be accelerating as aggressively in underlying components. 
Unemployment Claims Interpretation
• Actual 229K (vs. forecast ~220K, previous 225K). This was a modest increase and the highest in about three months, with the 4-week average also ticking up slightly to ~219K. 
Overall takeaway on labor market: Still historically low and indicative of a resilient (but gradually softening) jobs market. No signs of sharp deterioration, but the uptick adds to a narrative of cooling momentum amid other recent data.
What is US10Y?
US10Y (or US 10-Year Treasury Yield) refers to the yield (effective interest rate) on the U.S. government’s 10-year Treasury note. 
It is a key benchmark in global finance, often quoted in real-time . Investors buy these notes, and the yield reflects the return they demand for lending money to the U.S. government for 10 years. Yields move inversely to bond prices: when demand for Treasuries rises (prices up), yields fall, and vice versa. 
How It Works
• The U.S. Treasury issues these notes to finance government debt.
• The yield is determined by market trading (supply and demand), not directly set by the government.
• It incorporates expectations about future inflation, economic growth, Fed policy, and global risks.
Relationship to the Federal Reserve’s Interest Rates (Fed Funds Rate)
The Federal Reserve primarily controls the federal funds rate — a short-term overnight rate that banks lend to each other. This is the Fed’s main policy tool for influencing the economy (e.g., raising it to fight inflation or cutting it to stimulate growth). 
The US10Y and Fed funds rate are connected but distinct:
1. Fed influences the 10Y yield (but doesn’t control it directly):
• Changes in the fed funds rate affect short-term rates strongly and ripple into longer-term yields like the 10-year.
• Rate hikes by the Fed typically push 10Y yields higher (as markets anticipate sustained higher rates).
• Rate cuts typically pull 10Y yields lower.
• However, the 10Y is also driven by market expectations of future Fed actions, inflation, and growth — not just current policy. This is why yields can sometimes move independently (the famous “conundrum” where long-term yields didn’t follow short-term rates as expected). 
2. 10Y yield influences or signals to the Fed:
• A rising 10Y yield can signal stronger growth or higher inflation expectations, which might reduce the need for Fed rate cuts (or prompt tighter policy).
• A falling 10Y yield often signals economic weakness or lower inflation, pressuring the Fed to cut rates.
In short: The Fed sets short-term rates → this shapes market expectations → which heavily influence the 10Y yield. But the 10Y yield also acts as a market “vote” on the economy, feeding back into the Fed’s decision-making. 
Why It Matters
• Benchmark for other rates: Mortgages, corporate bonds, car loans, etc., are often priced off the 10Y yield.
• Economic indicator: Higher yields can tighten financial conditions (hurting stocks/housing); lower yields ease them.
• Global impact: As a safe-haven asset, U.S. 10Y yields affect capital flows worldwide.
#US10Y
Long 
 Long
Long
US 10Y TREASURY: Macro drives yield bounce The U.S. 10-year Treasury yields were traded higher on Friday, moving back to 4,53% level. Market participants focused on labor-market indicators throughout the week, seeking clues about the future path of Federal Reserve policy. While softer economic data initially supported expectations for rate cuts, stronger-than-expected payroll figures released later reinforced the view that the Fed may keep interest rates elevated for longer, limiting the decline in yields and supporting the U.S. dollar.
The lowest weekly level was at 4,42%, however, macro data and investor expectations pushed yields back to higher grounds. The week ahead brings few important macro data like Inflation rate in May, Producers Price Index in May and the University of Michigan Consumer Sentiment preliminary for June on Friday. It implies that higher volatility might continue on the US Treasury market. There is some probability for relaxation of yields back to 4,5%. However, if data continue to further support current investors sentiment, then there might also be some probability for even 4,6% level. At this point there is a lower probability for such a move.
Education 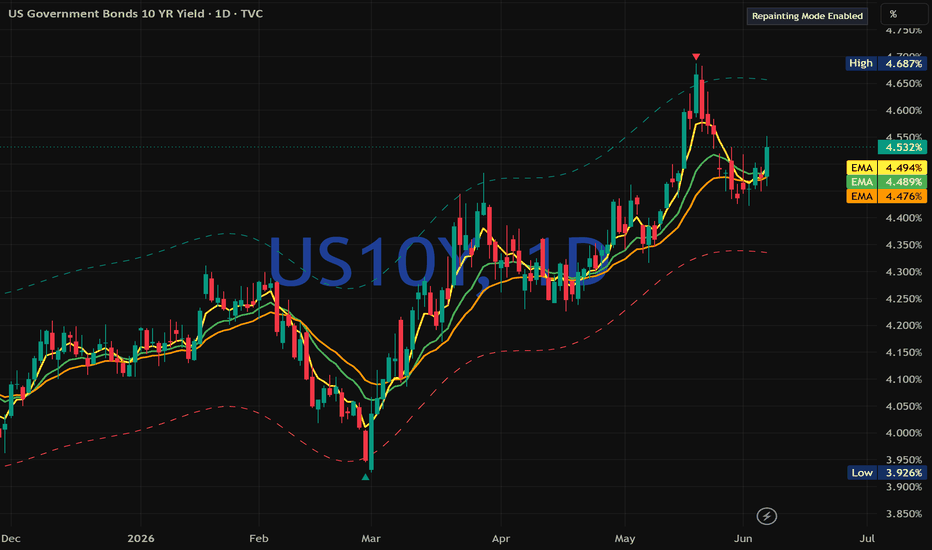
Long 
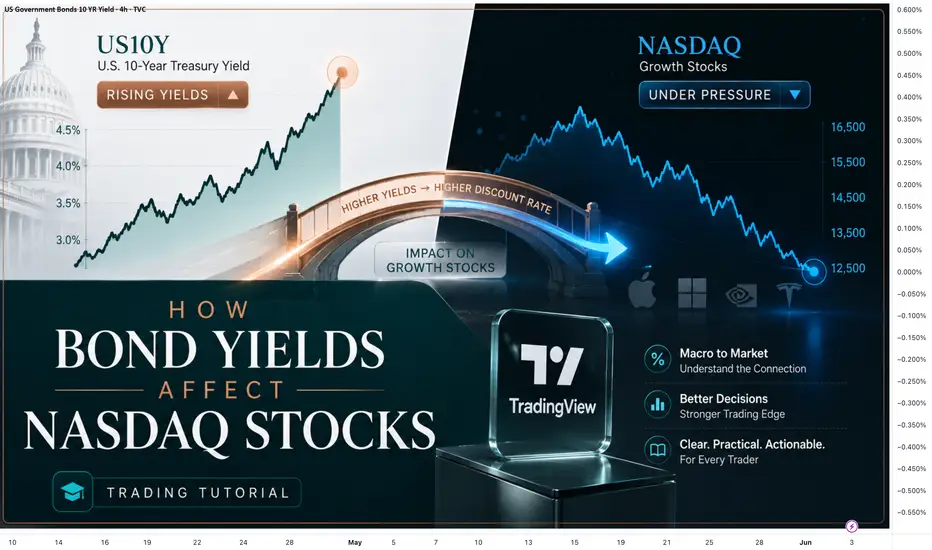
How Bond Yields Affect NASDAQ StocksMany traders watch only the stock chart, but sometimes the real pressure on the market comes from outside the chart.
One important thing NASDAQ traders should understand is the relationship between bond yields and growth stocks.
NASDAQ is heavily influenced by technology and growth companies. These companies are often valued based on future earnings. When bond yields rise, the market starts discounting those future earnings more aggressively. In simple words, higher yields can make future profits look less valuable today.
That is why NASDAQ can sometimes struggle when yields are rising.
Why does this happen?
When the U.S. 10-Year Treasury Yield rises, it usually means borrowing costs are becoming higher. Higher borrowing costs can create pressure on companies, especially growth companies that depend on expansion, investment, and future earnings expectations.
At the same time, higher yields can make bonds more attractive compared to stocks. So some investors may reduce risk in equities and move toward safer yield-based assets.
This does not mean NASDAQ must fall every time yields rise. Markets are not that simple. But rising yields can create pressure, especially when NASDAQ is already overextended or near resistance.
How I use this as a trader
I do not use bond yields as a direct buy or sell signal.
Instead, I use them as background information.
For example:
If NASDAQ is breaking resistance while yields are falling, the breakout may have stronger support.
But if NASDAQ is trying to move higher while yields are rising sharply, I become more careful. The stock chart may look bullish, but the macro pressure is still there.
This helps me avoid blindly chasing moves.
Simple way to understand it
Rising yields = more pressure on growth stocks.
Falling yields = more breathing room for growth stocks.
But the final decision should still come from price action, structure, support, resistance, and risk management.
What traders can watch
1. Is US10Y rising or falling?
2. Is NASDAQ near support or resistance?
3. Is price making higher highs or lower highs?
4. Is the move supported by volume and structure?
5. Is the trade still worth the risk?
The main lesson is simple:
Do not analyze NASDAQ alone.
Sometimes the bond market gives an early warning before the stock chart fully reacts.
For me, this is not about predicting every move perfectly. It is about understanding the environment before taking a trade.
A trader who understands both charts and macro conditions can make better decisions than someone who only follows candles.
Do you check bond yields before trading NASDAQ or tech stocks?
Share your view below. I think this is one of the most useful macro relationships every stock trader should learn. Education 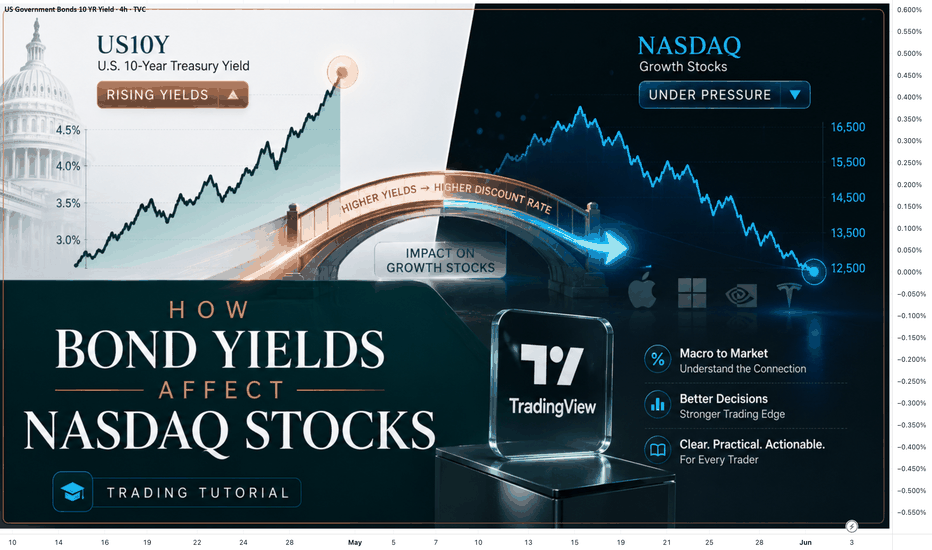
 Long
Long
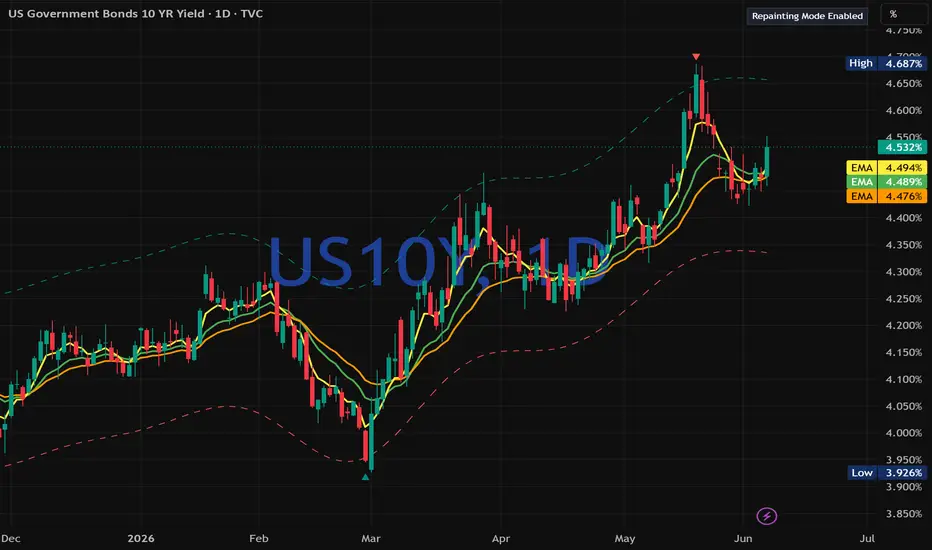
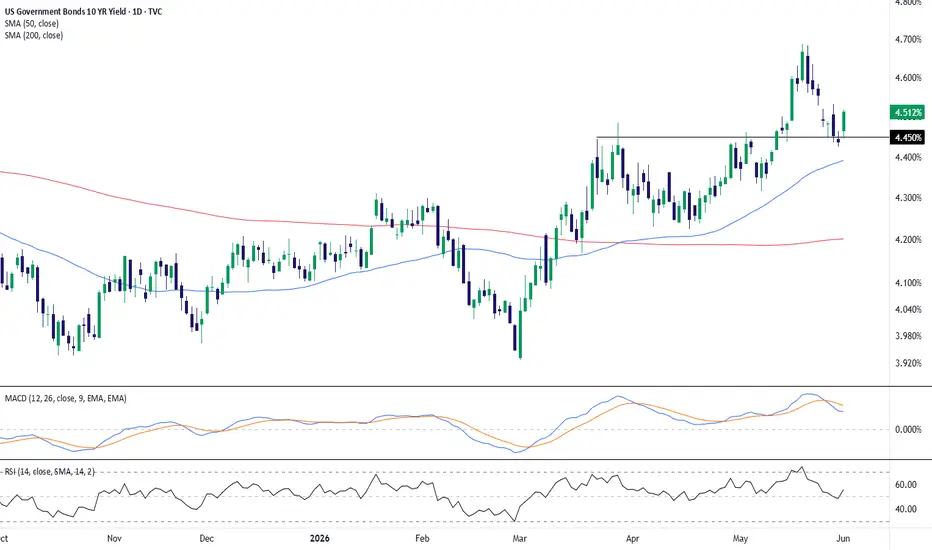
US 10Y Yield Holds Above Key Moving Averages as Momentum CoolsThe US Government Bonds 10-Year Yield remains in an elevated structure on the daily chart, with price holding above both the 50-day SMA near 4.39% and the 200-day SMA near 4.20%. This keeps the broader technical backdrop constructive, as the shorter-term average continues to trend above the longer-term average following the earlier upside shift.
Recent price action shows a pullback from the May high near the 4.70% area, followed by stabilization around the prior breakout zone near 4.45%. The latest candle has moved back above that level, suggesting buyers are attempting to defend former resistance as support. As long as yields remain above the rising 50-day SMA, the near-term structure may continue to lean bullish, though the recent rejection from the highs shows momentum has moderated.
The MACD remains above the zero line but has crossed lower, reflecting cooling upside momentum after the strong May advance. This does not necessarily invalidate the broader trend, but it does suggest the market may be moving from impulse into consolidation. RSI has also eased from elevated territory and is now recovering toward the mid-to-upper range, indicating momentum is no longer stretched while still holding above the neutral zone.
Overall, the chart presents a mildly bullish-to-neutral bias. The uptrend remains supported by price positioning above the 50-day and 200-day moving averages, while MACD and RSI point to a short-term pause after a strong rally. A continued hold above the 4.45% region would support the case for consolidation at higher levels, while weakness back below the 50-day SMA would signal a deeper reset in momentum.
-MW Long 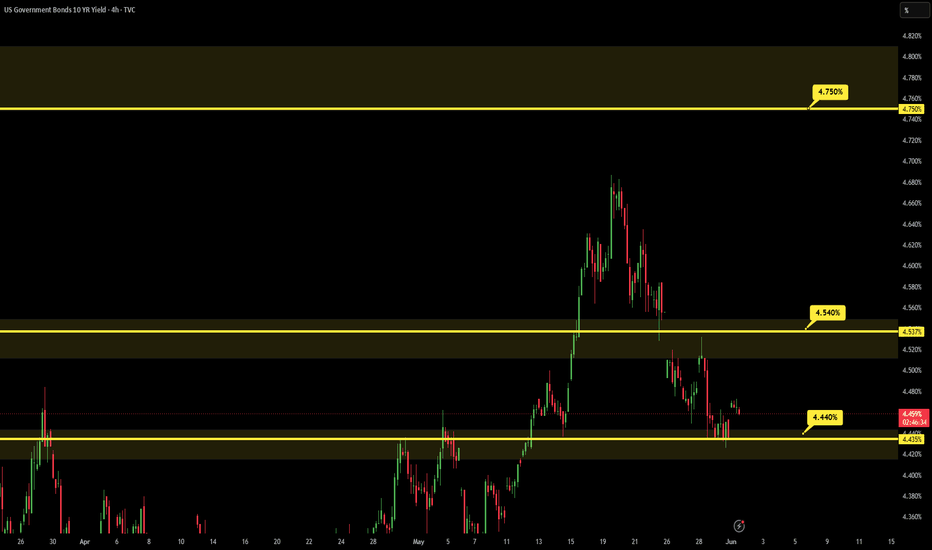
US 10Y TREASURY: this week is all about jobsU.S. 10-year Treasury yields held relatively steady on Friday after retreating from recent highs, as easing tensions between the U.S. and Iran helped reduce inflation concerns tied to energy prices. Softer than expected inflation data, including the latest PCE report, also supported bond markets by reinforcing expectations that the Federal Reserve may avoid further rate hikes in the near term. At the same time, weaker first quarter GDP revisions pointed to slowing economic momentum, adding to demand for Treasuries. Investors are now shifting focus toward the upcoming jobs data for further clues on the Fed’s policy path. The week ahead brings the latest NFP, JOLTs and Unemployment data.
Two weeks ago 10Y yields were standing around 4,68%, however, easing of inflation and positive developments in geopolitics brought yields down to 4,45% where they closed the week. The 4,4% could be shortly tested at the beginning of the week, while there is also some potential for a short reversal, somewhere around 4,5%. The highest volatility is expected around the publication of jobs data.
Long 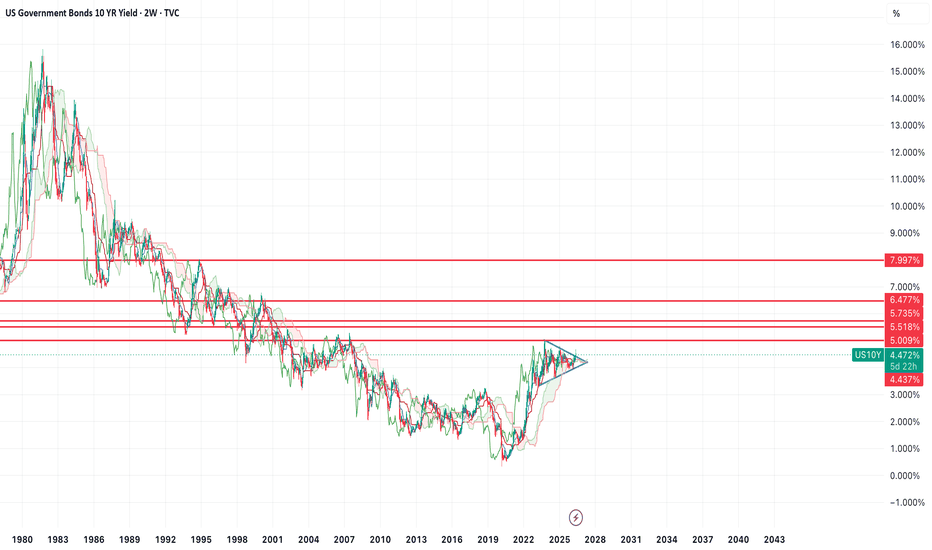
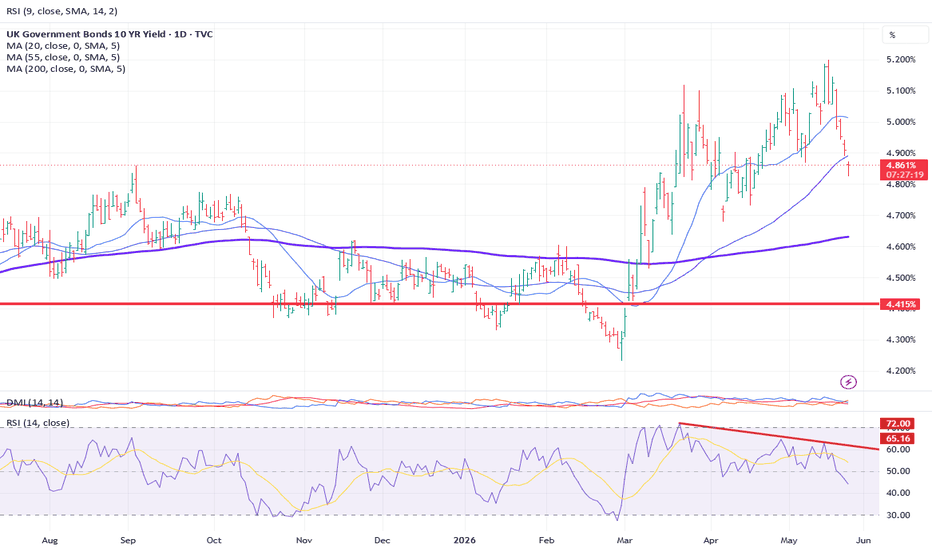
Interest rates: the systemic risk thresholdSince the start of military operations in the Middle East on February 28, long-term bond yields have risen sharply, particularly the long end of the yield curve. This increase in long-term interest rates is explained by a combination of fundamental factors, including rising energy prices, higher inflation, and rising inflation expectations.
As the US 30-year Treasury yield has returned to its October 2023 highs, exceeding the 5% threshold, should we fear a systemic risk for the economy, the state, and corporations? Will Kevin Warsh’s Federal Reserve be forced to raise the federal funds rate or at least adopt a prolonged pause?
It is important to keep the following data in mind:
• The US 30-year Treasury yield has returned to its 2007 highs
• The US 10-year Treasury yield is approaching 5%
• Variable-rate corporate debt represents 40% of total US corporate debt
• However, the systemic risk threshold has not yet been reached; it is estimated to lie closer to 6.5%–7%
In this context, it is essential to clearly distinguish between a regime of elevated financial stress and a true systemic risk scenario. Historically, US bond markets can operate in a 4%–5.5% range on the 10-year yield without triggering a global crisis, provided that nominal growth remains sufficiently strong and financing flows remain functional. The current level mainly reflects a repricing of risk driven by persistent inflation, geopolitical uncertainty, and perceived deterioration in US fiscal balances.
The chart below shows weekly Japanese candlesticks of the US 30-year Treasury yield. It highlights financial risk zones based on the level of the 30-year rate.
The main transmission channel to the economy is not immediate but gradual. US corporations are mostly financed at fixed rates via bond markets, meaning that higher rates do not instantly affect the entire debt stock. However, marginal financing costs rise quickly with each new issuance and refinancing. The presence of around 40% variable-rate debt does accelerate transmission in certain segments, particularly small caps and companies heavily dependent on bank credit.
For the federal government, the situation is also more constrained than in previous cycles. Rising long-term rates mechanically increase the cost of refinancing public debt and raise the federal budget’s sensitivity to market conditions. This does not create a short-term default risk, but it does contribute to a more fragile medium-term debt sustainability dynamic.
Thus, even though the current zone (10-year near 5% and 30-year above 5%) represents a significant level of financial stress, the true systemic breaking point lies higher, around 6.5%–7%, where the cumulative effects on sovereign debt, private credit, and real estate could become simultaneously highly problematic.
The table below describes US financial risk according to the level of the US 10-year Treasury yield. These values also apply to long-term US bond yields, particularly the 30-year rate.
DISCLAIMER:
This content is intended for individuals who are familiar with financial markets and instruments and is for information purposes only. The presented idea (including market commentary, market data and observations) is not a work product of any research department of Swissquote or its affiliates. This material is intended to highlight market action and does not constitute investment, legal or tax advice. If you are a retail investor or lack experience in trading complex financial products, it is advisable to seek professional advice from licensed advisor before making any financial decisions.
This content is not intended to manipulate the market or encourage any specific financial behavior.
Swissquote makes no representation or warranty as to the quality, completeness, accuracy, comprehensiveness or non-infringement of such content. The views expressed are those of the consultant and are provided for educational purposes only. Any information provided relating to a product or market should not be construed as recommending an investment strategy or transaction. Past performance is not a guarantee of future results.
Swissquote and its employees and representatives shall in no event be held liable for any damages or losses arising directly or indirectly from decisions made on the basis of this content.
The use of any third-party brands or trademarks is for information only and does not imply endorsement by Swissquote, or that the trademark owner has authorised Swissquote to promote its products or services.
Swissquote is the marketing brand for the activities of Swissquote Bank Ltd (Switzerland) regulated by FINMA, Swissquote Capital Markets Limited regulated by CySEC (Cyprus), Swissquote Bank Europe SA (Luxembourg) regulated by the CSSF, Swissquote Ltd (UK) regulated by the FCA, Swissquote Financial Services (Malta) Ltd regulated by the Malta Financial Services Authority, Swissquote MEA Ltd. (UAE) regulated by the Dubai Financial Services Authority, Swissquote Pte Ltd (Singapore) regulated by the Monetary Authority of Singapore, Swissquote Asia Limited (Hong Kong) licensed by the Hong Kong Securities and Futures Commission (SFC) and Swissquote South Africa (Pty) Ltd supervised by the FSCA.
Products and services of Swissquote are only intended for those permitted to receive them under local law.
All investments carry a degree of risk. The risk of loss in trading or holding financial instruments can be substantial. The value of financial instruments, including but not limited to stocks, bonds, cryptocurrencies, and other assets, can fluctuate both upwards and downwards. There is a significant risk of financial loss when buying, selling, holding, staking, or investing in these instruments. SQBE makes no recommendations regarding any specific investment, transaction, or the use of any particular investment strategy.
CFDs are complex instruments and come with a high risk of losing money rapidly due to leverage. The vast majority of retail client accounts suffer capital losses when trading in CFDs. You should consider whether you understand how CFDs work and whether you can afford to take the high risk of losing your money.
Digital Assets are unregulated in most countries and consumer protection rules may not apply. As highly volatile speculative investments, Digital Assets are not suitable for investors without a high-risk tolerance. Make sure you understand each Digital Asset before you trade.
Cryptocurrencies are not considered legal tender in some jurisdictions and are subject to regulatory uncertainties.
The use of Internet-based systems can involve high risks, including, but not limited to, fraud, cyber-attacks, network and communication failures, as well as identity theft and phishing attacks related to crypto-assets.
Education 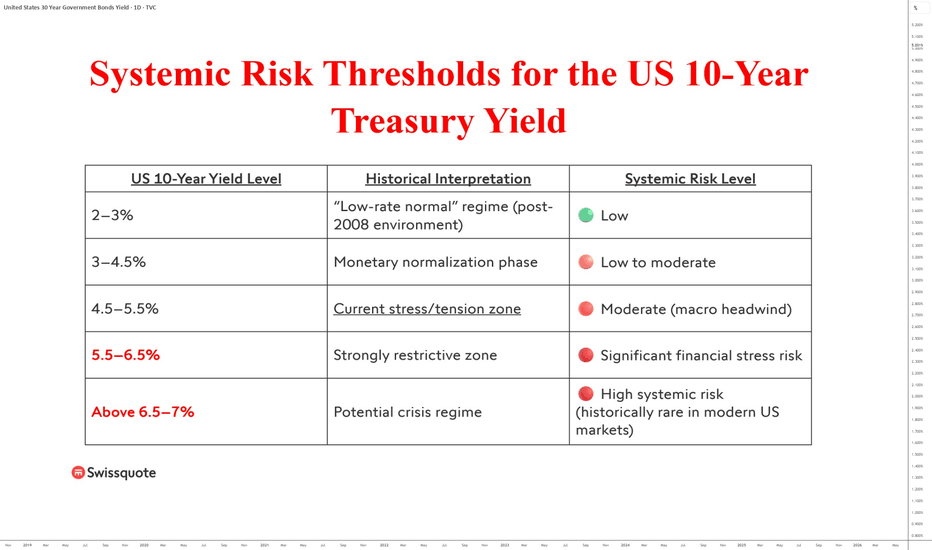
Global Capital Is Flowing Into BondsHello to all TradingView followers and traders 🌍📈
Hope your trades are always filled with profits, clarity, and smart decision-making 💚🔥
Today we’re taking a look at one of the most important indicators in the global financial system: US10Y (U.S. 10-Year Treasury Yield) — a market that directly impacts stocks, gold, the U.S. dollar, and even crypto markets 🏦💵📊
Fundamental Overview of U.S. Treasury Yields 🧠🌎
The U.S. Treasury yield is considered one of the most important indicators of the American economy and usually rises when:
🔹 Interest rates remain elevated 📈
🔹 Inflation stays persistent 🔥
🔹 Investors expect tighter monetary policies 🏛️
🔹 Or when global economic and geopolitical risks increase 🌍⚠️
Over the past few years, rising U.S. government debt, Federal Reserve policies, and inflation concerns have pushed investors back toward the Treasury market 👀📊
At current levels, Treasury yields have become significantly more attractive compared to previous years, which could encourage larger capital inflows into U.S. government bonds 💰🇺🇸
📌 If this flow of capital into Treasuries continues, we could potentially see even higher yields in the coming years from a long-term perspective 🚀📈
US10Y Technical Analysis 📊🔥
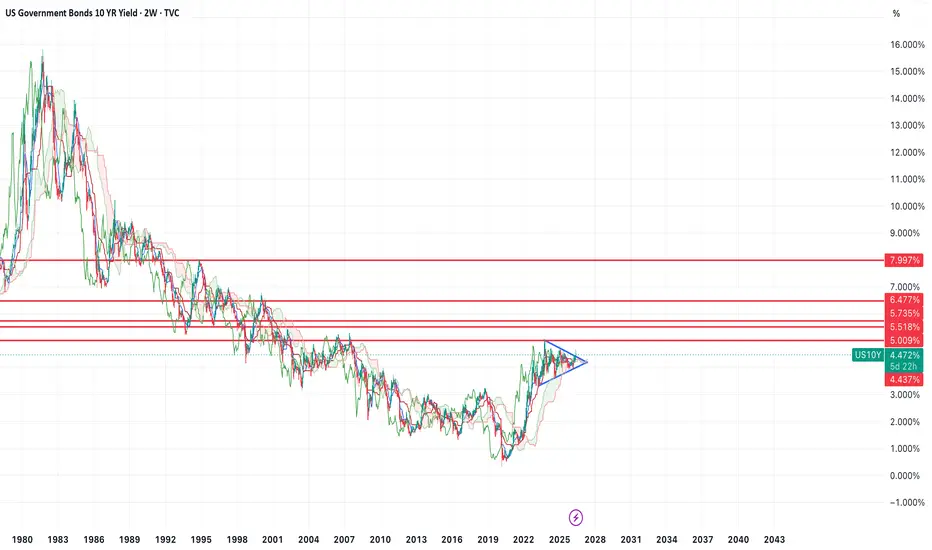
On the long-term and weekly chart, Treasury yields have entered a major bullish structure after years of consolidation and are now trading near a historical resistance zone ⚠️📈
As shown on the chart, the market is compressing between a rising dynamic support trendline and a key historical resistance area 🧠📊
Key Chart Observations 📌
🔹 The overall long-term trend remains bullish 🟢
🔹 The ascending dynamic trendline is still supporting price 📈
🔹 The historical resistance zone is a critical market level 🚨
🔹 Increasing momentum could lead to a breakout and continuation higher ⚡
Bullish Scenario 🚀📈
📍 If Treasury yields manage to break above the highlighted resistance zone, we could enter a new phase of yield expansion 🔥
🎯 Potential targets:
5% area
Then potentially higher levels if inflationary pressures and restrictive Federal Reserve policies continue 📊🏦
📌 This scenario could create significant pressure on equities, gold, and other risk assets ⚠️
Corrective Scenario 📉
However, if the market fails to break the historical resistance zone, a correction toward lower support levels could still happen 🔄📉
In this case, price reaction to the ascending dynamic support trendline will likely determine the next major direction 🧠⚡
Final Thoughts 💡
Overall, considering the current global economic conditions, monetary policy environment, and technical structure, the long-term bias still leans toward higher Treasury yields 📈🇺🇸
And if capital continues flowing into the bond market, the possibility of seeing even higher yields over the coming years cannot be ignored 🚀🌎
Poll 📊🤔
What’s your opinion on US10Y? 👀
🔘 Treasury yields will break resistance and move higher 🚀
🔘 The market will enter a correction 📉
🔘 Yields will continue ranging in this zone 🔄
Make sure to share your thoughts in the comments 💬👇
⚠️ Disclaimer
This analysis reflects personal opinion only and is not financial advice or a buy/sell signal.
Always do your own research and apply proper risk management before making any financial decision. 📌
#US10Y #Bonds #TreasuryYield #FederalReserve #MacroAnalysis #TechnicalAnalysis #TradingView #USBonds #InterestRates #Inflation #MarketAnalysis #PriceAction #Investing #MacroEconomics #BondMarket Long 
US 10Y TREASURY: focused on PCE dataU.S. Treasury markets remained volatile this week, with the 10-year Treasury yield holding near multi-month highs. On Friday last week 10Y yields reached 4,6% levels, however, Monday and Tuesday this week impact strong further movement toward the upside. The highest weekly level was at 4,69%, while yields are closing the week at 4,57%. Investors continue to reassess the outlook for inflation, Federal Reserve policy, and economic growth. Persistent inflation concerns, supported by elevated oil prices and resilient economic data, reinforced expectations that the Fed could maintain higher interest rates for longer. Markets also reacted to uncertainty surrounding future government borrowing needs and fiscal spending, which continued to pressure longer-dated bond yields higher.
Investors are now closely monitoring upcoming PCE inflation data and additional economic indicators for clearer signals on the direction of monetary policy and the near-term trend in Treasury yields. In this sense, the higher volatility might continue also in the week ahead. At this point there is equal probability for yield movements. On a longer time scale, if yields continue to hold levels above the 4,6%, then the next target might be 4,8%. However, for the week ahead testing of 4,5% is still quite a possible scenario for 10Y yield movements.