Long
Long
US10Y Is Pushing Higher _ And Other Markets Feel ItToday I’m back with a fresh U.S. 10-Year Government Bond Yield ( TVC:US10 ) view. This index is a major macro gauge, and when it trends higher it can pressure risk assets like US equities, Gold ( OANDA:XAUUSD ), Silver ( OANDA:XAGUSD ), and crypto, especially Bitcoin ( BINANCE:BTCUSDT ). It’s worth keeping on your chart. In the previous analysis , the bullish path played out, and key targets were reached.
Right now, US10Y has broken above its resistance line and is moving near a resistance zone(4.81%-4.62%).
From an Elliott Wave perspective, a five-wave impulsive advance may be developing.
I expect US10Y to challenge and potentially break that resistance zone(4.81%-4.62%); if momentum expands, higher targets become likely.
First Target: 4.73%
Second Target: 4.91%
Stop Loss(SL): 4.43%
------------
How Rising 10-Year Bond Yields Influence Major Assets
When 10-year government bond yields move higher, they tend to reshape investor behavior across markets:
Bitcoin( BINANCE:BTCUSDT ) & Cryptocurrencies
As yields climb, capital often rotates toward safer, income-generating assets like bonds. This shift can reduce demand for high-risk assets such as Bitcoin, potentially leading to price pressure.
Gold( OANDA:XAUUSD )
Gold typically struggles in a rising-yield environment. Since it doesn’t generate income, higher bond yields increase the opportunity cost of holding gold, which can weigh on its price.
U.S. Equities
Stocks, especially growth and tech sectors, may face headwinds. Higher yields usually mean higher borrowing costs, which can compress margins and slow down expansion for companies reliant on financing.
------------
What’s your view on US10Y? Can it break the resistance zone(4.81%-4.62%) and weigh on other markets?
💡 Please respect each other's opinions and express agreement or disagreement politely.
📌 US 10-Year Government Bond Yield Analyze (US10Y%), Daily time frame.
🛑 Always set a Stop Loss(SL) for every position you open.
✅ This is just my idea; I’d love to see your thoughts too!
🔥 If you find it helpful, please BOOST this post and share it with your friends. Long 
US10Y bullish prediction is still intact from previous chart The united states 10year treasury at 4.627% in the fx window. The monthly chart shows enormous upswing potential based on the breakout of the monthly supply roof ,on technical i need a pull back as retest candle to the broken supply roof to go long and target 5.2%
the flip side will be a break and close of the current ascending trendline and the target will be 3.3%-3.4% zone .
the structure is showing me a bullish potential
what is US10Y???
The 10-year Treasury note is a debt security issued by the U.S. government with a 10-year maturity, paying fixed interest semiannually. US10Y specifically denotes its current yield—the effective annual return if bought today—which fluctuates based on market demand.
This yield serves as a "risk-free" rate benchmark, influencing mortgage rates, corporate bonds, and stock valuations. Rising yields often signal economic growth or inflation expectations, while falling yields may indicate recession fear.
US10Y, the yield on the 10-year U.S. Treasury note, moves inversely to its price and is heavily influenced by prevailing interest rates set by the Federal Reserve and market expectations.
Fed Policy Impact
When the Fed raises short-term rates (like the federal funds rate) to combat inflation, new Treasuries offer higher coupons, causing existing bond prices to fall and US10Y yields to rise. Rate cuts have the opposite effect: lower yields on new issues boost demand for existing bonds, pushing US10Y down.
if investors anticipate prolonged high rates, US10Y climbs as a risk premium builds in. Inflation plays a role too—higher inflation erodes fixed payments, demanding elevated yields
Treasury notes and bonds are U.S. government debt securities backed by the full faith and credit of the U.S. government. Their yields represent the effective annual return investors earn based on current market prices.
(1)Treasury Notes
Treasury notes (T-notes) have maturities from 2 to 10 years and pay semiannual interest at a fixed coupon rate set at auction. Yield is the total return if held to maturity, rising when prices fall due to higher market rates.
(2)Treasury Bonds
Treasury bonds (T-bonds) mature in 20 or 30 years, also paying interest every six months. They typically offer higher yields than notes to compensate for longer-term interest rate and inflation risks.
(3)Yield Mechanics
Yield to maturity accounts for interest payments, price paid, and face value at maturity; it moves inversely to price—higher yields when bond prices drop amid rising rates. Current yield is simply annual interest divided by current price. Longer maturities generally yield more, except in inverted yield curves.
(4)A coupon is the periodic interest payment made by a bond issuer to bondholders, typically expressed as a fixed annual percentage of the bond's face (par) value. It's set at issuance and paid semiannually until maturity.
How It Works
For a $1,000 bond with a 5% coupon rate, the annual coupon payment totals $50—often split into two $25 payments every six months. This differs from yield, which fluctuates with market prices; the coupon rate remains fixed.
Relation to Treasuries
In U.S. Treasury notes and bonds (like the US10Y), coupons provide steady income alongside principal repayment at maturity, making them low-risk investments. Zero-coupon bonds pay no coupons but sell at a discount for equivalent yield.
Coupon rate and yield to maturity (YTM) both relate to bond returns but measure different aspects.
Coupon Rate
This is the fixed annual interest rate stated on the bond, expressed as a percentage of its face (par) value, paid periodically (often semiannually). It never changes over the bond's life; for a $1,000 bond with a 5% coupon, you get $50 yearly regardless of market price.
Yield to Maturity
YTM estimates the total annualized return if held to maturity, factoring in coupon payments, time to maturity, face value repayment, and current market price. It equals the coupon rate only when bought , otherwise, it adjusts for discounts (higher YTM) or premiums (lower YTM).
(5)Zero-coupon bonds are debt securities that pay no periodic interest (coupons) during their term. Investors buy them at a deep discount to face value and receive the full par amount at maturity, with the difference representing compounded interest.
How They Work
Unlike regular coupon bonds, zeros provide a single lump-sum payment at maturity, often 10+ years out; for example, a $10,000 face value bond might cost $3,500 today. The yield comes from price appreciation, making them sensitive to interest rate changes.
(6)Treasury STRIPS (Separate Trading of Registered Interest and Principal Securities) are common zeros created by stripping coupons from T-notes or bonds. They're ideal for long-term goals like retirement due to predictable payouts and low risk.
HOW YIELD AFFECT STOCK MARKET.
Rising bond yields, like US10Y, often pressure stock markets by increasing competition from "risk-free" fixed-income returns and raising corporate borrowing costs.
Valuation Impact
Higher yields discount future corporate earnings more heavily in models like DCF, lowering present values and stock prices—especially for growth stocks reliant on distant cash flows.
Opportunity Cost
Bonds become more attractive than equities for income, prompting investors to shift funds and sell stocks.
Economic Effects
Elevated yields signal tighter credit, slowing growth, squeezing profit margins, and hurting cyclical sectors.
Exceptions
If yields rise with strong growth (not inflation fears), stocks can rally; rapid yield spikes historically challenge equities
this is just for educational purposes only,pls do your own.
#us10y #us10 #bonds #yield .#bond yield.
Long 
US10Y Is Waking Up — Major Markets Could Feel It!Today, we’re taking a closer look at the U.S. 10-Year Government Bond Yield ( TVC:US10 ) on the daily timeframe. This metric reflects the return investors earn from holding 10-year U.S. Treasury bonds and serves as a key indicator of market sentiment toward the U.S. economy. Because of its importance, movements in this yield play a major role in shaping capital flows across different asset classes and influencing overall financial conditions.
------------
Let’s look at US10Y on the daily timeframe—come along with me!
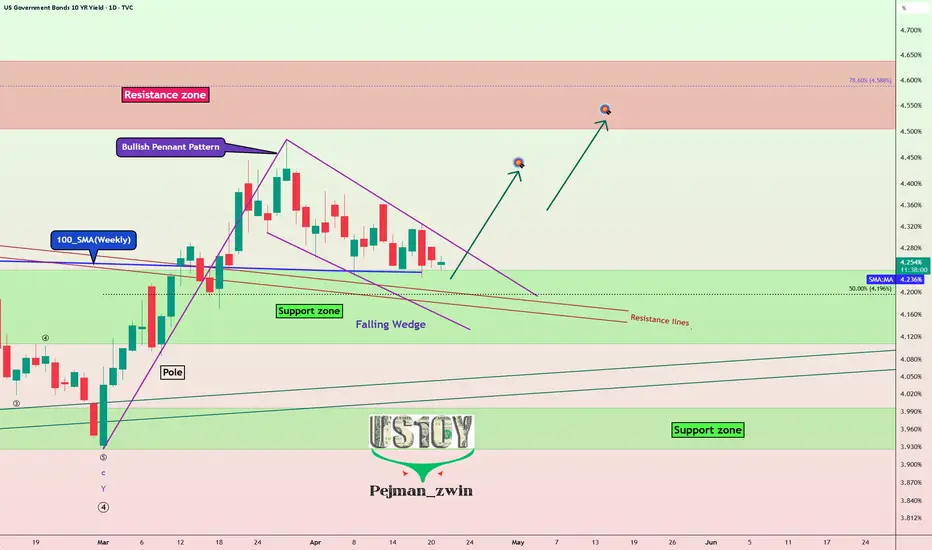
US10Y is currently near a support zone (4.24%-4.10%) and the 100_SMA (Weekly). It appears to be completing a pullback to the resistance lines it previously broke.
From a classical technical perspective, US10Y has formed a Bullish Pennant Pattern.
From an Elliott Wave perspective, it looks like US10Y has completed its main wave 4. With the bullish pennant pattern and a break of the resistance lines, we could see a new impulsive upward wave.
I expect US10Y, after breaking the upper line of the falling wedge, to gain at least about 4.43%.
First Target: 4.43%
Second Target: Resistance zone(4.64%-4.50%)
Stop Loss(SL): 4.15%
------------
How Rising 10-Year Bond Yields Influence Major Assets
When 10-year government bond yields move higher, they tend to reshape investor behavior across markets:
Bitcoin( BINANCE:BTCUSDT ) & Cryptocurrencies
As yields climb, capital often rotates toward safer, income-generating assets like bonds. This shift can reduce demand for high-risk assets such as Bitcoin, potentially leading to price pressure.
Gold( OANDA:XAUUSD )
Gold typically struggles in a rising yield environment. Since it doesn’t generate income, higher bond yields increase the opportunity cost of holding gold, which can weigh on its price.
U.S. Equities
Stocks, especially growth and tech sectors, may face headwinds. Higher yields usually mean higher borrowing costs, which can compress margins and slow down expansion for companies reliant on financing.
------------
What’s your view on US10Y? If US10Yr rises, could we see declines in gold, U.S. stock indices, and the cryptocurrency market?
💡 Please respect each other's opinions and express agreement or disagreement politely.
📌 US 10-Year Government Bond Yield Analyze (US10Y%), Daily time frame.
🛑 Always set a Stop Loss(SL) for every position you open.
✅ This is just my idea; I’d love to see your thoughts too!
🔥 If you find it helpful, please BOOST this post and share it with your friends. Long 
Long 
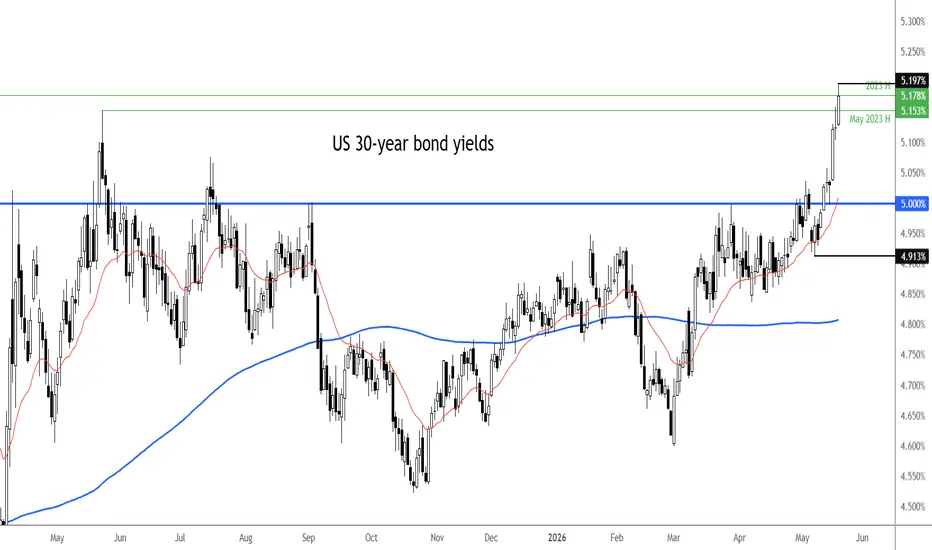
US 30Y approaching 2023 highBond yields rising again today, bad news for gold and other zero yielding assets like silver and Bitcoin, as well tech and other growth stocks. All to do with oil. Oil initially rallied sharply, extending the 10% gains from last week, after Trump warned Iran that the clock is ticking and that there “won’t be anything left” if there is no progress soon in the stalled U.S.-Iran talks. Prices then dropped $5 from its highs to turn red on reports Iran's oil sanctions during the negotiation period will be lifted, raising hopes for a deal. However, oil then turn higher again after Iran said that 'under no circumstances' will it give up its nuclear program to end the war. Consequently, the US dollar bounced back, while stocks and gold were coming off their highs at the time of writing. Yields could push further higher if oil stays supported amid inflation concerns. On 30y, next up is 5.178% - the high from 2023. Can we get there?
By Fawad Razaqzada, market analyst with FOREX.com Long 
Short 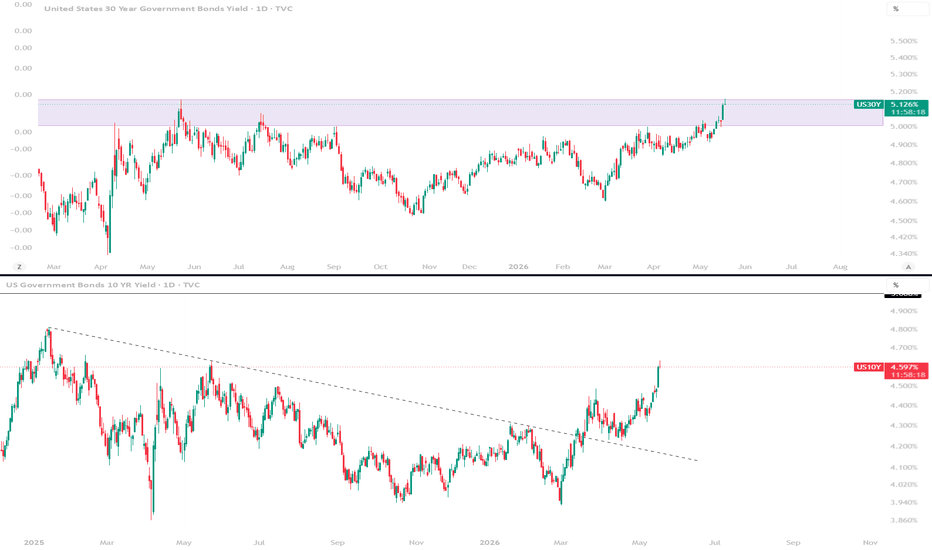
US Bond Yields Break Ascending Broadening WedgeUS10Y — "US Bond Yields Break Out of Consolidation! A Fresh Alarm for Risk Assets?"
Date: May 18, 2026
We need to take our eyes off stocks and crypto for a moment to analyze the global proxy for borrowing costs: the 10-Year US Treasury Yield (US10Y). The weekly chart is flashing a major warning signal that could soon rattle investment portfolios worldwide. Let’s break down what price patterns and time cycles are revealing.
________________________________________
🔍 1. Technical Analysis
• Basic Level: In the macro view, the US10Y continues to trade within a massive Ascending Broadening Wedge. The recent weekly close at 4.601% signals that bullish momentum has returned with significant strength.
• Advanced Level: The latest weekly candle delivered a powerful breakout above the short-term resistance line (Inner Downtrend Line) at 4.500%. This breakout aligns perfectly with the Dotted Parabolic Arcs (representing Time Cycles), confirming that yields have bottomed out for this cycle. The yield is now turning upward into a fierce new wave (indicated by the blue arrow), mirroring past historical behavior (yellow arrow).
________________________________________
📉 2. Trend Outlook
• Short-to-Medium Term: Distinctly Bullish. The trend has shifted upward after unlocking the key psychological and technical resistance at 4.500%.
• Long-Term: The macro structure remains an established Structural Uptrend, characterized by a series of higher lows well above the primary support line.
________________________________________
💼 3. Trading & Portfolio Strategy
• For Yield Speculators: Focus on Long Yield / Short Bond Price positions to ride the momentum above 4.500%, or look to enter on a throwback (retest of support).
• For Overall Portfolios: Historically, a surging US10Y exerts heavy pressure on risk assets, particularly high-growth tech stocks and Gold. Investors should exercise extreme caution and avoid chasing rallies in Big Cap equities while yields hover above 4.601%.
________________________________________
🎯 4. Key Targets (Yield %)
Level Type Yield Target Technical Description
First Resistance 4.750% Previous short-term swing high
Major Resistance 5.000% - 5.150% Cycle target zone (apex of the blue arrow / upper boundary of the Broadening Wedge)
First Support 4.500% Breakout level (former resistance turned support)
Structural Support 3.900% - 4.000% Primary long-term ascending support line
________________________________________
🛑 5. Stop Loss
For yield bulls, the ultimate invalidation level (Structural Stop) is a weekly close below 4.350%. Dropping below this level would confirm a False Breakout and drag the yield back into a deep consolidation phase.
________________________________________
🔄 6. Scenarios & Market Probabilities
• Rally to 5.000%+ (70% Probability): This is the highly probable base case. The latest weekly candle closed as a strong, solid green body above 4.500%, confirming the cyclical reversal.
• Minor Pullback / Range-bound (30% Probability): Yields may temporarily retest the 4.500% support floor before accumulating enough energy to resume the uptrend.
• Invalidation Condition: The bullish outlook will be completely nullified if the yield plunges and registers a weekly close below the critical structural support at 4.000%.
________________________________________
📝 Market Summary
The 10-Year US Treasury Yield (US10Y) has made its choice, decisively breaching the 4.500% barrier. This price action perfectly validates our primary time cycle, sending a clear warning that global capital costs are about to get more expensive.
With the next destination sitting at the psychological 5.000% milestone, investors should actively rebalance their asset allocation. Staying flexible will be key to weathering the volatility expected across risk assets during the second half of 2026.
Disclaimer: This analysis is based on technical indicators and historical data. Investors should always cross-reference technical setups with incoming inflation data and Federal Reserve policy decisions before making investment choices.
Long 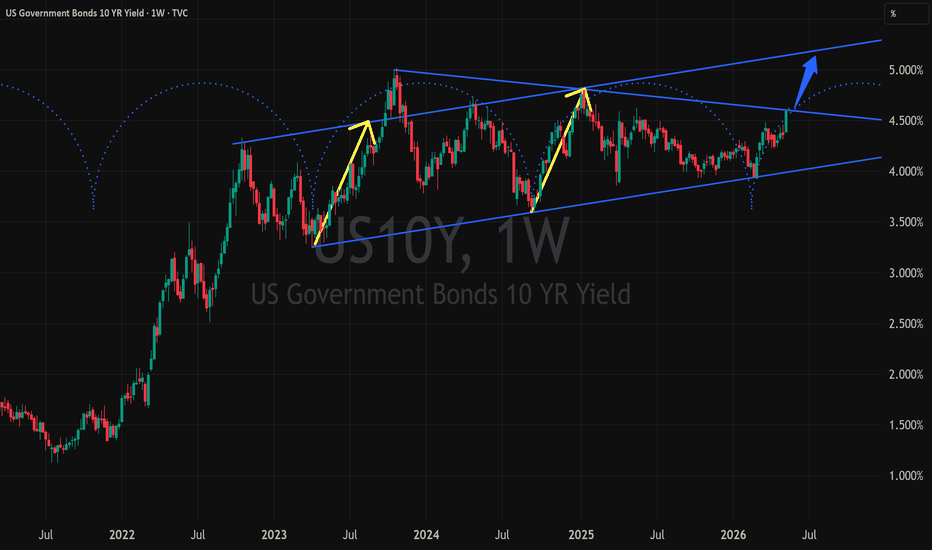
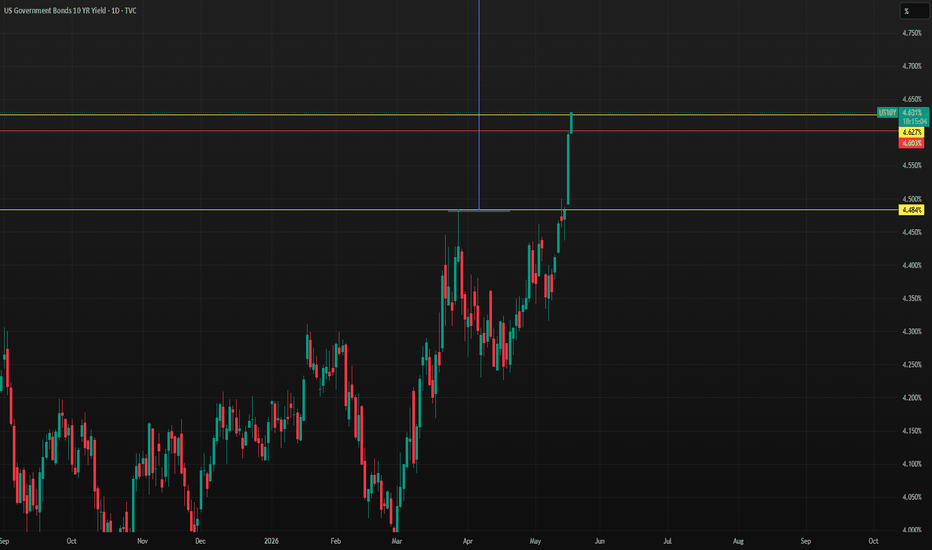
US 10Y TREASURY: Higher for longer expectationsU.S. 10-year Treasury yields surged as stronger than expected inflation data reinforced expectations that interest rates will stay elevated for longer, complicating the policy outlook for newly appointed Fed Chair Kevin Warsh. Markets increasingly see persistent inflation fueled by rising energy prices and geopolitical tensions as key drivers behind the bond selloff. The benchmark 10Y yield climbed toward 4.6% on Friday, reflecting investor concerns that inflation pressures may prevent the Federal Reserve from cutting rates anytime soon. Traders also began pricing in the possibility that the Fed could maintain restrictive policy deeper into 2026, with some even considering future rate hikes.
Usually, after a strong move toward one side, as it happened with 10Y yields on Friday, some relaxation could be expected in the coming week. Yields double-topped on Friday, reaching levels of May last year. The relaxation might bring yields back toward the 4,5% level in the week ahead. However, what should be taken into account is that macro risks are still on stage, so some higher volatility during this period is quite probable.
Long
“Mastering Government Bond Yield Curves”Comprehensive Guide to Analyzing Government Bonds Yield Curves
This article examines government bond yields across countries and analyzes their implications for the economy, investors, and commodity markets.
1. Chart Components
X-axis: Bond maturities (from 1 month to 30 years)
Y-axis: Yield (%)
Colored lines: Different countries/regions (USA, UK, Germany, France, China, Japan)
Numbers next to countries: 10-year yield and recent changes (+2.54%, etc.)
2. Yield Curve Concept
Normal/Upward Sloping Curve:
Short-term bonds → lower yields
Long-term bonds → higher yields
Interpretation: Healthy economy, normal inflation, and growth
Flat Curve:
Minimal difference between short-term and long-term yields
Interpretation: Market expects interest rate changes or potential slowdown
Inverted Curve:
Short-term yields > long-term yields
Interpretation: Strong signal of an upcoming recession
3. Applications for Economic and Commodity Analysis
Relation to inflation and interest rates:
Upward-sloping → normal growth and inflation
Inverted → potential recession, reduced demand for commodities
Global macro analysis:
Compare countries → differences in monetary policies (Fed vs ECB vs PBOC)
Higher yields → higher interest rates or inflation
Capital flow predictions:
High long-term yields → attract investment into long-term bonds
High short-term yields → liquidity pressure and short-term investments
4. Professional Analysis Tips
Slope changes:
Steeper slope → growth and inflation
Flatter slope → recession or lower expected rates
Country differences:
USA 10Y: 4.597% → highest, tight monetary policy, high inflation
Mainland China 10Y: 1.753% → lowest, expansionary policy, high liquidity
Historical comparison: 10-year changes (+2.54%, +2.84%, …) → rate of policy and market expectations
5. Connection to Other Markets
Commodities: High long-term yields → higher capital cost → downward pressure on commodities (wheat, oil)
Stock market: Low long-term yields → boost equity investments
Currencies: High long-term yields → stronger USD → pressure on commodity importers
6. Chart Data Analysis
USA 10Y: 4.597% (+2.54%) → high yield, tight monetary policy, high inflation
UK 10Y: 5.178% (+2.84%) → similar to USA
Germany 10Y: 3.184% (+3.89%) → lower than USA, moderate yield growth
France 10Y: 3.974% (+3.89%) → monetary policy close to Europe
Mainland China 10Y: 1.753% (+0.06%) → low yield, expansionary policy
Japan 10Y: 2.718% (+3.27%) → low yield, long-term expansionary policy
Curve slope:
USA & UK → upward, rising yields with maturity → growth and expected inflation
China & Japan → flat, low → high liquidity, expansionary policy
Europe → moderate curve
7. Yield vs. Bond Price
Concept Explanation Simple Example
Bond Price Amount paid to buy a bond Buying a $1,000 bond for $950 → price below par
Yield Actual return from holding the bond $1,000 bond bought for $950, annual coupon $50 → Yield ≈ 5.26%
Key point: Price and yield are inversely related → lower price → higher yield, and vice versa.
8. Types of Yield
Current Yield: Annual coupon divided by bond price
Example: $50 annual coupon, $1,000 bond → Current Yield = 5%
Yield to Maturity (YTM): Total return until maturity considering purchase price, coupon payments, and par value
Yield Curve: Change in yields by maturity → macroeconomic insight and rate expectations
9. Yield and Investment Attractiveness
High yields: Increase attractiveness → investors buy more bonds
Commodity markets: capital flows from risky assets to bonds
Low yields: Reduce attractiveness → capital flows to riskier assets or commodities
10. Professional Chart Analysis
Curve slope:
Upward → expected growth and inflation
Flat → possible monetary policy change or slowdown
Inverted → potential future recession
Country comparison: US, Europe, China → evaluate capital flows and monetary policy
High long-term yields: Move capital to long-term bonds and safe assets
Volatility and signals: Rapid yield increases → pressure on commodities; rapid decreases → capital moves to risk assets
Key points:
Price and yield always move inversely
Cross-country differences → forecast capital flows and commodity impacts
Real vs nominal yield → assess investment attractiveness considering inflation and real rates
Conclusion
Bond price: Determines liquidity and capital flow
Bond yield: Measures actual return and investment attractiveness
Application: Analyze capital flows, commodities, equities, and currency markets Education 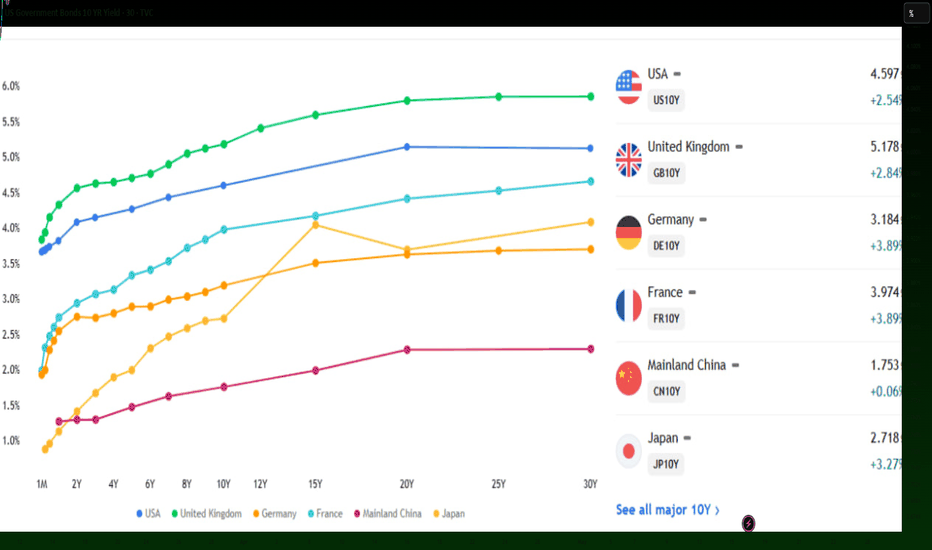
[May '26 Macro] Post 1 - US 10-Year Treasury Yield (US10Y)
(※ This is the introduction that will be identically placed at the top of 5 posts: US 10-Year Treasury Yield, Dollar Index, NASDAQ Index, Gold, and Bitcoin.)
The recent rise in the NASDAQ has been exceptionally steep, and until relatively recently, gold was hitting new all-time highs.
The market cheered, calling it the blessing of the AI era and a geopolitical hedge, but I think it is time to look at the trend slowly changing behind the party.
At the foundation of this thought are three pillars: the April CPI, US Treasury yields, and the Dollar.
April CPI
The two CPI figures released in April and May brought the forgotten inflation issue back to the surface.
The impact of soaring oil prices is large, but the Core CPI was also high at the same time.
Actually, without even going to the Core CPI, even if oil prices come down again, there is a high probability that a new normal will settle in a range higher than the $50-60 per barrel level of the period when expectations for rate cuts were rampant—when no one thought about oil prices.
(Current oil price: $100.6 per barrel)
Because of this, the Fed is caught in a dilemma.
-If they cut the base rate, they cannot ignore the inflation risk.
-If they raise the base rate, there is a massive US fiscal deficit and a labor market that seems to be cooling down.
(Also, they do not want to ruin the mood when the NASDAQ is doing well, and political pressure is hard to ignore.)
US Treasury Yields
Along with inflation concerns, the yields on US 10-year and 30-year Treasuries have rebounded to a considerable level. (Current 10-year yield: 4.6%)
Just until early this year, there were many expectations that it would soon stabilize in the mid-to-high 3% range.
Dollar
For the past two years, US interest rates were quite high, but compared to that, the drop in the dollar's value was large. (This is partly because the Euro was strong.)
From now on, as US Treasury yields rise further, there is a high probability that global liquidity will be sucked in to secure dollars.
___________________________________________
The market's expectation for base rate cuts, which was rampant until just a few months ago, has disappeared, and currently, many market participants view a freeze as reasonable.
The Core CPI, excluding energy and food, has also risen, and there is a high probability that oil prices will maintain a high level for the time being.
If it were not for the Fed's dilemma situation mentioned above - if it were not for the high fiscal deficit and the ambiguous labor market - this is a background where the Fed could sufficiently consider the rate hike card.
Realistically, a base rate hike will not be easy, but as a result, whether they freeze or raise it, there is a high probability that the market interest rate will rise further for the time being.
Through the framework of the Elliott Wave theory - on a very large time frame like a weekly chart - the present can be interpreted as the latter half or the end point of the 4th wave correction.
Even if it is not exactly the 4th wave (since the Elliott Wave theory is very subjective), it is self-evident that it was a 'fluctuating section' after rising sufficiently.
If the downtrend that occurred in the second half of 2025 and early 2026, when expectations for rate cuts were high, had continued and come down further, it would have led to a drop and stabilization of interest rates.
But currently, it appears to be right before the start or in the early stage of the 5th wave heading upward.
It is hard to judge at present how far it will ultimately rise, but I think there is a high probability that it will rise to at least around 5.1%. Long 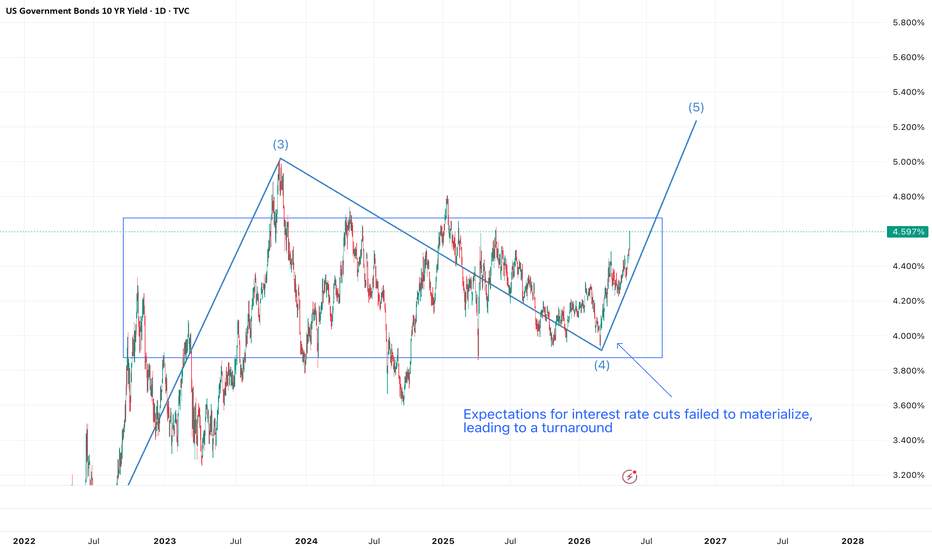
Rising yields....Bond MarketDon’t let the pullback in gold and silver fool you.
A bond market starting to crack is one of the most bullish macro forces metals can have behind them, and almost no one is positioned for it.
Long end yields are rising across major sovereign markets. The U.S. 30 year is back above 5%, the U.S. 10 year is pressing toward 4.5%, Australia’s 10 year is above 5%, and Japan’s 10 year keeps pushing into levels that would have seemed unthinkable a few years ago.
When bonds weaken together across major economies, the message is clear. Investors are demanding more yield to hold government debt because inflation, deficits, debt supply, currency risk, and central bank credibility are all becoming bigger concerns.
Rising yields can pressure gold and silver during short term liquidity flushes, but the structural message is bullish. The old safe haven bond trade is losing its clean status. When sovereign debt starts losing trust, hard assets move into the gap. The Great Secular Shift: US10Y and the Death of the 40-Year BullThe Structural Pivot
For four decades (1981–2020), the fixed-income market followed a singular, predictable path: Lower highs and lower lows. This era of cheap money and disinflation defined the markets' behavior. However, the post-pandemic landscape hasn't just paused this trend—it has shattered it.
The aggressive rate hikes we witnessed in response to the pandemic and high inflation were not a temporary spike. They have left a permanent scar on the macro environment. We are no longer looking at a "dip" in yields; we are witnessing a fundamental trend reversal from a multi-decade bearish cycle to a secular bullish regime in yields.
Supply-Side Inflation vs. Demand-Side History
What many market participants miss is the nature of current inflationary pressures. Unlike the demand-driven inflation of previous cycles, we are currently battling "supply inflation" .
Commodity Pressure: From crude oil to industrial metals, the cost of raw materials is being driven by structural shortages, geopolitical fragmentation, and energy transition costs.
The Shift: While central banks can dampen demand with high rates, they cannot "print" oil or copper. This supply-side pressure is stickier and more volatile than the demand-pull inflation we grew accustomed to in the early 2000s.
Equity Markets: The "Stretched" Reality
This paradigm shift has massive implications for the equity side. For years, the "TINA" (There Is No Alternative) narrative pushed stock valuations to extreme multiples.
The Valuation Gap: With the US10Y finding a new, higher floor, the equity risk premium is becoming gradually and increasingly unattractive.
Correction Risk: Markets are currently overstretched. As the realization sets in that high rates are structural—not cyclical—we should prepare for significant de-leveraging and deep corrections in indices that have been fueled by low-discount-rate assumptions.
Bottom Line: The 40-year trend of falling rates is dead. Keep a close eye on the 10-year yield; it is the gravity that will eventually pull stretched equity valuations back to earth (real value).
#US10Y #Macro #Inflation #Commodities #TradingStrategy #StockMarket TVC:US10Y Long 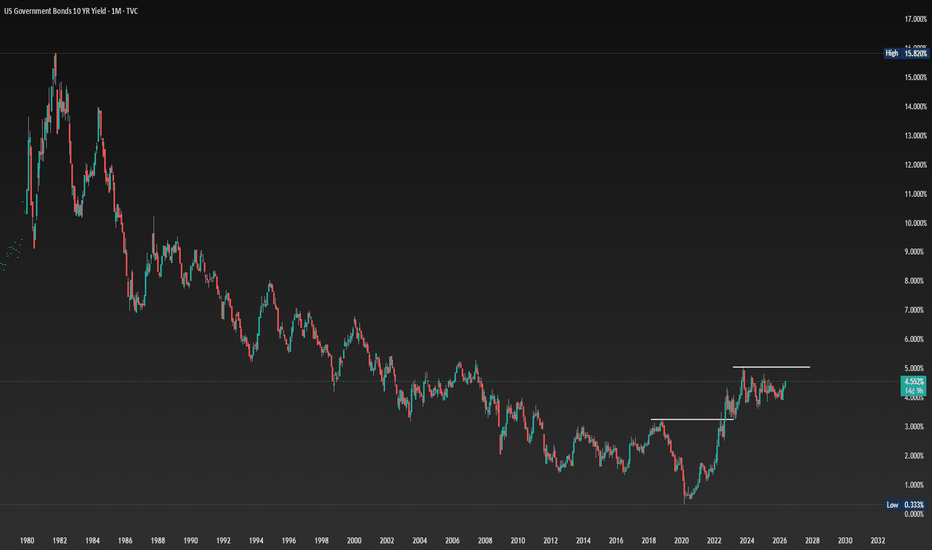
Short 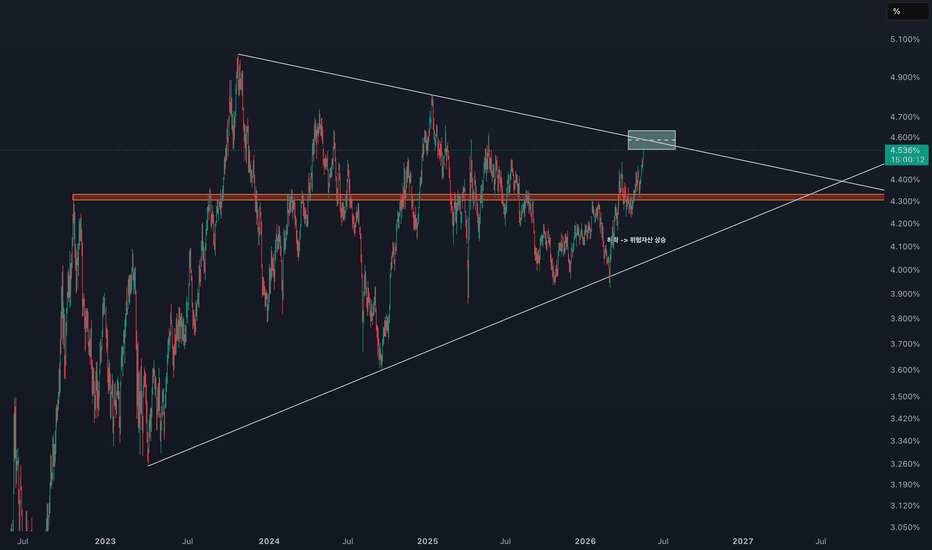
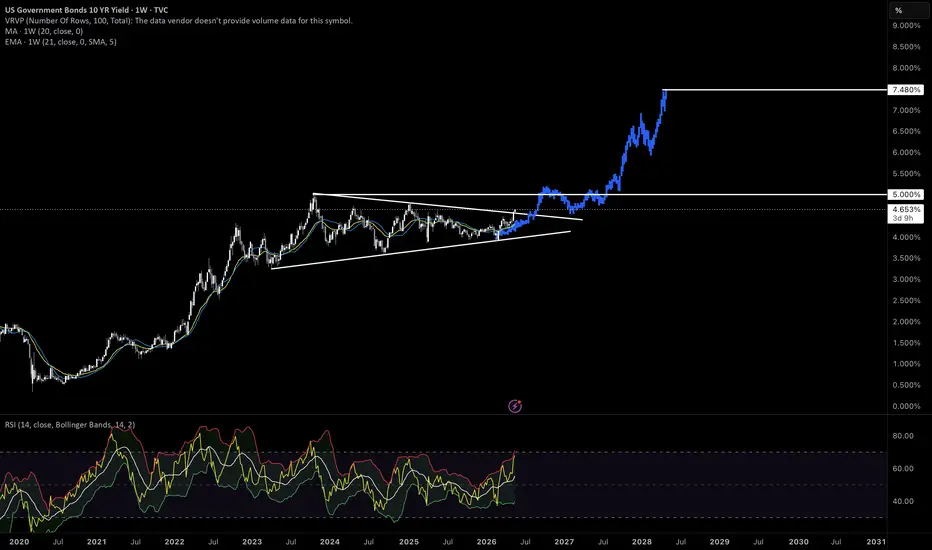
The bond market may have just confirmed the beginning of Wave 5US 10Y Yields
From the historic 2020 low, the US 10-Year Treasury yield appears to have developed a textbook long-term Elliott Wave impulsive structure, potentially setting the stage for the final major upside leg.
Technical Structure:
Wave (1)-(2): post-COVID reversal
Wave 1-2: initial inflation repricing
Wave 3: aggressive Fed tightening expansion
Wave 4: multi-month contracting triangle / consolidation
Current breakout: possible launch of Wave (5)
Key Levels:
Primary resistance: 5.00%
Conservative Elliott target: 5.55%
Extended 1.618 target: 5.88%
Macro Interpretation:
If this count is accurate, the Treasury market is signaling:
Higher-for-longer interest rates
Structural inflation persistence
Continued pressure on equity valuations
Growth and tech multiple compression
Potential credit and real estate stress
Structurally stronger US dollar
Cross-Asset Implications:
Bullish: USD, energy, financials, commodity producers
Bearish: long-duration tech, utilities, REITs, leveraged growth
Bottom Line:
Wave (4) consolidation may now be complete, and the recent upside breakout suggests the bond market could be entering the final stage of the secular bear market in bonds that began in 2020.
A sustained move above 5% would likely trigger broader global asset repricing over the next 6–12 months.
The real risk?
It may not simply be rising yields —
but rather that markets still have not fully priced structurally higher rates. Long