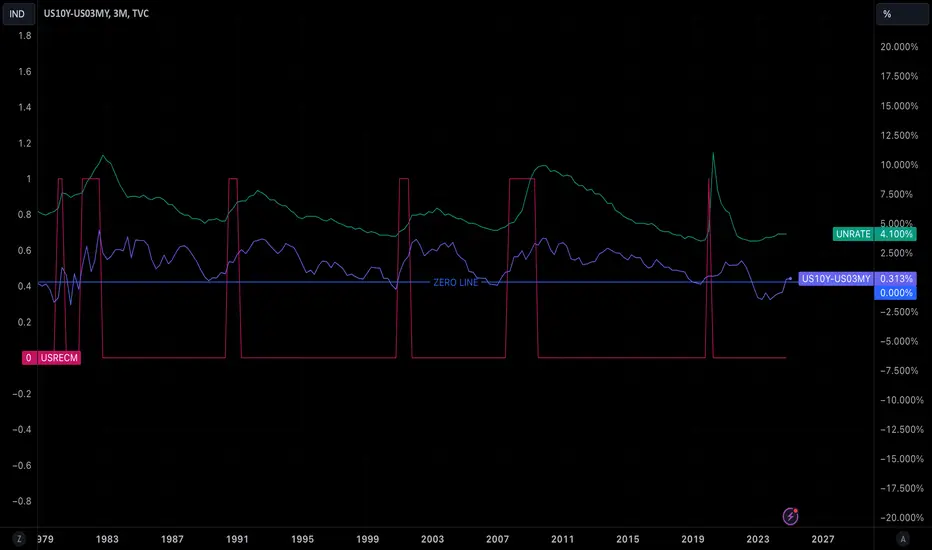
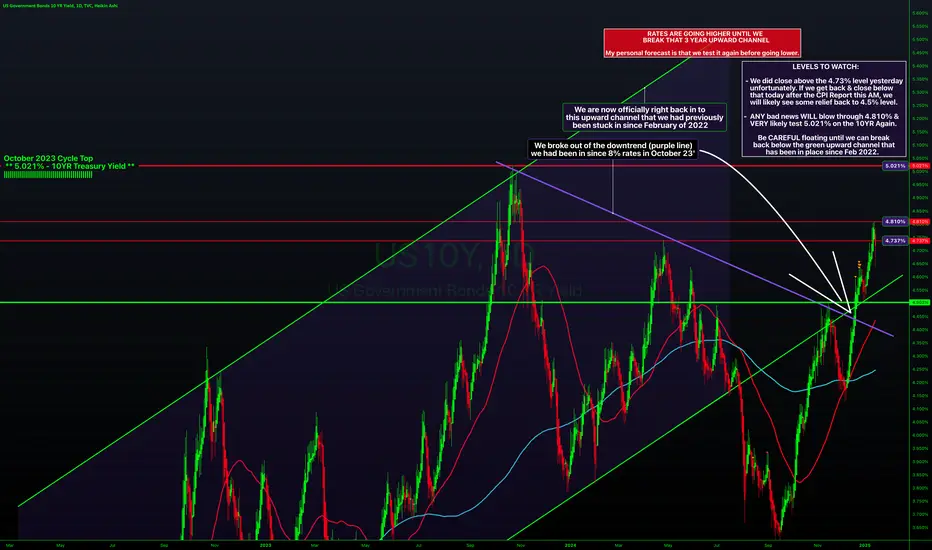
US 10Y Yields - End of January AnalysisToday is an important day as it marks the first day of a new month, giving me the added advantage of analysing the full month’s candle close as well as a weekly close.
Here, I share with you how fundamentals this month affected price action and where in the medium to long term the market can reprice up/down into.
The highs for the month is 4.809%
The lows for the month is 4.488%
Candle body closure above 4.818% will negate my bearish notion of retracing down into the November 2024 monthly bul
Government bonds
"the top is in", "for the rates"gm,
markets tend to be forward looking, and based off my understanding + the chart data, it appears the top is in for the rates.
i predict the market will begin to price in future rate cuts and start bringing the us10y down.
this will open the door to a "risk on" enviroment for big tech, as well as risk assets like crypto .
---
the count on the us10y is relatively simple.
5 waves up from the 2020 lows.
predicting 3 waves down into the year ahead.
the low on the us10y should coincide wi
US 10Y TREASURY: relieved tensions, for the momentMuch of the tension collected for the last month has been relieved after the FOMC meeting. The Fed left interest rates unchanged, as was expected and also there were no surprises when it comes to the future course of inflation and potential Fed moves. However, Friday was a game changer, as the US President announced implementation of new import tariffs for goods coming from Canada, Mexico and China. Although the 10Y Treasury yields reached the 4,48% on Thursday, still, Friday news reverted the c
1Q2025 updateJust a quick update on my previous idea linked below. The US 10-year yield has come off and completed a 4th wave lower onto the 50-day MA of 4.83%. If this support and the current upward channel holds its ground, I expect a 5th wave higher to rip yields toward the 5% level.
A break below the blue support range between 4.45% and 4.5% will however invalidate the move and allow yields to ease towards 4.20%.
President Trump has to somehow create demand for the US treasuries and a persistent infl
US 10Y Yields - Chasing Lower YieldsAssessing the weekly range, from low to high, it is clear to me that the yields is still trading in a premium and with major liquidity pools attacked to the upside, it's only a matter of time we see a cooldown period.
Below 4.469% is regarded as a discount and it might take several of weeks to pan out but I would like to see the weekly bearish consequent encroachment @ 4.735% respected with 4.809% being the last line of defence.
The most interesting chart in the financial marketsAs we all know, soft landings are incredibly hard to achieve... And all it takes through the journey, is one small stone that will start an avalanche. Based on a series of early indicators, it is a well possible scenario for the inflation, to finally show up again in March - which might lead data-dependent FED to quickly adjust its stance on monetary policy. The basic scenario for a correction, I operate with, lays between 10% and 20%. However, based on a whole market analysis, there's an unspok
US10Y will turn bullish on its 1D MA50.The U.S. Government Bonds 10YR Yield (US10Y) has been trading within a Channel Up pattern since the September 17 2024 Low and is currently on its Bearish Leg. This is now approaching the 1D MA50 (blue trend-line), below which the last Higher Low was priced that initiated the Bullish Leg.
With the 1D RSI approaching the same level as then, this is the ideal level to go long again and target 5.000%, which is just below the October 23 2023 Resistance.
---------------------------------------------
US10Y afternoon analysisTechnical analysis for US10Y.
This count is looking for one more push up in yields, approaching (but not going above) 5.215%. Median line is target.
This would complete an expanded flat that started in 2012.
This analysis would suggest the end of the bond bear market is approaching, as long as 5.215% holds as resistance. Yields above 5.215% would suggest much higher yields are likely.
Yields below 4.505% before move above 5% would also invalidate this count.
US 10Y TREASURY: a FOMC weekThe previous week was a bit mixed for US Treasuries. Certainly, the most important weekly event was related to the inauguration of the new-old US President. The market was closely watching which pre-election promise will take place in the coming period. For the moment, promised tariffs on imported goods are set aside, so fear of potential inflation was a bit postponed. However, a new moment occurred when the President was addressing a business gathering in Davos, Switzerland, when he noted that
US10YU.S. 10-Year Bond Analysis – Short-Term Dip, Long-Term Rise
Trump's tariff strategy isn't just about trade; it's also a tool to pressure the Fed into lowering interest rates. He frequently emphasizes the need for lower rates, aiming to weaken the dollar and stimulate economic growth.
In the short term, this pressure could push bond yields lower. However, in the bigger picture, other macroeconomic forces suggest a longer-term uptrend.
For now, I see a temporary bearish move with two possible s
BitCoin doesn’t understand the dark of the night during the dayBased on the performance of U.S. and Japanese stocks yesterday, the logic behind the Japanese interest rate hike is as follows: Previously, with low interest rates in Japan, people borrowed yen, exchanged it for dollars, and invested in U.S. stocks. So, when Japan raises interest rates, it reverses this process—liquidity flows back to Japan, the dollar weakens, U.S. stocks decline, and Japanese stocks rise. As shown in the chart, the candlestick represents the U.S. 10-year Treasury yield, and th
US10Y: Buy signal on the 1D MA50.The U.S. Government Bonds 10 YR Yield is neutral on its 1D technical outlook (RSI = 54.381, MACD = 0.046, ADX = 33.861) as it is on a bearish wave insde the long term Channel Up pattern. The last HL bottom was priced on the 1D MA50. That is the most efficient buy entry to target the 4.0 Fibonacci extension (TP 5.100).
## If you like our free content follow our profile to get more daily ideas. ##
## Comments and likes are greatly appreciated. ##
US 10Y Yields - Is 5% Yields A Real Possibility? Happy new year traders!
This is a perfect time to do a review on Government Bond Yields as it's the 1st month where you see the beginnings of the 6-Month candle form, which can be very powerful for gauging a bias.
Here, we look into the technical and psychological elements as to why 5% might not be as soon as you think...
US 10Y TREASURY: not so scary inflationDuring the previous period, the 10Y US Treasury yields were heading toward the 4,8% level, in a fear of potential higher inflation in the US supported by the strong jobs market. However, posted inflation figures during the previous week, showed that the inflation level in December was modestly below market estimate. This was a sign for the market that the Fed might actually pursue with a planned two rate cuts during the course of this year. In this sense, Treasury yields tumbled down, toward the
2Y/10Y Treasury Yield curve is flashing a warning for markets The Yield curve is writing a familiar script.
Prior to the Great Crash of 1929 the yield curve was inverted for 700 days.
Janet Yellen held the yield curve inverted for the longest period in history, 789 days from Jul 5, 2022 to Sep 6, 2024.
Is it "different this time?" Not long to find out. 🙃
Are We Forming A Top On The US10YR?It looks like we may be forming a top on the US10YR. I assume there will be some volatility in the first few months with the new Trump administration. Trump went on record saying that rates are currently too high. His last term in 2017, it took rates about 5-6 months to come down. Will this time be faster?
Bitcoin (BTC) vs. US 10-Year Treasury Yield AnalysisKey Dynamics:
Rising inflation has pushed the US 10-Year Treasury Yield (10YR Yield) higher, creating macro headwinds for Bitcoin as rising yields often reflect tighter financial conditions and increased risk aversion.
Despite this, Bitcoin has shown resilience, maintaining an upward trend in its price action.
Current Setup:
10YR Yield Resistance Zone:
The 4.70%-5.00% range is a critical resistance zone that has capped yields in the past.
A rejection at this level would signal easing inflation
US02YR vs US10YR vs FED RATE + Recession overlay This chart provides a comprehensive visual analysis of the relationship between the 2-Year Treasury Yield (US02YR), 10-Year Treasury Yield (US10YR), and the Federal Funds Rate (FED RATE), with shaded regions indicating periods of U.S. recessions. The data captures the interplay between short-term and long-term interest rates, monetary policy, and economic cycles, offering insights into potential macroeconomic trends
US 10yr Yields Eyeing 5%?Chart Analysis:
The 10-Year US Treasury Yield continues to climb within a well-defined ascending channel, highlighting robust bullish momentum in recent months.
1️⃣ Ascending Channel:
Yields are trading near the upper boundary of the ascending channel (green-shaded area), reflecting sustained upward pressure.
Traders should monitor reactions at this boundary for potential breakout attempts or a pullback toward the channel’s midline.
2️⃣ Key Resistance Levels:
4.80%: Immediate resistance lev