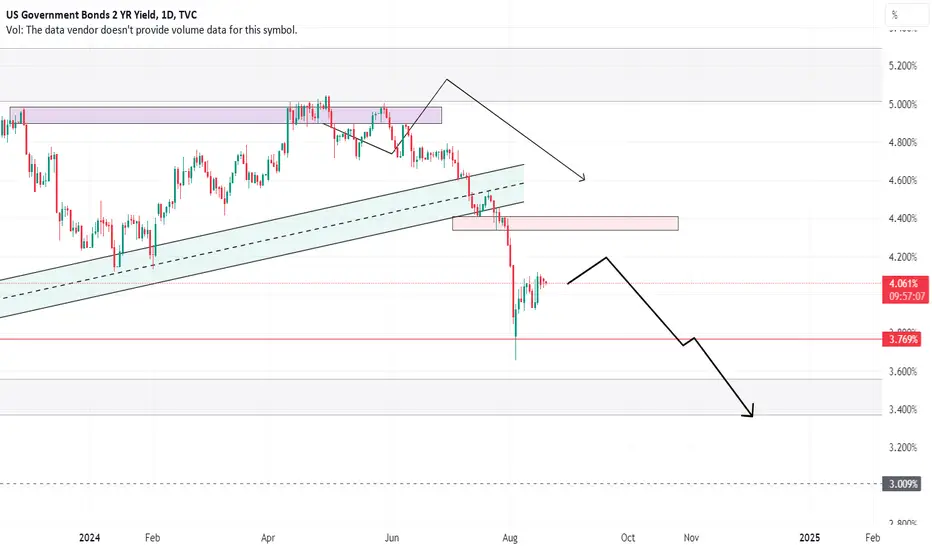
US10Y - Downside Delivery Has Been ConfirmedA couple weeks back, i was expecting a run below the monthly Sellside liquidity pool which occurred. Well, call it a gap as market gapped below to create a low @ 3.667% before retracing 50% into the previous weeks midpoint.
It's looking like a scalpers market going into next week so those trading yields need to be nimble.
My bias is bullish but narrative incorporates bearish observation.
4.197% might seem optimistic but in the grand scheme of the macro dealing range, it could be deemed as a
Government bonds
US02Y / US10Y Yield CurveThe Yield Curve has been inverted for a long time, and as rates are about to go lower, it can finally un-invert. When the 2-year yield is higher than the 10-year yield, the chart is above 1.0 ; But once the 2-year yield dips below 10-year yield, the chart should drop below the 1.0 mark.
US Government Bonds 30YR Yeld (US30Y)As inflation trends closer to the Federal Reserve’s 2% target,
speculation grows around a potential interest rate cut.
The futures market anticipates a 50-basis-point reduction
at the conclusion of the Fed’s September meeting and for rates
to be a full percentage point lower than the current 5.25%-5.5%
range by the end of 2024.
US10Y going lower with the Fed having no choice but to cut.Almost 10 months ago (November 7 2023, see chart below), we made a bold (for the time being) call on the U.S. Government Bonds 10YR Yield (US10Y), as against the prevailing market sentiment we gave a sell signal, right after what turned out to be a top:
Today's revisit to this pattern shows that the 1M RSI Lower Highs have already started to form a Bearish Reversal on the US10Y price, similar to 2006 - 2007. We are expecting to hit the 0.382 Fibonacci retracement level at 2.100% as its firs
ELLIOTT WAVE ANALYSIS: US10YR - 20 AUG, 2024© Master of Elliott Wave : Hua (Shane) Cuong, CEWA-M.
10-Year Yield, the main trend is down. Currently wave (C)-orange is unfolding to push lower. Recent price action shows that wave ((iii))-navy has ended, and wave ((iv))-navy is unfolding as a Triangle. The basis is that it will be longer and take longer than expected. But the bearish view with wave ((v))-navy then is still holding.
While price must remain below the 4.022% high to hold this view.
US 10Y TREASURY: Fed`s cut is nearingThe posted US inflation for July brought some new confidence for investors that the Fed's rate cut is nearing. The July inflation eased to the level of 2.9% on a yearly basis, and was below market forecast of 3.0%. The Producers Price Index was another indicator which pointed to further easing of inflation pressures, by reaching 0.1% in July, for the month, again below market estimate of 0.2%. To nail the market expectations, preliminary Michigan Consumer Sentiment, posted on Friday, showed no c
10 Yr Yield-100/200 monthly SMA cross is inevitabThe crossing of the 100 SMA ABOVE the 200 SMA on the monthly 10 year yield is inevitable...it will cross shortly no matter what rates do from here on out...even if they declined to 2% tomorrow.
What does this mean...IMO it means longer term lending rates will remain higher than people/corporations are used to seeing over the last 20 years. The prices we are seeing today will more than likely be what we will continue to see over the next 7-10 years; at the very least.
As you can see from t
US10Y: 14 AUG, 2024US Bonds 10 YR Yield: 14 AUG, 2024 - 4H Chart
© Master of Elliott Wave Analysis: Hua (Shane) Cuong, CEWA-M.
10 YR Yields, the main trend is bearish. Currently wave (C)-orange is unfolding to push lower.
Wave ((iv))-navy has just completed at 4.022%, and wave ((v))-navy is unfolding to push lower, targeting the immediate target at 3.676%. While price must remain below 4.022% to maintain this view.
Disinversion Surprise on CPI Day?Could the 10's and 2's yield inversion finally rollover tomorrow back into normal territory ? MACD and basic patterns suggest no, but fundamentals will prevail. If CPI comes in hot, inversion likely continues, if CPI continues to cool as it has been for months, the inversion could finally run its course tomorrow morning
US10Y-US02Y - Bond Yield Curve AnalysisWorth noticing that the bond yield curve did very briefly push above 0 with a very whipsawing spike.
This happened at the S&P selling climax low.
And it does look like we will see a real move up and through the 0 point either soon or in the not too distant future.
Which in tandem will see increasing unemployment.
And that apparently is a clue that recession is in the pipeline.
And we often see a stock crash in that area.
That said, the alignment with stock indexes crashing is fairly loose.
BUND-STREET SMART PLAY BY lINDA RASCHKE2/3YR FCL: Bund Made First close below the Sma, on 2 and 3 Year time frame hence expecting a Bullish retracement
15/16M:RTM: This a Consolidation Pattern, formed my simple or complex consolidation both on 15 and 16 Month Time frames
8M:HOLY GRAIL: This a Retracement formed to the EMA after close off the kelner, See street smart by Linda.
Note that 6 Months is Ranging below the Range of 2-3 Year First close candle, however small time frames are playing off the Bullish trend
1w" Extended Rund
2d
Fed Watch Tool Target Rates on the US 10 YOn this graph, we see the current priced in Interest Rates of the FED Watch Tool in compare to the US 10 Year Treasuries. We can clearly identify by how much the market is frontrunning and at what pace the market believes the Interest Rates will decline.
The Orange Box below is the average Interest Rate of ~2.75% and the expected Mid/Long Term Interest Rate, until something brakes and the next Liquidity Cycle begins.
I personnaly believe that we will see an even faster pace in the future, he
German Bund Is On The Rise, So As EURUSD PairWe talked about a bullish turn on German Bund back on June 20th, where we mentioned and highlighted more gains within wave C of an A-B-C rally, which can also recover the EURUSD pair.
As you can see today on August 05, German Bund is extending strongly higher within a five-wave bullish cycle for wave C with space up to 140 area. At the same time EURUSD is also nicely recovering due to a positive correlation and with still bullish Bund, EURUSD can easily see more upside.
US 10Y TREASURY: easing with rate cutsTwo weeks ago markets reacted to surprising jobs data in the US, however, the posted ISM Services PMI on Monday put a dose of relaxation among market participants. Data showed that the US is clearly not in a recession and that, at least, the services sector is doing fine at this moment. All financial markets were traded in a positive manner during the previous week, resetting their sentiment to the previous path. The US Treasuries also re-adjusted during the week, in a move from 3.7% reached on