Global Market Analysis: Dynamics of the World Economy1. The Structure of the Global Market
The global market isn’t a single entity but rather a network of interconnected sub-markets—each influencing the other. These include:
Equity Markets: Stock exchanges across the world like NYSE (USA), LSE (UK), NSE (India), and Nikkei (Japan) where investors buy and sell company shares.
Bond Markets: Governments and corporations issue bonds to raise capital, influencing global interest rates and credit flows.
Foreign Exchange (Forex) Markets: The largest financial market globally, with a daily turnover exceeding $7 trillion, dictating exchange rates between currencies.
Commodity Markets: Covering energy (oil, gas), metals (gold, copper), and agricultural products (wheat, soybeans), these markets affect inflation and industrial costs.
Derivatives Markets: Financial instruments like futures, options, and swaps that allow investors to hedge risks or speculate on price movements.
These markets operate through both developed economies (like the U.S., Japan, and the EU) and emerging economies (like China, India, and Brazil), whose increasing influence has reshaped global trade and investment flows.
2. Key Drivers of the Global Market
Global markets respond to a mix of economic, political, and technological factors. The main drivers include:
a) Economic Indicators
Economic health is reflected through metrics such as:
GDP Growth Rates: Indicate whether economies are expanding or contracting.
Inflation & Interest Rates: Affect consumer spending, borrowing, and corporate investment.
Employment Data: High employment boosts consumption; unemployment signals economic stress.
Trade Balances: Show the difference between exports and imports, influencing currency strength.
b) Monetary Policy
Central banks like the U.S. Federal Reserve, European Central Bank, and Reserve Bank of India regulate liquidity and interest rates. A dovish stance (low interest rates) usually stimulates growth and stock markets, while a hawkish stance (high rates) can slow them down.
c) Geopolitical Stability
Wars, trade conflicts, and political shifts (like Brexit or U.S.-China tensions) can disrupt supply chains, affect oil prices, and create investor uncertainty.
d) Technological Innovation
Technology drives productivity, reshapes industries, and spawns new sectors such as AI, renewable energy, and digital finance, which attract global capital.
e) Investor Sentiment
Perception often drives short-term market movements. When optimism prevails, “risk-on” assets like equities rise; when fear sets in, “safe-haven” assets like gold and the U.S. dollar gain.
3. Regional Market Analysis
Global market dynamics differ across regions, each contributing uniquely to the world economy.
a) The United States
The U.S. remains the largest and most influential economy, contributing about 25% to global GDP. Its stock markets (Dow Jones, S&P 500, NASDAQ) serve as global benchmarks.
Key trends include:
Strong consumer-driven growth.
Leadership in technology and innovation.
Monetary policy shifts under the Federal Reserve.
Fiscal deficits and debt ceiling debates impacting investor confidence.
b) Europe
Europe’s markets are heavily influenced by the European Central Bank (ECB) and political cohesion within the European Union (EU).
Key challenges include:
Energy dependence post-Russia-Ukraine conflict.
Slower growth in aging economies.
Regulatory leadership in green and digital finance.
c) Asia-Pacific
Asia is the growth engine of the global economy, led by:
China: Transitioning from export-led to consumption-driven growth.
India: A rising powerhouse in technology, services, and manufacturing.
Japan and South Korea: Advanced in technology and industrial exports.
ASEAN nations (like Indonesia, Vietnam, and Malaysia) are also gaining traction as supply chain alternatives to China.
d) Middle East and Africa
The Middle East, dominated by oil exporters like Saudi Arabia and UAE, is diversifying through Vision 2030-type reforms.
Africa, meanwhile, is emerging with vast natural resources and young demographics, attracting long-term infrastructure investments.
e) Latin America
Countries like Brazil, Mexico, and Chile are resource-rich economies sensitive to commodity cycles. Political instability and inflation remain challenges, but trade relations with the U.S. and China support recovery.
4. Interconnectedness and Globalization
Global markets are deeply interconnected, meaning a policy decision in one country can ripple across the world.
Examples include:
U.S. interest rate hikes affecting capital outflows from emerging markets.
China’s slowdown reducing demand for global commodities.
European energy crises impacting industrial production worldwide.
This interdependence has both benefits (growth opportunities) and risks (contagion effects). The 2008 global financial crisis and the 2020 pandemic illustrated how quickly economic shocks can spread globally.
5. Role of Currencies and Forex Markets
Currency markets are the lifeblood of global trade. Exchange rates determine export competitiveness and investment returns.
Key currency dynamics include:
U.S. Dollar Dominance: The dollar remains the global reserve currency, used in 80% of trade settlements.
Euro and Yen Influence: Widely used in international trade and finance.
Emerging Market Currencies: Often volatile, influenced by capital flows and inflation.
Digital Currencies & CBDCs: Central Bank Digital Currencies (CBDCs) are reshaping how cross-border payments occur.
Currency volatility affects companies’ profits, inflation, and global investment flows, making forex analysis central to global market forecasting.
6. Commodity Market Overview
Commodities form the foundation of industrial and consumer economies.
Key categories include:
a) Energy
Crude oil and natural gas dominate global energy trade. Prices fluctuate with OPEC+ decisions, geopolitical tensions, and renewable energy transitions.
b) Metals
Gold, silver, copper, and lithium are vital for industries, technology, and investments. The global shift toward electric vehicles (EVs) has increased demand for lithium and copper.
c) Agriculture
Food commodities like wheat, corn, and soybeans are influenced by weather, trade policies, and geopolitical disruptions.
Commodities often act as inflation hedges and safe-haven assets during market uncertainty.
7. Emerging Market Trends
a) Digital Transformation
E-commerce, fintech, and digital payments have redefined trade and consumption. Platforms like Amazon, Alibaba, and Paytm are reshaping economies.
b) Renewable Energy Transition
As climate concerns rise, investment is shifting from fossil fuels to green technologies, including solar, wind, and hydrogen energy.
c) AI and Automation
Artificial intelligence is boosting efficiency, data analysis, and algorithmic trading, impacting labor markets and productivity.
d) Supply Chain Diversification
Post-pandemic disruptions and geopolitical risks have encouraged “China+1” strategies, moving manufacturing to countries like India and Vietnam.
e) Financial Inclusion
Microfinance, mobile banking, and digital currencies are bringing millions into the formal economy in developing nations.
8. Risks and Challenges in the Global Market
a) Inflation and Interest Rate Volatility
High inflation erodes purchasing power, prompting central banks to raise interest rates — often slowing growth and raising recession fears.
b) Geopolitical Tensions
Conflicts in Ukraine, Middle East tensions, and U.S.-China rivalry continue to threaten global stability.
c) Climate Change
Extreme weather impacts agriculture, infrastructure, and migration patterns, introducing long-term risks.
d) Debt Crisis
Several nations face rising public debt burdens due to post-pandemic stimulus measures and global borrowing costs.
e) Cybersecurity Threats
As financial systems digitize, cyberattacks pose serious risks to global financial stability.
9. Tools and Techniques for Global Market Analysis
Professionals use multiple analytical frameworks to understand market movements:
Fundamental Analysis: Examines economic data, earnings reports, and macro indicators.
Technical Analysis: Studies price patterns, volume, and momentum indicators for trading insights.
Sentiment Analysis: Gauges investor mood using surveys, volatility indexes (VIX), and media trends.
Quantitative Models: Use algorithms and big data for predictive insights.
Comparative Analysis: Compares economies or sectors to identify relative strengths and weaknesses.
Data sources include IMF, World Bank, OECD, and Bloomberg, which provide real-time global financial information.
10. The Future of Global Markets
The coming decade promises profound transformation in how global markets operate:
a) Multipolar World Order
Power is shifting from the West to Asia, especially China and India, creating new centers of influence.
b) Rise of Green Finance
Investments in renewable energy, ESG (Environmental, Social, Governance) funds, and carbon trading are gaining momentum.
c) Digital Currencies and Blockchain
Blockchain-based systems may reduce transaction costs, enhance transparency, and change global banking.
d) Artificial Intelligence in Trading
AI-driven trading and predictive analytics are enhancing efficiency but also increasing systemic risks from algorithmic errors.
e) Inclusive Globalization
Future markets will focus on inclusive growth, ensuring developing economies benefit equitably from global trade.
Conclusion
Global market analysis is more than tracking numbers—it’s about understanding the story of interdependence, where economic, political, and social forces intersect. The 21st-century global market is a complex web that connects the fate of nations and individuals alike.
From the movement of oil prices to central bank policies, from AI-driven innovation to geopolitical realignments, every element plays a role in shaping global outcomes.
For investors, policymakers, and businesses, mastering global market analysis means recognizing patterns, anticipating shifts, and adapting strategies in an ever-evolving environment.
As we move toward 2030 and beyond, the future global market will be defined by sustainability, technology, and cooperation—where knowledge, agility, and foresight become the true currencies of success.
Government bonds
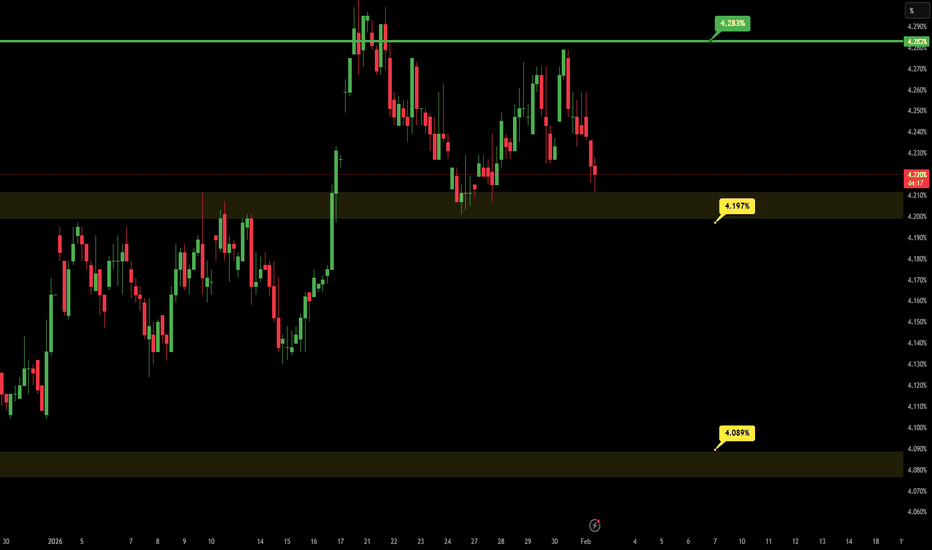
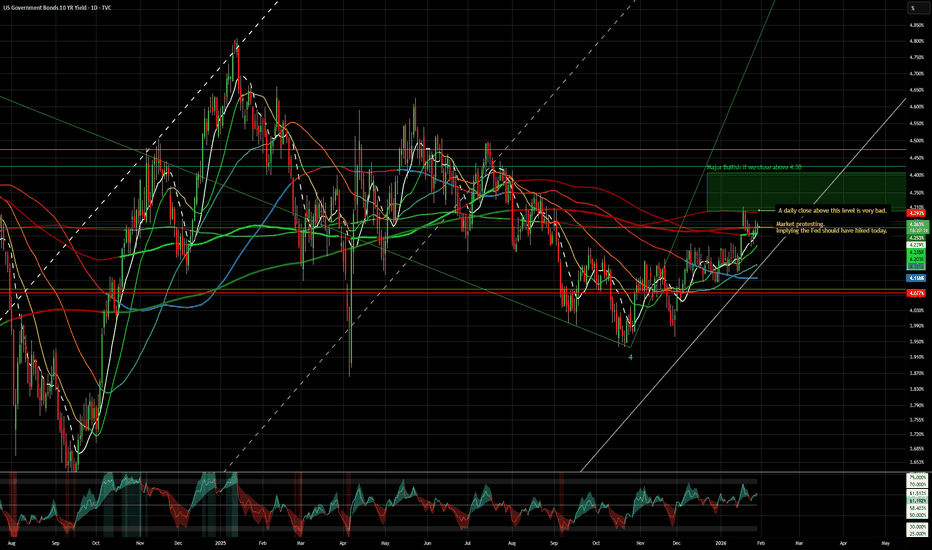
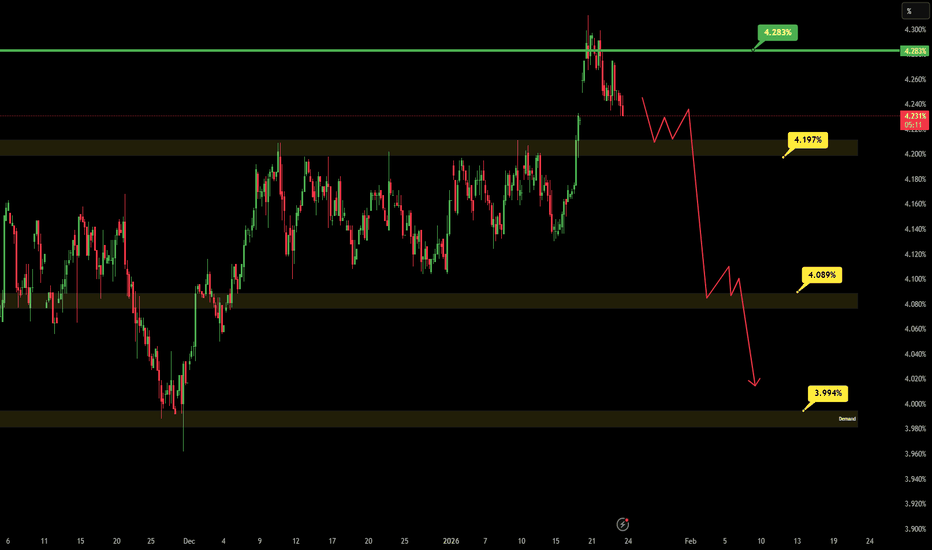
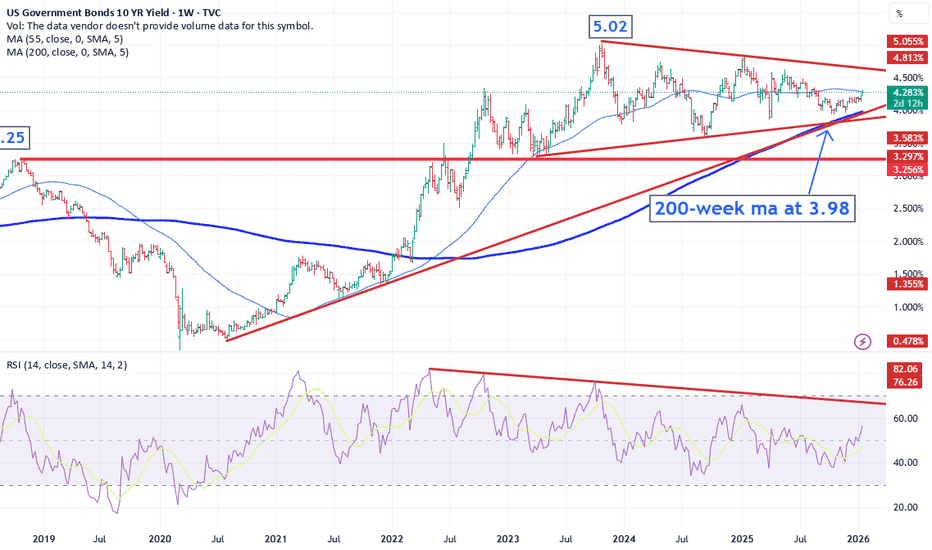
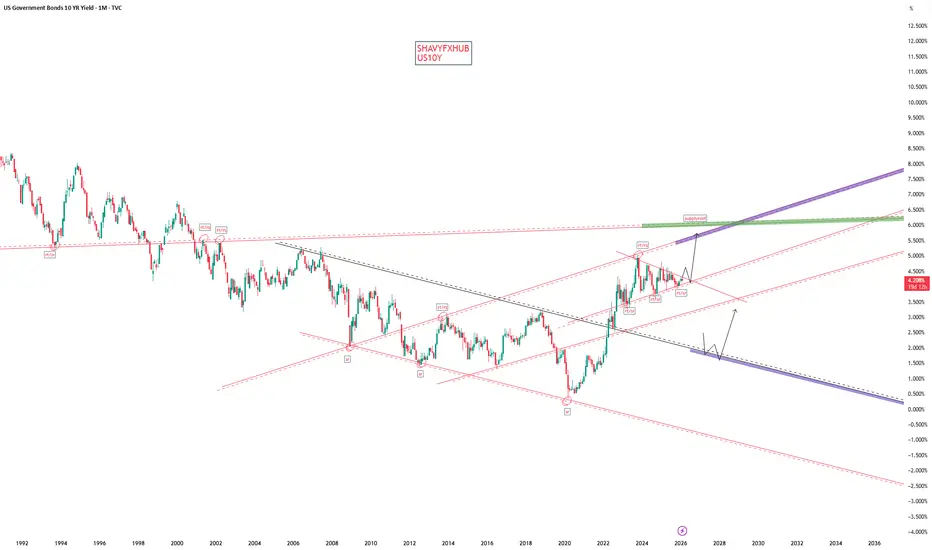
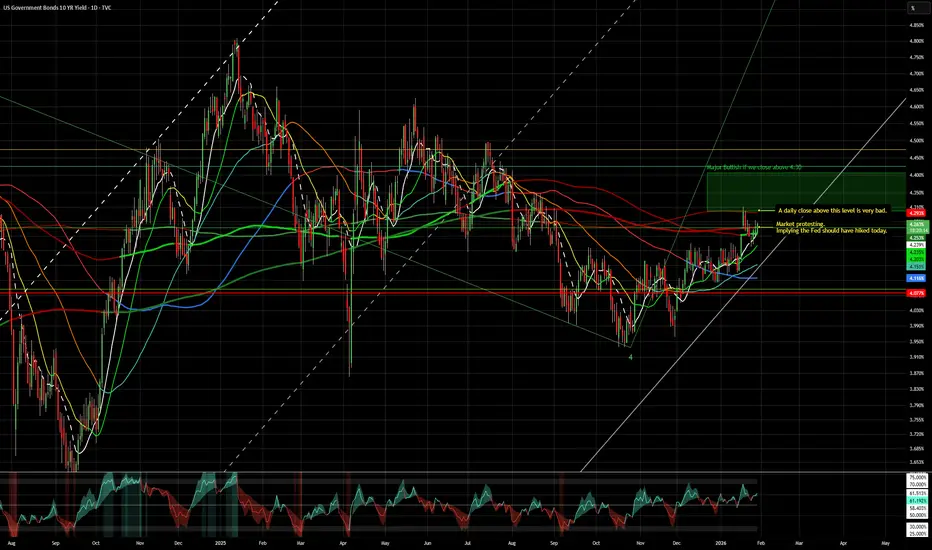
US10YUS10Y TECHNICAL DETAILS
4.193% A KEY RESISTANCE TO UPSWING
4.088% DEFENDED SUPPORT CURRENTLY
3.996 % LOW RECOVERED AND TESTED TWICE.ANY ATTEMPT ON THIS ZONE WILL BE A TECHNICAL DOWNSLIDE.
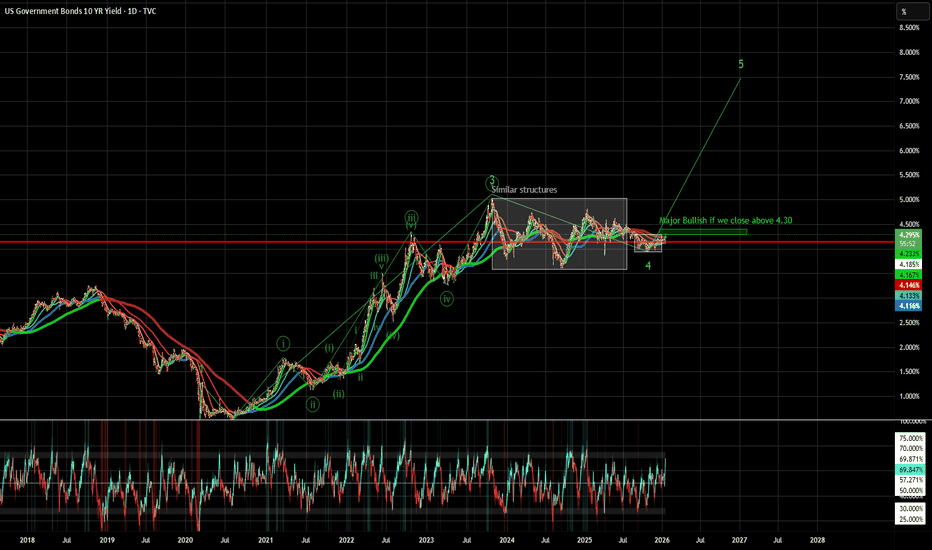
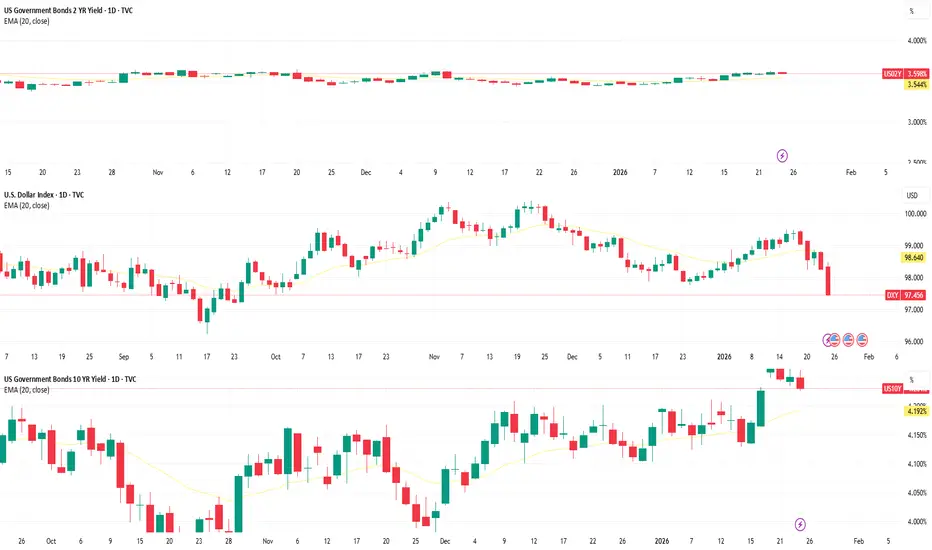
The US 10-year Treasury yield is approximately 4.125%
This yield represents the return investors expect for lending to the US government for 10 years and is a key benchmark influencing financial markets.
Dollar Index (DXY)
The DXY measures the value of the US dollar relative to a basket of major currencies , reflecting the dollar's strength amid global economic conditions such as interest rate differentials and geopolitical factors.
Relationship Between US10Y and DXY
The US10Y yield strongly influences the DXY because higher yields attract foreign capital, boosting demand for the dollar and strengthening the index.
When yields rise, the DXY usually follows upward due to investor demand for higher-yielding dollar assets.
Conversely, yields falling can weaken the dollar, reducing the DXY.
The relationship between bond yield and bond price is fundamental in bond investing and is characterized by an inverse correlation:
Key Concepts
Bond Price: The amount investors are willing to pay for a bond in the market. This can be above or below the bond’s face/par value.
Bond Yield: The return an investor expects to earn if the bond is held until maturity, expressed as a percentage. Several types include coupon rate, current yield, and yield to maturity (YTM).
Relationship Between Bond Yield and Bond Price
Inverse Relationship: When bond prices go up, bond yields go down; when bond prices fall, bond yields rise. This is because the fixed coupon payment represents a smaller or larger percentage of the bond’s market price depending on price changes.
Why? If interest rates in the market rise, new bonds offer higher yields. Existing bonds with lower coupons become less attractive, so their prices drop to increase their yield to competitiveness. Conversely, if market interest rates fall, existing bonds with higher coupons become more valuable, driving prices up and yields down.
Basic Formula Explanation
Current Yield = Annual Coupon Payment / Current Bond Price
Example:
A bond with a $1,000 face value and $50 annual coupon pays a 5% coupon rate.
If the bond price drops to $900, the current yield = $50 / $900 ≈ 5.56% (yield rises)
If the bond price rises to $1,100, the current yield = $50 / $1,100 ≈ 4.55% (yield falls)
More Accurate Measure: Yield to Maturity (YTM)
YTM accounts for the total return, including coupon payments and the gain or loss if the bond is held to maturity.
It reflects the discount rate that equates the present value of a bond’s cash flows (coupons + principal repayment) to its current market price.
Summary
Change Direction Effect on Bond Price and Yield
Interest Rates Rise Bond prices fall, bond yields rise
Interest Rates Fall Bond prices rise, bond yields fall
Bond Price Increases Bond yield decreases
Bond Price Decreases Bond yield increases
Bond investors must understand this inverse dynamic to manage portfolio risks and returns effectively.
NOTE ;IF YOU ARE A GOLD TRADER FOCUS ON DXY AND US10Y PRICE ACTION
#US10Y #BONDS #DXY #DOLLAR
rising bond ratesAU government will be pay higher
interest for their debt.
Inflation in Au is rising even though the statisticians are working overtime to massage the numbers lower. All this stems from inflated housing prices and inflated rental prices. margins are thin so make it up on volume. hence the higher migration levels. clogged up cities with inadequate infrastructure.
US 10Y TREASURY: Shutdown fuels rate-cut speculationThe US Treasury bond market was focused on the US government “shutdown” during the previous week, estimating the implication which this shutdown could have on the macro segment on the US economy. The 10-year Treasury yield rose slightly to 4.154%, but reverted back as of the end of the week toward the 4,08%. Yields are closing the week at 4,119%.
The shutdown, which began on October 1, resulted from a failure by lawmakers to agree on a temporary spending bill. This impasse has led to the suspension of most government economic data releases, including the September jobs report, heightening uncertainty in the markets. Investors are particularly concerned about the potential impact on the Federal Reserve's upcoming policy decisions, as the lack of updated labor market data may influence the central bank's approach to interest rates.
Despite these challenges, markets are closely monitoring the situation, with expectations that the Federal Reserve may consider easing monetary policy if the shutdown persists and economic indicators weaken. The evolving political landscape and its effects on fiscal policy continue to be key factors influencing investor sentiment and Treasury yields.
US10Y & DXY downward trend continues. US10Y 4% triggers DXY 96.TVC:US10Y has been in a downward trend despite of US Fed holding the rates stable. In this blog space I have been following the downward sloping channel since Jan 2025. Since our May 2 prediction of a 4% in %US10Y we are very much on that glide path to lower low.
TVC:US10Y making new lows. 4% upcoming. 3.5% target low. for TVC:US10Y by RabishankarBiswal — TradingView
And then we add TVC:DXY into the mix which is also making lower lows and lower highs. I had a near term target of 96 on TVC:DXY and 90 by year end. This seems unreasonable now. I must change my outlook, when the charts change.
As we see, whenever TVC:DXY touches the lower bound of the downward slopping channel it tends to rebound to the mid-point of the channel. If it does so, then we might see a 100 on TVC:DXY Before we plunge down to 96 or lower.
Hence, I revise my prediction to be bullish on TVC:DXY , but that will have no impact on TVC:US10Y which is headed lower due to Fed cutting cycle and probably higher TVC:DXY dampening inflation.
Verdict: Revise our prediction: Short term bullish on OPOFINANCE:DXY. Long term bearish. Key levels: TVC:DXY to 100 first then 96. US10Y remains bearish with 4% by Dec 2025.
Bond Market Whiplash: September Ends with Yields Under PressureSeptember was a month of sharp swings for U.S. Treasuries. The 10-year yield started strong near 4.4% but lost momentum as political gridlock and growing bets on Fed rate cuts fuelled a flight to safety. Traders shifted from fearing inflation to bracing for slower growth and a possible government shutdown, sending yields drifting lower into month’s end.
What began as a hawkish month ended with markets pricing in caution — and the bond market once again reminding everyone that fear moves faster than policy.
US30Y pattern support breachAs can be seen from the chart below, price action continues to respect resistance between 4.792% (1Y) and 4.770% (1W), which has also seen flow move below the neckline of a double-top pattern at 4.712%.
With the close below a notable pattern neckline, additional underperformance towards 1Y support at 4.640% (which held on two occasions in April and September this year) might unfold. A leg below 4.640% also unearths another layer of nearby 6M support at 4.577%.
Written by the FP Markets Research Team
Freight Power and Economic Growth1. The Concept of Freight Power
Freight power can be conceptualized through multiple dimensions:
Transport Infrastructure Capacity: The total capacity of road, rail, air, and port networks to move goods. High-capacity networks enable faster and larger volume movement.
Logistics Efficiency: Includes time taken to move goods, reliability of delivery, customs efficiency, and the technology used for inventory and transport management.
Modal Diversity: The ability to move goods via multiple transport modes (road, rail, waterways, air) improves resilience and reduces bottlenecks.
Regulatory and Policy Environment: Policies that ease transport, reduce tariffs, and promote trade corridors enhance freight power.
Integration with Global Supply Chains: Freight power grows exponentially when a nation’s logistics system is connected to international trade networks.
Essentially, freight power reflects both the quantity and quality of freight movement and its ability to sustain continuous economic activity.
2. Freight Power as a Driver of Economic Growth
Freight power and economic growth are interdependent. Several mechanisms explain this relationship:
2.1 Reducing Transaction Costs
Efficient freight systems lower the cost of moving goods. This reduction in transaction costs allows businesses to expand markets, improve profitability, and attract investment. Lower transportation costs also reduce the final price of goods, increasing consumer purchasing power.
2.2 Enabling Industrial Expansion
Industrial growth depends on the timely movement of raw materials to factories and finished products to markets. Countries with strong freight power can support large-scale industrial hubs and complex manufacturing supply chains. For instance, China’s industrial growth is closely linked to its investment in railways, ports, and highways.
2.3 Promoting Trade Competitiveness
Freight power enhances a country’s ability to participate in international trade. Efficient ports and shipping corridors allow exporters to access global markets rapidly, reducing lead times and enhancing competitiveness. Economies with poor logistics infrastructure often suffer from delayed shipments, higher costs, and reduced trade volumes.
2.4 Stimulating Employment and Regional Development
Freight and logistics systems create direct employment in transport, warehousing, and infrastructure sectors. They also stimulate regional development by connecting remote areas to urban markets. Industrial zones near ports, rail hubs, or highways tend to grow faster due to easier access to inputs and markets.
2.5 Supporting Agricultural Growth
For agrarian economies, freight power is critical for moving perishable goods efficiently. Refrigerated transport, efficient rural roads, and cold storage systems reduce post-harvest losses and enhance farmers’ incomes.
3. Freight Power and Macroeconomic Indicators
The impact of freight power on economic growth can be traced through several macroeconomic indicators:
3.1 Gross Domestic Product (GDP)
Transport and logistics are part of the services sector, contributing directly to GDP. More importantly, freight efficiency indirectly boosts GDP by facilitating industrial output and trade expansion.
3.2 Trade Balance
Improved freight systems lower export costs and enhance the competitiveness of domestic products abroad. Efficient freight corridors can transform landlocked economies by providing faster access to ports, improving their trade balance.
3.3 Inflation and Price Stability
Efficient freight reduces distribution costs, which can dampen inflationary pressures. Conversely, logistics bottlenecks increase the cost of goods, contributing to price volatility.
3.4 Foreign Direct Investment (FDI)
Investors prefer locations with robust logistics infrastructure. Countries with strong freight power attract FDI in manufacturing, warehousing, and trade sectors, stimulating employment and technology transfer.
4. Modes of Freight and Their Economic Impact
Freight power depends on the efficient integration of multiple modes of transport:
4.1 Road Freight
Road networks provide door-to-door connectivity, critical for domestic trade. Well-maintained highways reduce travel time, fuel consumption, and vehicle maintenance costs, supporting small and medium enterprises (SMEs) and regional markets.
4.2 Rail Freight
Railways are ideal for bulk cargo like coal, minerals, and grains. Rail freight is more cost-efficient over long distances and supports industrial clusters. Countries like India and China have leveraged rail freight to boost heavy industries.
4.3 Maritime Freight
Seaports are the backbone of international trade. Containerization and port efficiency directly influence export-import volumes. Countries with strategic ports can become trade hubs, boosting employment and foreign exchange earnings.
4.4 Air Freight
Air freight is crucial for high-value, perishable, or time-sensitive goods. Though costly, it facilitates global integration for sectors like electronics, pharmaceuticals, and fashion.
4.5 Intermodal Freight
The combination of road, rail, and sea freight enhances efficiency and flexibility. Logistics parks, container depots, and technology-driven freight management systems increase economic output.
5. Case Studies: Freight Power and Economic Growth
5.1 China
China’s Belt and Road Initiative and domestic investment in high-speed rail, highways, and ports have dramatically increased freight power. This infrastructure surge has enabled China to dominate global manufacturing and exports, leading to sustained GDP growth over decades.
5.2 India
India’s freight corridors, like the Dedicated Freight Corridor (DFC), aim to decongest road networks and enhance rail freight efficiency. Improved freight power can stimulate industrial clusters, reduce logistics costs (currently among the highest globally), and promote regional development.
5.3 European Union
The EU’s integrated transport networks, including cross-border highways, rail corridors, and ports, support intra-European trade. Freight power facilitates the free movement of goods, enhancing GDP and employment across member states.
6. Challenges in Freight Power Development
Despite its importance, many economies face challenges in enhancing freight power:
Infrastructure Bottlenecks: Aging ports, congested highways, and limited rail networks constrain growth.
High Logistics Costs: Developing countries often incur 10–20% of GDP in logistics costs compared to 5–10% in developed nations.
Regulatory Hurdles: Complex customs procedures, inefficient permits, and cross-border restrictions impede freight movement.
Technological Gaps: Lack of digital tracking, automated warehouses, and intelligent transport systems reduce efficiency.
Environmental Concerns: Freight transport contributes significantly to carbon emissions. Sustainable solutions are essential for long-term economic and environmental balance.
7. Policy Recommendations
To maximize the contribution of freight power to economic growth, governments and private actors should consider:
Infrastructure Investment: Expand highways, railways, ports, and logistics parks. Public-private partnerships can accelerate this.
Technology Integration: Implement smart logistics systems, GPS tracking, automated warehouses, and AI-based transport management.
Regulatory Reforms: Simplify customs procedures, reduce bottlenecks, and harmonize cross-border regulations.
Sustainability Focus: Promote green transport, electric vehicles, and carbon-efficient shipping practices.
Skill Development: Train personnel in modern logistics management to increase efficiency.
Regional Integration: Develop freight corridors that connect industrial zones, ports, and urban centers.
8. Future Trends
The future of freight power and economic growth is shaped by:
Digital Freight Platforms: AI-driven platforms will optimize routes, reduce fuel consumption, and increase reliability.
Autonomous Transport: Self-driving trucks, drones, and automated port operations will reduce human dependency and improve speed.
Green Logistics: Pressure to decarbonize will drive innovations in alternative fuels and eco-friendly supply chains.
Global Supply Chain Integration: Countries that integrate freight networks with global supply chains will attract more trade and investment.
Conclusion
Freight power is a cornerstone of economic growth. Efficient, diversified, and technologically advanced freight systems reduce costs, enhance trade competitiveness, stimulate industrial and agricultural output, and foster regional development. Countries that strategically invest in freight infrastructure, integrate logistics with global markets, and adopt sustainable practices can achieve faster, more inclusive, and resilient economic growth.
The link between freight power and economic growth is not linear—it is dynamic and multifaceted. While infrastructure alone is insufficient, its combination with policy support, technology, and global integration determines the true economic potential of freight power.
US Shutdown... How Can This Impact Yields?A U.S. shutdown doesn’t just freeze Washington — it shakes Wall Street. Investors rush into Treasuries for safety, pulling long-term yields down, while missing data and fiscal fears can push short-term yields up. The curve bends under politics, not just economics, turning every extra day of gridlock into fresh market uncertainty.
The 10-year U.S. Treasury yield recently fell ~4.3 basis points to about 4.145 % amid safe-haven demand ahead of a possible shutdown.
The curve has shown signs of steepening: longer maturities have been under more pressure (yields up) relative to short maturities.
US 10Y TREASURY: rate cut bets hold, 10Y nears 4.20%U.S. Treasury yields moved mixed as markets awaited the release of the Personal Consumption Expenditures (PCE) Price Index, the Federal Reserve’s preferred inflation gauge. The data showed headline and core PCE readings for August came in around expectations of 2,7% y/y, reinforcing a view of moderate inflation. The data supported ongoing investor bets on two rate cuts before year’s end. Yields on the 10-year Treasury tested for one more time the 4,0%, after which they turned toward the upside, and ended the week at 4,18%.
The week ahead brings US jobs data, where another round of higher volatility might be triggered on financial markets. As per current expectations, the 4,20% is pending testing, which could occur during the week ahead. Some easing might also be expected, at least till levels around the 4,10%.
US10Y UNITED STATES 10 YEAR TREASURY BOND YIELD .THE US10Y DEFENED 4.096% AND if buyers retest 4.146% i will look long into a 4hr bullish channel and target 4.245%
the feds rate cut drop interest rate from 4.25%-4.5% to 4.0%-4.25% 25 basis point drop.
dollar rebound on feds chair speech despite inflation above 2% way above mandate .
key education information for reference .
The U.S. 10-year Treasury yield (US10Y) is a critical benchmark for interest rates in the economy and has a strong relationship with both Federal Reserve interest rate policy and the U.S. Dollar Index (DXY). Together, these factors significantly influence the strength of the U.S. dollar.
Correlation between US10Y and Interest Rates
The US10Y reflects market expectations for future interest rates and economic growth.
When the Federal Reserve raises short-term interest rates (Federal Funds Rate), it often leads to higher yields on longer-term bonds like the 10-year note, as investors anticipate sustained tightening and stronger economic conditions.
Conversely, when the Fed lowers rates or signals accommodative monetary policy, the US10Y often falls due to expectations of slower growth and lower inflation.
US10Y is thus a barometer of monetary policy expectations and long-term inflation outlook.
Correlation between US10Y and DXY
There is generally a positive correlation between US10Y and the DXY (U.S. Dollar Index).
When US10Y rises, U.S. bonds become more attractive to global investors, increasing demand for USD to buy those bonds.
This higher demand for USD pushes up the DXY, reflecting a stronger dollar.
Conversely, declining US10Y tends to reduce demand for dollar assets, weakening the DXY and the dollar.
Effect on Dollar Strength
Higher US10Y and rising interest rates typically strengthen the dollar because:
Investors seek higher returns in U.S. assets.
The carry trade becomes favorable, increasing capital inflows.
Economic confidence and inflation expectations rise, supporting dollar demand.
Lower US10Y and falling rates weaken the dollar as:
Returns on U.S. assets decline.
Capital may flow to other currencies with more attractive yields.
Market uncertainty or economic slowdown can reduce dollar demand.
Summary Table
Factor Effect on US10Y Effect on DXY/USD Strength
Fed Rate Hike US10Y rises DXY/USD strengthens
Fed Rate Cut US10Y falls DXY/USD weakens
Strong Economic Growth US10Y rises DXY/USD strengthens
Weak Economic Data US10Y falls DXY/USD weakens
Conclusion
The US10Y is both a reflection of and an influencer on Federal Reserve interest rate expectations. Its movements strongly correlate with the DXY, making it a key driver of U.S. dollar strength in global markets.
US10Y and Interest Rates
US10Y reflects market expectations of future interest rates and inflation.
When the Fed raises policy rates, or signals tightening, it generally drives US10Y higher as investors expect higher yields on longer maturities.
Conversely, Fed rate cuts or dovish signals typically lead to lower US10Y.
US10Y acts as a benchmark for mortgage rates, corporate borrowing, and influences overall financial conditions.
US10Y and DXY Correlation
US10Y and the DXY are positively correlated.
Rising US10Y attracts capital inflows into USD-denominated assets due to higher returns, strengthening the dollar and raising the DXY.
Falling US10Y reduces the attractiveness of dollar assets, weakening the dollar and lowering the DXY.
Impact on Dollar Strength
Higher interest rates (both short-term Fed rates and longer-term US10Y) boost dollar strength by enhancing yields, attracting investors, and improving economic outlook perceptions.
Lower interest rates weaken the dollar by reducing carry advantages and signaling weaker economic momentum.
Summary
Factor US10Y Direction DXY/USD Effect Explanation
Fed rate hikes Rise Dollar strengthens Higher yields attract foreign capital
Fed rate cuts Fall Dollar weakens Lower yields reduce investment appeal
Strong economic growth Rise Dollar strengthens Positive growth outlook supports higher yields
Economic slowdown Fall Dollar weakens Risk-off leads to lower yields and less USD demand
Thus, US10Y movements driven by Fed policy and economic data closely track the DXY and are major drivers of the dollar’s global strength.
#us10y #bonds #USD #DOLLAR
EU10Y EURZON 10 YEAR TREASURY BOND YIELD THE EU10Y beak of 2.887% SUPPLY ROOF WILL BE A long buy ,the ECB monetary policy shift will be monitored in the context of RATE CUT OR HIKE.
EU10Y LOOKS READY FOR UPSWING.
EURAUD LONG ,EURGBP LONG EURJPY LONG, IF YEILD STAY AND REMAIN BULLISH.WHAT EVER POSITION YOU HAVE TAKEN REMEMBER THAT 2.887% IS A REJECTION ZONE ON WEEKLY TIME FRAME .
Correlation of Eurozone 10-Year Bond Yield (EU10Y) and Euro Strength
There is a strong positive correlation between the Eurozone 10-year government bond yield (EU10Y) and the euro currency strength (EUR/USD exchange rate).
When EU10Y rises, it typically signals stronger economic conditions or expectations of higher interest rates, making euro-denominated assets more attractive to investors. This leads to increased demand for the euro, strengthening the currency.
Conversely, falling 10-year yields often coincide with euro weakness as investor confidence and expected returns decline.
Research shows this correlation is one of the tightest in recent years, supported by bond yield differentials relative to other major economies like the U.S. impacting EUR/USD movements.
ECB Interest Rate Impact on Euro
The European Central Bank’s (ECB) policy interest rate is a critical driver of the euro's value.
When the ECB raises rates or signals a hawkish monetary stance, the euro generally appreciates as higher rates attract capital inflows seeking better returns.
Rate cuts or dovish signals from the ECB tend to weaken the euro by lowering yield attractiveness.
Market expectations and global risk sentiment can modulate this effect; for example, if a rate hike is already priced in, the euro may not move much immediately after the announcement.
The ECB’s recent moves, such as rate cuts in 2025 amid inflation control, have influenced euro fluctuations, with markets reacting to guidance and economic outlooks.
Current Head of the European Central Bank (ECB)
The current President of the ECB is Christine Lagarde.
She has been serving since November 1, 2019, and is known for her experience as the former Managing Director of the International Monetary Fund (IMF) and France’s Finance Minister.
Christine Lagarde's leadership focuses on navigating inflation, economic recovery, and monetary policy challenges within the Eurozone.
Her term is scheduled to run through October 31, 2027, and she has expressed commitment to completing her full tenure.
EU10Y =2.744%
ECB RATE =Deposit Facility: 2.00% · Main refinancing operations (Fixed Rate Tender): 2.15% · Marginal Lending: 2.40%.
#EU10Y #BOND #STOCKS
EU10Y EURO ZONE TEN YEAR TREASURY BOND YIELD THE EU10Y beak of 2.887% SUPPLY ROOF WILL BE A long buy ,the ECB monetary policy shift will be monitored in the context of RATE CUT OR HIKE.
EU10Y LOOKS READY FOR UPSWING.
EURAUD LONG ,EURGBP LONG EURJPY LONG, IF YEILD STAY AND REMAIN BULLISH.WHAT EVER POSITION YOU HAVE TAKEN REMEMBER THAT 2.887% IS A REJECTION ZONE ON WEEKLY TIME FRAME .
Correlation of Eurozone 10-Year Bond Yield (EU10Y) and Euro Strength
There is a strong positive correlation between the Eurozone 10-year government bond yield (EU10Y) and the euro currency strength (EUR/USD exchange rate).
When EU10Y rises, it typically signals stronger economic conditions or expectations of higher interest rates, making euro-denominated assets more attractive to investors. This leads to increased demand for the euro, strengthening the currency.
Conversely, falling 10-year yields often coincide with euro weakness as investor confidence and expected returns decline.
Research shows this correlation is one of the tightest in recent years, supported by bond yield differentials relative to other major economies like the U.S. impacting EUR/USD movements.
ECB Interest Rate Impact on Euro
The European Central Bank’s (ECB) policy interest rate is a critical driver of the euro's value.
When the ECB raises rates or signals a hawkish monetary stance, the euro generally appreciates as higher rates attract capital inflows seeking better returns.
Rate cuts or dovish signals from the ECB tend to weaken the euro by lowering yield attractiveness.
Market expectations and global risk sentiment can modulate this effect; for example, if a rate hike is already priced in, the euro may not move much immediately after the announcement.
The ECB’s recent moves, such as rate cuts in 2025 amid inflation control, have influenced euro fluctuations, with markets reacting to guidance and economic outlooks.
Current Head of the European Central Bank (ECB)
The current President of the ECB is Christine Lagarde.
She has been serving since November 1, 2019, and is known for her experience as the former Managing Director of the International Monetary Fund (IMF) and France’s Finance Minister.
Christine Lagarde's leadership focuses on navigating inflation, economic recovery, and monetary policy challenges within the Eurozone.
Her term is scheduled to run through October 31, 2027, and she has expressed commitment to completing her full tenure.
EU10Y =2.744%
ECB RATE =Deposit Facility: 2.00% · Main refinancing operations (Fixed Rate Tender): 2.15% · Marginal Lending: 2.40%.
#EU10Y #BOND #STOCKS
Interest Rates Dropped... Why Is Yields Rising?Why Yields Can Rise After a Rate Cut
When people say “interest rates dropped,” they usually mean central bank policy rates (like the Fed cutting rates).
But bond yields (like US10Y) are set in the open market, based on supply/demand and expectations about inflation, growth, and future rate paths.
Rate cuts can be inflationary: Lower borrowing costs can stimulate spending and growth, which raises inflation expectations → investors demand higher yields.
Market front-running: If the cut was already priced in, traders may rotate out of bonds (selling pushes prices down, yields up).
Core PCE in focus: What to trade?Core PCE data, the inflation metric the FED pays particular attention to, is in focus today. Especially since the USD has maintained its strength post FOMC, with Thursday's bout of positive data boosting dollar sentiment further.
An October rate cut is still very much on the cards, but a December cut is looking less likely than it did a week ago. The USD 10 YEAR is very close to that 4.2 area.
Today's data could be very binary for the USD. I imagine the MOM number will be the focus, concenciuos 0.2, which is lower than last month's 0.3. if the data doesn't appease the market, the US strength will likely continue as a December rate cut becomes less likely. Alternatively, a lower number will likely see the USD weaken into the weekend.
What to trade? Keeping it very simple, simultaneous opposing USD and CAD (GDP) data could create a USD CAD trade in either direction.
If the US and CAD data aligns, it would be a case of gauging the risk environment according to the US data. There could be a number of permutations according to the markets mood. And I'll be keeping an eye on the S&P, the US 10 YEAR and the VIX.
My preference is for, either: 'hot data' creating a clear and obvious USD long trade.
Or: soft data creating 'risk on', which would likely mean a USD or JPY short trade, depending on if the JPY follows yields lower or (inverse) stocks higher.
US10Y TARGET COMPLETED US10Y ,the barometer and bench mark tools to check the state of united economic health,
wehen invested have confidence in US10Y ,they do so with clarity that the economy will continue to grow and this sentiment strengthens the dollar index DXY.
WE HAVE SEEN A SHARP RISE AFTER THE HEAD OF FEDERAL SPEECH AND RATE CUT TO 4.0%-4.25%.
THE US10Y REACHED MY TP.
COMPLETE ANALYSIS AS POSTED .
#US10Y #DXY #DOLLAR