US10Y Elliott Waves: 10 SEP, 2024 | The Bearish MarketThe ((v))-navy wave is unfolding to push lower, which itself is subdividing into wave iii-grey of wave (iii)-orange.
Wave iii could continue to push lower, targeting the 3.564% low. While price must remain below 3.932% to maintain this view.
On the other hand, the 61.8% level could temporarily act as a potential resistance level that price should hold below.
Government bonds
Bond markets pricing in a possible recessionary scenarioSpread between US 2 year yield and Fed Funds Rate is one of the key indidcators to watch out for the state of the economy. Fed Funds Rate is an overnight rate. Historically, before any recessionary scenarios the spread was seen moving to negative territory, during Middle East Crisis in 1989/1990, dotcom crisis in 2000/2001 and Credit crisis in 2008.
Currently, the spread is at -1.67%, second lowest in history only to 2008 Credit crisis which was at -1.76%. This leads to a strong conclusion
US 10Y TREASURY: NFP implied yieldsFriday was the major trading day on the US financial markets, after the release of jobs data for August. The US nonfarm payrolls came weaker than market was expecting, which implied market higher volatility. The nonfarm payrolls came at the level of 142K, while the market was expecting to see 160K for the month. On the positive side was a modest decrease in the unemployment rate from 4,3% to 4,2% in August. Such weak figures were an indication to markets that the Fed might need to cut interest r
Bond Market Corrections Become Faster and Faster Every Cyclegrok please find the next number in the sequence 903 511 315 = 215
215 days from the time the US03Y crosses below the 52wk moving average from when the 30 year bond bottoms. If this correction is to the same magnitude of previous correction the US30Y could fall by another 47% from current levels to 2.8%, or it could fall even further to 0.28%
Direction of the 10yr yield and mortgage rates. So here is my analysis on the 10yr yield: The long-term trend is contained in a bull channel (upwards). In the short term: I believe it comes down to 3.2% percent as that was a very important level back in 2022 and 2023 so it will first act as a level of support plus it should be around the bottom of the trendline. If it can break below that level, then i do see the 10yr coming down to 2.7%. The 50,100,150,200 moving averages has almost all crossed over and are sloping down which is a bearish si
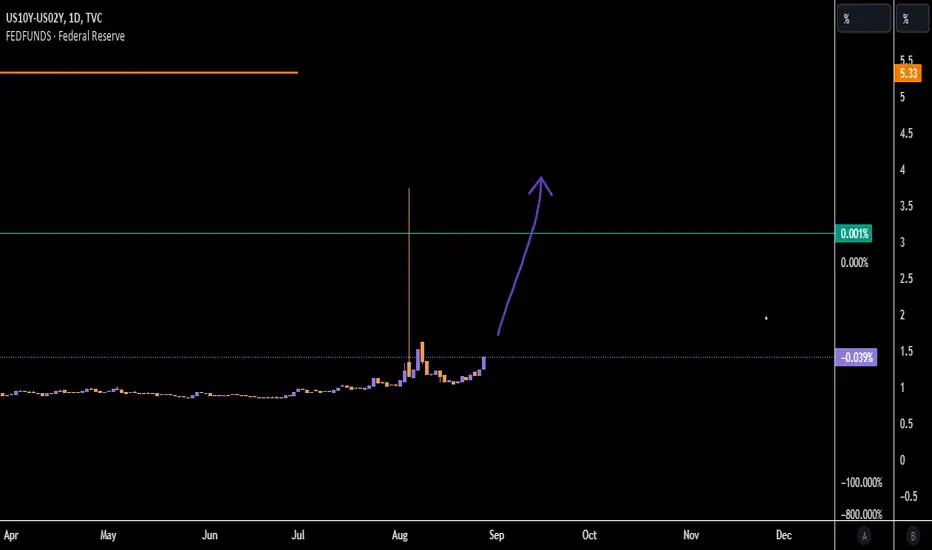
10 Year & 2 Year Treasuries just uninverted10 & 2 year treasuries just uninverted after a long time being inverted. This is occurring right as unemployment looks set to increase to 4.5% and above. Expecting more market panic and this may potentially be the first clear signs of a recession. VIX quite high and market may be creating some of the first lower highs in a long time, indicating a bear market.
What makes a good business plan for your trading?Some insights into my experience building a solid business plan for my FX/Indices/Commodities trading portfolio:
1️⃣ Define clear objectives: I set specific, measurable, achievable, relevant, and time-bound (SMART) goals for my forex trading. Having a clear vision helps me stay focused and track progress.
2️⃣ Risk management is paramount: I prioritize risk management above all. I define my risk tolerance, mark circuit breaker protection levels, drawdown thresholds, set damage control levels, a
SPX on upper valuation band in a rising yield environment.The top chart shows the US 10 Year government bond yield. We are currently in a rising yield environment.
The bottom chart shows that the SPX is at the upper channel and there is a risk of a significant drop in SPX in the coming years.
The middle chart shows the ratio of Gold/SPX. Gold has been underperforming but there are 5 to 10 year periods of gold outperformance over SPX.
Bond yield curve shift changeBSE:754GS2036 Nothing technical about this trade but the very basics of profiting from fixed income security analysis
We know that the stock markets are at an all time high and valuations seem to be getting steeper day by day, we also know that we are going to be entering a rate cutting environment for the coming future initiated by the Federal reserve
So predicting that a similar suit will be followed by the RBI, Long term duration bonds would benefit from the convexity effect the most and i
US10Y - Playing With New Week Opening GapsWith Sellside delivering, the expectation was for a retracement to target the previous weeks trading range which never came to fruition.
Instead, Thursday delivered into a Sellside imbalance buyside inefficiency, failing to reach into the NWOG, indicating signs of weakness before Friday came about and delivered a bearish inside day candle.
I believe there is unfinished business down at 3.763%. I have my eyes on the 25% quadrants within the volume imbalance
US 10Y TREASURY: adjusting for a rate cutAfter Powell`s the “time has come” for the Fed to pivot, and the latest PCE data, markets were adjusting their expectations for the level of Fed's rate cuts in the coming period. The Julys PCE data came surprisingly lower from market expectations, of 2.5% on a yearly basis, compared to 2.6% expected by markets. At the same time, investors are considering both personal income, which was higher by 0.3% in July, and personal spending which was higher by 0.5% for the month. The 10Y treasury yields
Yield Curve Inversion: A Warning Sign You Can't IgnoreThe yield curve, which shows the difference between short-term and long-term interest rates on government bonds (US10Y-US02Y). In normal market conditions, this number should be positive because the interest that investors require on 10Y bonds is higher than the interest required on 2Y bonds. Interest is a value of risk perception. Higher risk of default means higher required interest on bonds.
As seen on the chart, the moment that the yield-curve "un-inverts" (yellow circles) is a critical mar
Yield Curve De-Inverting: A Bearish September IndicatorFlying under the radar for much of this month is the spread between the yield on the US 2-year Treasury note and the 10-year note. The gap is now just five basis points, having traded at negative 0.5ppt as recently as June 25. As we enter September, notoriously the worst month on the calendar for the S&P 500, if we see short rates continue to fall while the 10-year holds steady, I assert that it would be a bearish indicator for the S&P 500.
Here’s how it might play out: if we see a weak payroll
US 10Y TREASURY: “time has come” for 25 or 50 bps?The “time has come” for the Fed to pivot. This was the note from Fed Chair Powell at the Wyoming Jackson Hole Symposium, and was the note that the market was waiting for a long time to hear. Current market expectation is that the Fed will make its first cut in September, however, the question that is currently occupying Wall Street is whether it is going to be 25 or 50 basis points? Fed Chair Powell did not make any comments on when the rate cut will happen or what would be the scale of the rat