Want to Know Where Gold is Heading? Look at JP10Y!Want to Know Where Gold is Heading? Look at JP10Y!
+0.89 correlation: Did you know about this relationship between Japanese bonds and gold?"
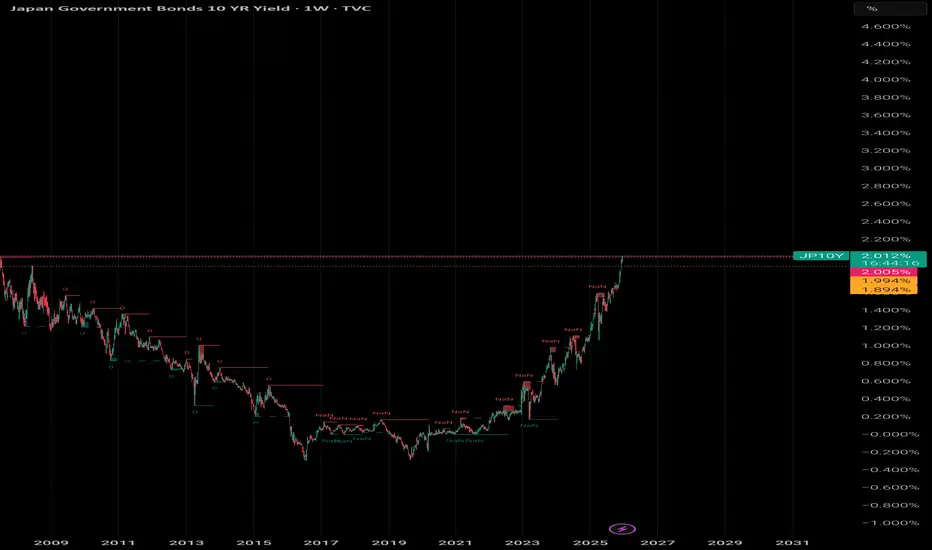
One of the most overlooked indicators by gold investors is Japanese Government Bonds (JP10Y). When we examine the price movement over the past 5 years, a surprising relationship emerges: wherever JP10Y goes, gold follows!
📊 Correlation Analysis
The correlation coefficient between the two instruments is at +0.89 level, which means a very strong positive
Government bonds
US 10‑Year Yield: Time to Pay Attention Again Back on January 6tack on January 6th, I suggested keeping a close eye on the US 10‑year yield because it looked like it was starting to wake up. A couple of weeks on, that move is finally materialising.
What’s interesting here?
- We’ve broken above previous highs
- A small base has completed
- Price has pushed above the 200‑day moving average
- And we now have a buy signal on the cloud, exactly what we highlighted earlier this month
So where could this go?
Using the recent structure as a measured move gives us ro
Major BearishAs I said before, long-term yields appear to be trending back up.
Internationally this is happening and now U.S. yields are following.
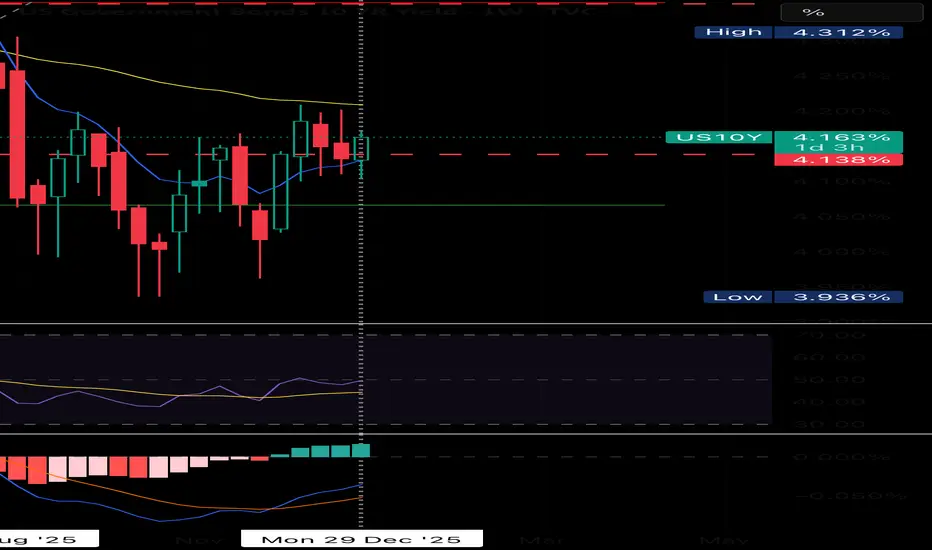
4.30% on the 10Y is a major bullish sign for rates if we close above it. We did not yet today, but based on the momentum and trend, we could close above it tomorrow.
Be very careful. This is NOT a buy the dip point in time.
This is a secure the hatches, take profits, put cash on the sidelines point in time.
A close above 4.30% (in my opinion), indicates that t
Bailout about to happen ? Intraday move of 25% in bonds WTF?We just got an intraday move of 25%
The Chinese article over the weekend front ran this
now look at it ?
Will the have to bail out the banks again and inject liquidity ?
OK its a monthly chart but you get the point
Golds ripping to say 5k silver to 100
Carry trade ? got to be eating into someone lunch!
The bond market knows whats going on I would say its stressed atm!
Bail out times are approx but you get the picture it was 20 T in the covid days, it was a fair bit to back in 2008
US 10Y TREASURY: 4,2% is broken, pending confirmationThe 10Y US Treasuries were testing the 4,2% level since September 2025, while this level was finally and strongly broken to the upside on Friday. The 10Y yields closed the week at 4,231%. Why is this event so important at this moment, when the market is talking about Fed rate cuts? The thing is that the Fed can impact short term rates, but investors are determining what returns they want for holding US Treasury bonds for the long term period. This is sort of market communication which is noting
US 10Y TREASURY: Crossroad ahead of inflation data The 10Y Treasury yields rose near multi week highs during the previous week, moving around 4,16% and 4,21% as markets digested the latest US jobs data on Friday. Yields initially climbed on the mixed December payrolls data, with modest job gains, but a drop in the unemployment rate reinforced expectations that the Fed is unlikely to cut rates imminently. The December jobs report showed weaker payroll growth than expected, with only 50K jobs added, yet the unemployment rate unexpectedly fell to 4
The Yield Curve: A Forex Trader’s Early Warning SystemTradingView added the Yield Curves tab (found at the bottom right of your chart) to their UI last Year and constantly improved upon it. At first glance, it looks like a tool just for bond traders. But even though I am not a bond trader (yet), I started wondering: Can we use this as an early indicator for Forex trading?
The short answer is YES . While Forex traders usually watch price action and news, bond yields often move before the news hits the screen. In this write-up, I will show you how
US 10‑Year Yield: Quiet… but waking up?The range may look dull, but there are signs of life. The 10‑year has broken above its short‑term downtrend from June, yet it’s still capped by the September high at 4.20% and the 200‑day MA around 4.23%.
Price has now pushed above the Ichimoku cloud, with the lagging line following — a subtle but meaningful shift ahead of NFP and rising geopolitical tensions.
On the weekly chart, strong support from the 2020 uptrend and the 200‑week MA at 3.96% keeps the structure intact. A break above 4.24% co
can the us10y double in 2026?gm,
this is a very contrarian idea.
---
imagine the weather app says calm skies.
yet outside, the trees are bending hard.
that’s what a us10y doubling from ~4% to ~8% during rate cuts would feel like.
---
if the us10y doubled from 4% to 8% while rates were being cut, it would mean the bond market has completely lost trust in the fed. policy says ease, markets say danger. when that gap opens, risk assets usually fall first.
---
lets talk structure for a moment, cause i don't really care a
US 10Y TREASURY: Tests 4,20% ahead of jobs dataThe first trading session in 2026 reflected Fed policy uncertainty and thin volume on US Treasury markets. The 10Y Treasury yield held steady near 4,15% up to 4,20%as thin holiday trading left yields relatively flat. Investors are digesting fed policy expectations, including pricing in multiple potential rate cuts this year and watching upcoming economic data that could influence the path of interest rates. The market's focus remains on the Fed's outlook and labor data, with the 10Y yield linger
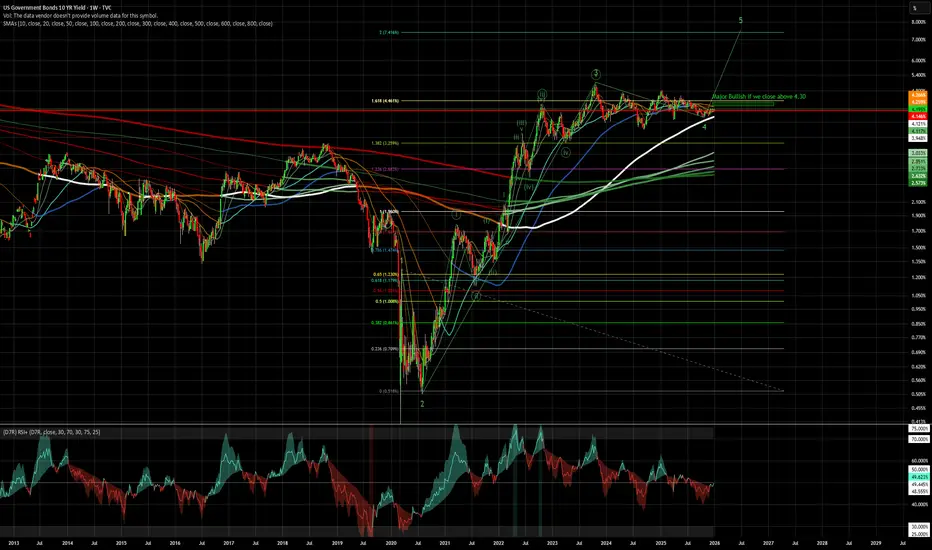
Bullish RatesWatch Out if the the 10Y closes above 4.30.
I would start getting very bearish on equities if this happens.
Price action on yields here indicated higher long term rates.
It is currently setting up as if the tax protest will happen.
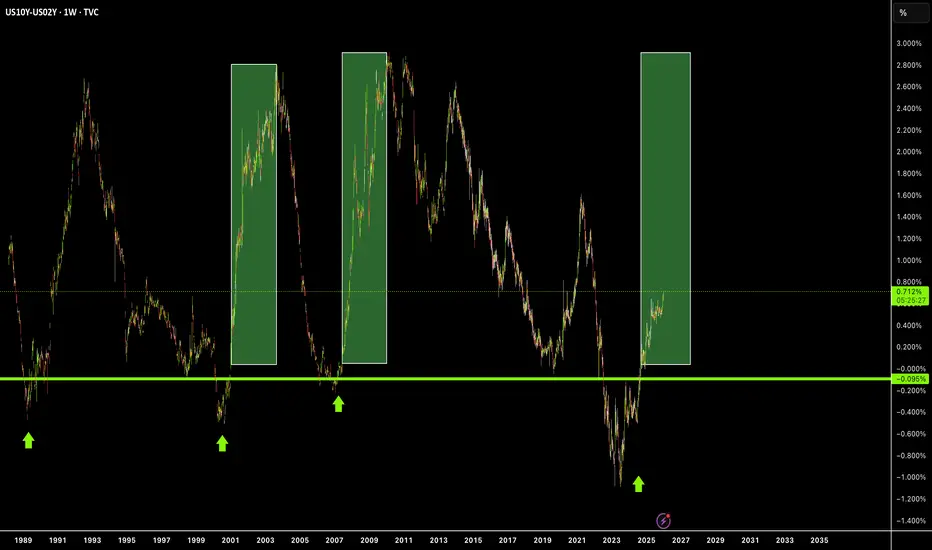
The wave count here is just a suggestion for this outcome. Long-term rates could spike one final time before the Fed panics. This also lines up with the 10Y minus 2Y yield curve uninverting. The uninversion has started, but typically it will shoot up before downturn
US10Y Expected rising yields can turn stocks bearish in 2026.The U.S. Government Bonds 10YR Yield (US10Y) has been consolidating since 2023 within a Triangle pattern, while the stock markets had one of their strongest Bull Cycles in recent history. Before than in 2022, the US10Y rose aggressively, while stocks took the opposite turn, having a Bear Cycle.
With the US10Y under a Higher Highs uptrend since 2017, while also turning its multi-decade Resistance of the 1M MA200 (orange trend-line) into Support, the long-term trend has long shifted to bullish. A
US10Y10Y Treasury Outlook – Structural Demand for Higher Yields (2026 Thesis)
This idea is based on a macro-structural view, not short-term noise.
My thesis is that 10-Year Treasury yields may trend higher into 2026, driven by sustained capital requirements tied to national-priority investments, not temporary inflation spikes.
The United States faces long-horizon funding needs in:
• Military modernization and defense technology
• AI infrastructure (chips, data centers, cyber systems)
• Electrical
US 10Y TREASURY: relaxing Holiday weekDespite the Christmas holiday and non-working day, US Treasury markets continued to trade in a mixed manner. During this period of time, currently important macro data are not posted, in which sense; the market is searching the catalyst for moves in one or another direction. During the previous week, the 10Y Treasury yields tested the 4,2% current resistance level, however, swiftly turned toward the downside where 4,1% support was tested. Yields are closing the week at 4,13%.
The week ahead bri
Global Economic Indicators & Macro Data Trading1. Understanding Global Economic Indicators
Economic indicators are statistical measures that reflect the overall health and direction of an economy. They are broadly categorized into leading, coincident, and lagging indicators.
Leading indicators signal future economic activity. Examples include Purchasing Managers’ Index (PMI), consumer confidence, building permits, and yield curves.
Coincident indicators move in line with the economy, such as GDP growth, industrial production, and employme
US 10Y TREASURY: Narrow trading ahead of HolidaysThe US job market, inflation data and University of Michigan inflation expectations were shaping investors sentiment on a Treasury bond market during the previous week. The jobs market remains relatively slow, with an increased unemployment rate to 4,6% in November. On the other hand, inflation in November stood at 2,7%, below market expectations. University of Michigan next year inflation expectations are further decreased. Investors were weightening whether this could be an indication of a pot
The 6M United States 30-Year Treasury Bond YieldThe 6M United States 30-Year Treasury Bond Yield, Is Near A Top Area Between 4.80% - 5.28%, Which Means It's The Near A Bottom Of The Bear Market & Once We Reach Around 1.90% Is When We Will Reach The Top Of The Bull Market. So We Should Have A Huge Swing To The Downside Coming On The United States 30-Year Treasury Bond Yield. Which Will Kick Off The Huge Bullrun For The Market. We Are Nowhere Near Down Yet Just. Letting Yall Know 😁 👌