Government bonds
US10Y ELLIOTT WAVE ANALYSIS: 19 DEC, 2024©Master of Elliott Wave: Hua (Shane) Cuong, CEWA-M.
The entire ((2))-navy most recent completed as an (A)(B)(C)-orange Zigzag, and the ((3))-navy is now retracing to push higher.
It is subdividing into a (1)(2)-orange, and they have completed, since the high of 4.126%, the (3)-orange is unfolding to push lower, targeting the high of 5.163%
Bund: Bearish Crab Formed, Potential Head & Shoulders Breakdown FX:BUND
The Bund has recently formed a bearish crab pattern on December 6th at 136.42, which triggered a pullback. It's worth noting that this level coincided with the monthly fractal resistance from August at 136.25, a key zone that could lead to a significant rejection. With the new support established at 134.38, we are now at a critical point where a head and shoulders pattern may start to develop. If this pattern completes, it could push Bund back to 132.46, marking a strong bearish mov
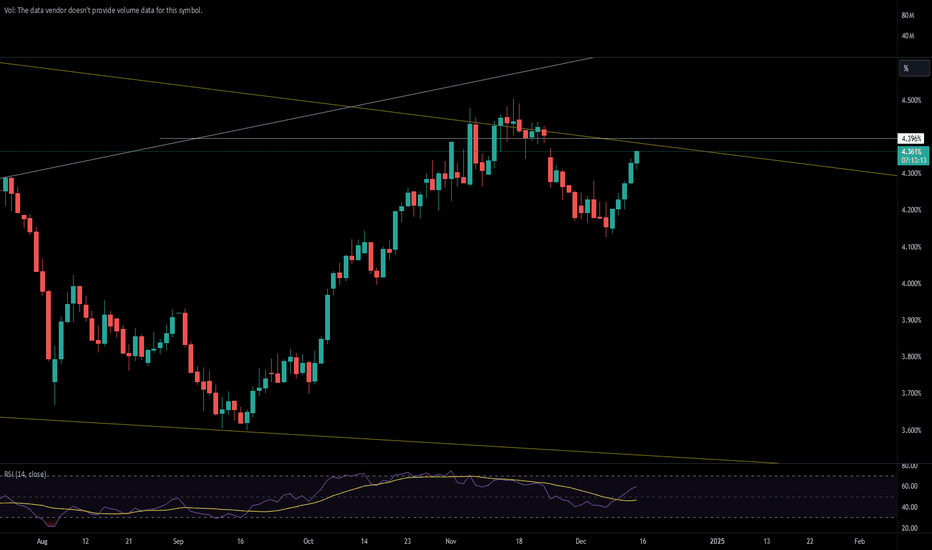
US 10Y TREASURY: expecting a 25 bps cutAs the Feds December meeting is approaching, so the market nervousness is increasing. During the previous week the 10Y US benchmark reverted back toward the 4,4% level, from 4,2% traded previously. Such a move was a reflection of market expectations that the Fed will cut interest rates by additional 25 bps on December 18th. Also, ahead of the FOMC meeting, November inflation data was published, showing 0,4% increase in November, higher from market expectation of 0,2%.
Increased volatility migh
Weekly Leading Indicator Panel warns...Reviewing the Weekly charts, especially for the leading indicators, it appears that there is a warning of downside risk imminent.
SG10Y bond yield are about to break out.
JNK TLT and TIP all have bearish engilfing that covers the previous gap up.
Thing is, the coombined US equities chart is somewhat bullish, with a rough bearish harami at the bearish best indication.
Even SOXL appears to be bullish somewhat...
No action needed, but just an early warning given to set the boundaries yet again..
10 year - 3 month yield curve has un-invertedThe past may not predict the future, but history does tend to rhyme.
In the past, within 3-8 months of the 10-year/3-month yield curve un-inverting, the world was hit with:
*** 9/11 in 2001
*** The Great Financial Crisis, also known as the subprime mortgage meltdown, in 2008
*** COVID-19 lockdowns in 2020
It's an odd phenomenon that we live in a time when shorter-term maturity vehicles have rewarded investors with more yield than longer-term vehicles. In this case, a 3-month US Treasury Bil
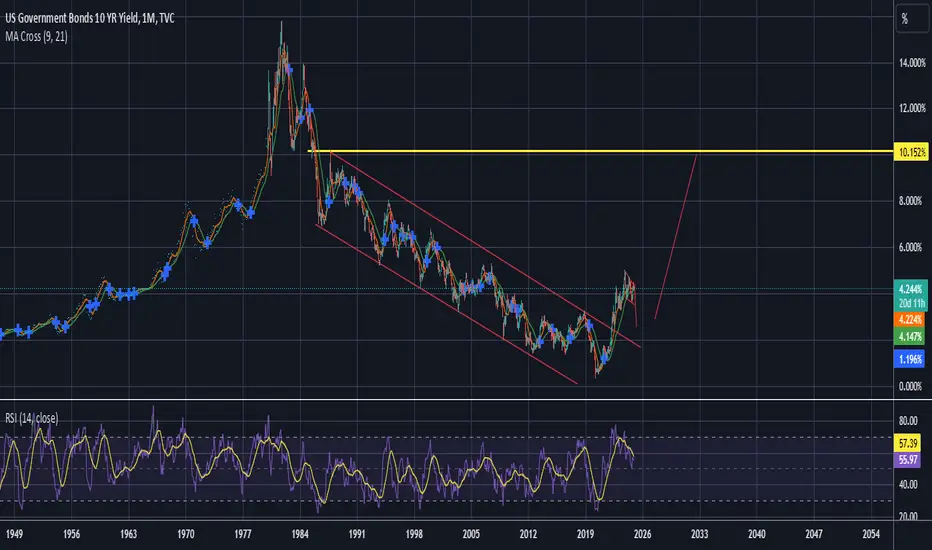
US10Y - Elliott Wave AnalysisNot sure if this will happen but if it does, what does it mean ?
1. Impact on the US Dollar
Strengthens the Dollar:
Higher yields attract foreign investors seeking better returns, increasing demand for the US Dollar.
Rising yields often coincide with expectations of tighter monetary policy by the Federal Reserve, which further boosts the dollar.
2. Impact on Gold
Negative for Gold:
Gold is a non-yielding asset, meaning it doesn’t pay interest or dividends. When bond yields rise, the opportunit
US10YLooking for a sign? Then this is it. Thats how I set my mind to analyze charts. Here we are looking for buying support reasons and to hopefully minimize risk as much as possible. We looking to buy on bigger timeframe as opposed to the Sell we spotted on Hourly timeframe which for the bigger timeframes may not even appear when the Daily candlestick is completely formed. So, we looking to buy here, if you sell, be extra cautious esp with the SL.
US 10Y TREASURY: inflation data aheadThe NFP data were in the center of market attention during the previous week. Analysts perceived posted data as “not too hot and not too cold”. Indeed, they were somewhere in between. The US economy added 227K new jobs, which was higher from market estimate, but at the same time the unemployment rate reached 4,2%, a modest increase from 4,1% posted previously. Regardless of these mixed data, CME FedWatch Tool is showing 85% odds for a 25 bps rate cut in December. It should be taken into account
US10Y Government Bond Yield Could Test 3.8% SoonUS10Y Government Bond Yield Could Test 3.8% Soon
The price is showing the completion of a complex pattern that could push the price further.
A very strong resistance zone is found near 4.16%, which was just broken.
Additionally, overall market expectations regarding a potential Federal Reserve rate cut during the December meeting by 25 basis points or higher speculation may push the US10Y Government Bond Yield down even more.
Let's see how the price unfolds during the coming days.
You may f
Yield Curve This Time is The SameStandard 10-2 yield curve, zoomed out and smoothed, shows this time is not different. In fact, if you made the correct assumptions in the 1980s you could have calculated exactly what is happening today using some kindergarten mathematics. Remember that when the crisis unfolds and the news rationalizes the recession and market corrections that are right around the corner.
Chart: US10Y-US02Y 12 month close line
US10Y: Hit the 1D MA50. See how to trade if it breaks.The U.S. Government Bonds 10 YR Yield has turned bearish on its 1D technical outlook (RSI = 42.524, MACD = 0.005, ADX = 44.101) and since last Friday it has been trading on the 1D MA50. That was the first test of this trendline in 2 months and even though yesterday's candle closed under it, we don't have a decisive breakout yet. A candle considerably below it, should test the 1D MA100. This is part of the larger Channel Down and a crossing under the 1D MA100 validates that this is the new bearis
Treasuries to Bitcoin reverse coorelationWhile Bitcoin and crypto are new to the game as opposed to classic assets like bonds, we can see in 2020 there was a specific and rather chilling hedge against the market.
We know if the inversion of the short and long tail yields invert from short > long rates back to short < long, a timer is activated in the shifting of treasuries from short to long in a stabilization to normality, however observing the US02Y/US10Y back testing will show us that a recession is months away after the values re
Market Update: EU 10-Year Yield Under Pressure The 10-year yield has faced mounting pressure over the past month, and we’re now approaching critical support levels—notably, 2.00/2.01, the recent low.
🔍 Key Insights:
• The RSI has dipped to 16, suggesting that this zone may hold on the initial test.
• However, the broader pattern since 2023 is starting to resemble a potential topping formation.
⚠️ What to Watch For:
A weekly close below 2.00 could expose the market to significant downside risks:
➡️ Targets include:
• The 2024 low at 1.89
• Th
US 10Y TREASURY: NFP on scheduleRegardless of a Thanksgiving Holiday in the US, during the previous week the 10Y US Treasury yields slides back till the levels from October this year. The yields started the week around the level of 4,42% while they are ending the week at 4,17%. Feds favourite inflation gauge, the PCE Price Index was released early in the week, which was in line with market expectations. On the other hand, FOMC November meeting minutes were released suggesting a Feds members conclusion that in case of further i
US 10Y TREASURY: watch for October PCEPrevious week markets spent on digesting currently mixed economic data as well as statements from a few Fed officials. The most important question at the moment is whether the Fed will cut interest rates at December's FOMC meeting or not. Statements of two Fed officials were rather mixed. On one side, Chicago Fed President Goolsbee noted his view on a need for more rate cuts, but the pace of it should not be speeded up. On the other side is Fed Governor Bowman, who stated that the fight against