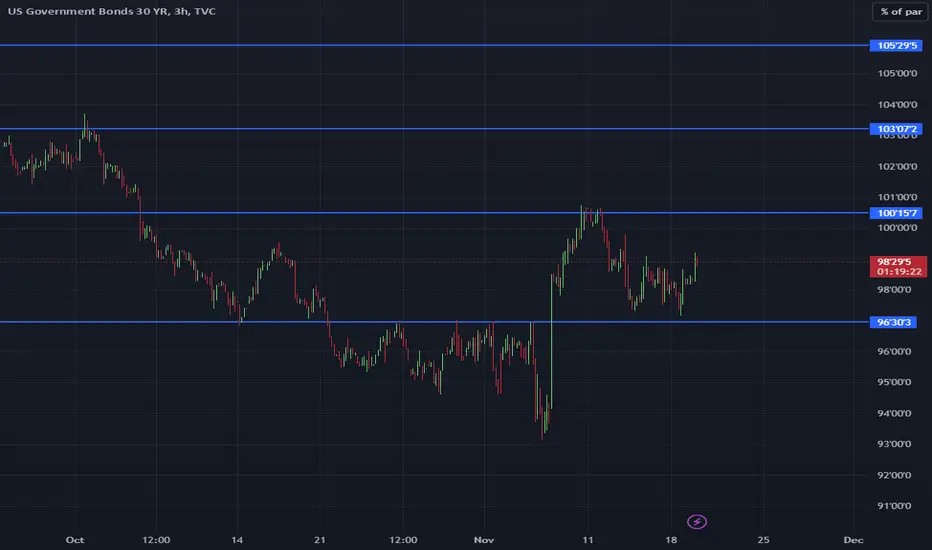
Bonds, gold and nextwe see, every wave has shorter distance on the time 200ma and when ever price touches to 20 ma, it stars falling. We also see indicators has sell signal.
How ever it still has LITTLE chance to see top side of channel quickly because momentum looks very wavey (green arrow).
In this case i put my bet for bears. Because there is more reasons for me(yellow arrow).
Also i want to notice that bond and gold has still correlation. NOT like before but still...If we look from this point gold has alre
Government bonds
US DOLLAR - Let Me Explain My Bearish Thesis...In this video, I’ll share why I believe the markets are on the verge of a major downturn.
By analyzing the US dollar chart alongside Gold, the S&P 500, and Bond Yields, I’ll explain why we may be approaching the final stages of this market cycle for stocks and asset prices.
This shift could devastate the economy, setting the stage for the next bull market. While the extent of the drop will depend on market forces, I’ll explore how such a scenario could unfold. We’ve already seen Oil prices pl
Long Term - US 2y with SPYThis 2 year plan is explained below.
Chart = US 2 year on the top // SPY on the bottom
To understand my charting and thought process, if you wish to, it’s best to start with the macro idea here. I’m tracking the US2 year yield. The peaks in ’89, ’00, ’06, ’18 and ’23 have created overturned cycles leading into recessions. Sure, the 2023 peak has not yet resulted in a confirmed - back dated - recession but the data is thick enough to predict one in my opinion.
I think an equally important poin
US 10Y TREASURY: Fed is not in hurryPrevious week on the US Treasury bond market was marked with Fed Chair Powell's comment that the Fed is “not in a hurry to lower interest rates”. The note came from Feds perception of a strong US growth, in which sense, there is no need to cut interest rates too soon. This marked investors confidence, so 10Y Treasury yields continued their path toward the upside. The highest weekly level reached was 4,49% at one point, however, yields are ending the week at 4,44%.
It will take some time until
XAO - AU10YR - Australian Stock Market - 10 YR Bond YieldsStarting with this video, I'll begin incorporating insights from AriasWave into each new release.
Here, I dive deep into what I believe to be the true pattern of the Australian Stock Market and discuss what might unfold next.
I also analyze 10-year bond yields, presenting a case for significantly higher rates—potentially reaching at least 16%. This isn't just about making bold predictions; I break down the reasoning behind these conclusions using detailed wave analysis.
US10Y 1D RSI Bearish Divergence signals a long-term sell.The U.S. Government Bonds 10YR Yield (US10Y) has been trading within a Channel Down pattern since the December 27 2023 Low. The price is above both the 1D MA50 (blue trend-line) and the 1D MA200 (orange trend-line) and is approaching the patterns top.
The 1D RSI is already making a bearish reversal though, having posted Lower Highs against the price's Higher Highs, which technically is a Bearish Divergence. As a result, we expect the Bullish Leg to top soon and then reverse to the Channel's new
The Best Explanation of The Bond Market You're Ever Gonna Get12 Month US10Y Bollinger Bands between 2.5 and 2.9 Standard Deviations away from a moving average model greater than 4 years in length, preferably exponential. I haven't optimized this to perfection, but it's close enough to give you the basic idea.
The bond market is just a simple oscillator emerging from a complex system and simply does what every other very large and complex system does. It has a trend around which it travels but in decades and centuries not years. It isn't complicated, but
US 10Y TREASURY: still digestingIt was an interesting week for US Treasury bonds. Although markets went into hype after the election of Donald Trump as the next President of the US, the 10Y Treasury yields remained out of this scope. Their exclusive focus was on the FOMC meeting and Fed’s next move. As expected, the Fed cut interest rates by another 25 bps, with a solid overview of the US economy at this moment. The 10Y Treasury benchmark reached its highest weekly level at 4,47%, after which some relaxation came, down to the
US 10Y Yields - 4.493% Is Up For Debating Bullish but taking a lot of cautions due to the current sentiment at the moment.
Low resistance liquidity run from 3.599% to 4.386% in a little over 7 weeks is a trend that could continue but as a trader who likes to see both sides of the story, it's; only a matter of time before the trend will reverse.
The real question is when??
10Y BOND MARKETS CAB DROP TILL!!!!!HELLO FRIENDS
AS I can see 10Y Bond markets to have Drop with a view of technical analysis it had tested trend line on 3rd test and fail to break and if we see Fib retracement then don't forget its just starting and can test golden ratio 0.50 & 0.618 easily chart is based on 4hr TF till design TP
Friends this is just a technical view share Ur thought with us on this chart stay tuned for more updates
Yields USA
1. 1-Month Yield (4.596%):
- The short-term yield here is the highest, which might indicate a risk premium for investors lending to the government over such a short period. This could also reflect the Federal Reserve’s current monetary policies, which may be keeping short-term rates high to combat inflation.
2. 1-Year Yield (4.316%) and 2-Year Yield (4.252%):
- The yields for 1-year and 2-year bonds are slightly lower than the 1-month yield, which is unusual in a normal yield curve, wher
Three days after elections and one after FED cutStarting with #VIX the value decreased a lot after elections showing the decrease in investors fear
With less fear we can follow the #SPX #DX1! #BTC1! which strongly rise their value.
Commodites in general seems to had loss some points with Dollar strength, in this chart we can watch #GC1! and #BZ1! as benchmark
In the case of Brent we can see a double top even with line chart.
#US10Y decreased after 25bp cut nevertheless with Trump election US will probably activate more worldwide tariffs a
US10Y: Rejection at the top of the 1W Channel Down. Prime short.The U.S. Government Bonds 10 YR Yield may still be bullish on its 1W technical outlook (RSI = 59.113, MACD = 0.016, ADX = 38.613), but this week's candle is getting rejected at the top of the 1 year Channel Down. If it closes in red it will be the first in almost 2 months and a clear technical signal that a bearish reversal has started. The 1W RSI has also started to reverse. As a consequence, we are turning bearish on the US10Y as of now, targeting the 1.1 Fibonacci extension (TP = 3.480) where
US10Y BazookaOn US presidential election day, as a Donald Trump victory began to look certain, US Treasury yields experienced a startling increase in the span of a few hours. Truly extraordinary.
But is this the start of a new trend or just an acceleration of the old trend? The US10Y was so far rejected at resistance it was preordained to test. Maybe nothing has changed and we go down from here?
Hidden Bearish Divergence on Yield US Treasury 10YrWhile RSI 14 reach above 70, TVC:US10Y formed a lower low compare to when the last time RSI 14 were above 70 (Apr'24). They say this is a hidden Divergence, a Bearish one.
I predict the Yield will fall to 3.6% but still within the Bullish Continuation pattern in the medium to long term. Meaning that the strengthening price of US Bond is temporary before they fall and push the yield higher to the level of Global Financial Crisis in 2008.