Government bonds
DXY — Daily Structure at a Decision PointThe dollar has completed a prior volume imbalance fill at 97.853 and is now trading against the lower boundary of the daily range.
Participation is low, consistent with late-December conditions. In this environment, daily closes matter more than intraday movement.
Key level: 98.030
This is the prior daily range low.
A daily close below 98.030 shifts the daily bias bearish
Without that close, downside pressure remains internal to the range
The move into imbalance without expansion suggests p
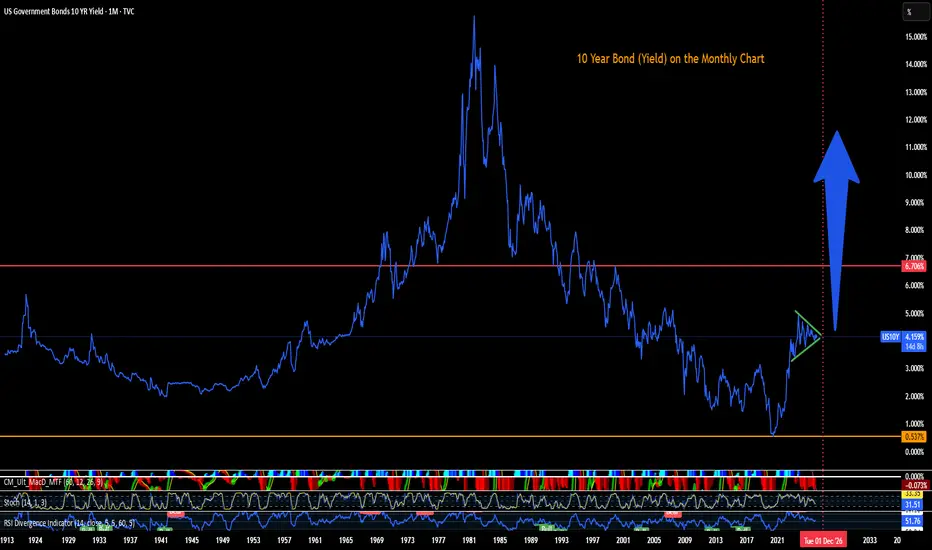
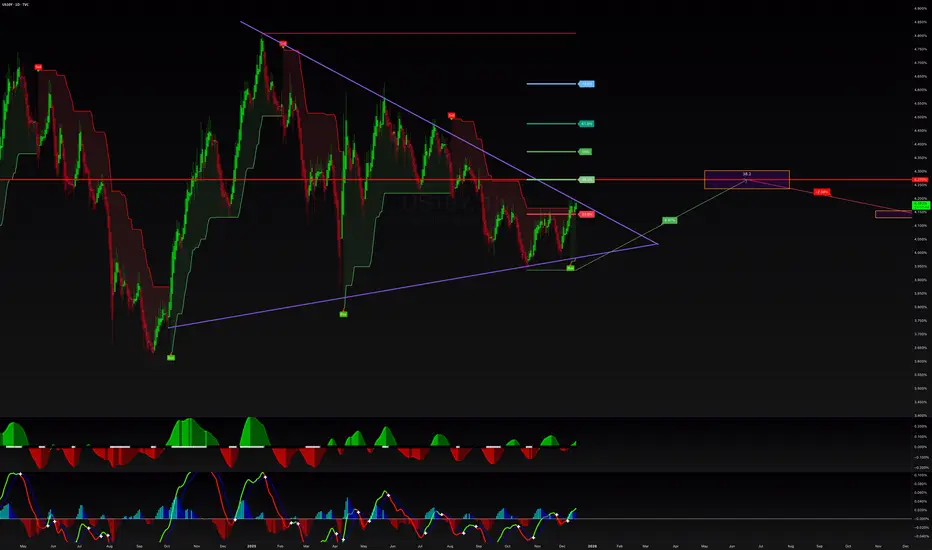
The US 10-year yield has been stuck for 2 years… Markets on Edge: Is the US 10-Year Yield Breaking Out? 🚨
Investors are bracing for this week’s jobs & inflation data—the final major economic releases of the year. With the Federal Reserve divided over rate cuts and the Supreme Court weighing limits on Trump’s authority over the Fed, uncertainty is everywhere.
📉 U.S. Treasury yields dipped Monday, but the 10-year yield is showing signs of life:
- Resistance from May has eroded
- Testing September highs near 4.20%
- Eyeing the 200-day moving aver
10Y-3MO Yield Curve Un-InversionWhich came first, the chicken or the egg? Or in the economic sense, the instability in the financial system or the Black Swan event? Regardless, if history tends to rhyme, this is one out of many indicators to keep in the back of the mind. I don't want to ring any senseless alarm bells but keep am keeping my eyes peeled.
1.) The unemployment rate has bottomed and turned a corner -- it's rising and I anticipate an acceleration.
2.) Inversely, the Fed Funds Rate has topped for the cycle and
US 10Y TREASURY: Testing 4,2%The Fed decreased interest rates by 25 basis points as it was expected. The economic outlook remains modestly positive, with risks on both inflation and jobs. The Fed does not perceive that the inflation would return to targeted 2% during next year. That could be a short summary of the latest FOMC meeting, held last week. The 10Y Treasury benchmark yield traded higher, despite a short drop toward the 4,1%. Friday brought another shift back to 4,19%, after Chicago Federal reserve President Austan
10YR Heading HigherIt is very likely as long as this trend continues that the 10-year goes back up to test the 4.3% level. If the administration can get the long end under control like they would like to, then we could see a move lower from there. But for now prepare for higher rates for at least a few more months.
US 30-year yields hit post FOMC highUh-oh. This is not what you would have expected to see if the Fed was perceived to be more dovish than expected. Also 10y yields show similar price action. Suggests rates will remain high for longer. Possibly a bearish factor for tech stocks. Keep an eye on 30y yields to see if they will break the trend line. Could trigger a bit of vol into year end if it does.
By Fawad Razaqzada, market analyst with FOREX.com
Swap Trading Secrets1. What Is a Swap?
A swap is a contract between two parties to exchange cash flows or financial obligations for a specified period. These exchanges typically involve interest rates, currencies, commodities, or credit risks.
Think of a swap like this:
You have one type of cash flow.
I have another.
We exchange them because each of us prefers the other’s structure.
This exchange helps both parties balance risk, stabilize cash flows, or lock in profits.
Swaps are custom-designed, traded over
AU10Y 8% By 2028The bullish pennant has been broken to the upside.
If similar momentum is maintained in the second half of the move, we might see 8% by 2028.
Each fib level correlates with a resistance zone.
Major Australian banks have already moved to increase fixed interest rates on some loan products out of cycle.
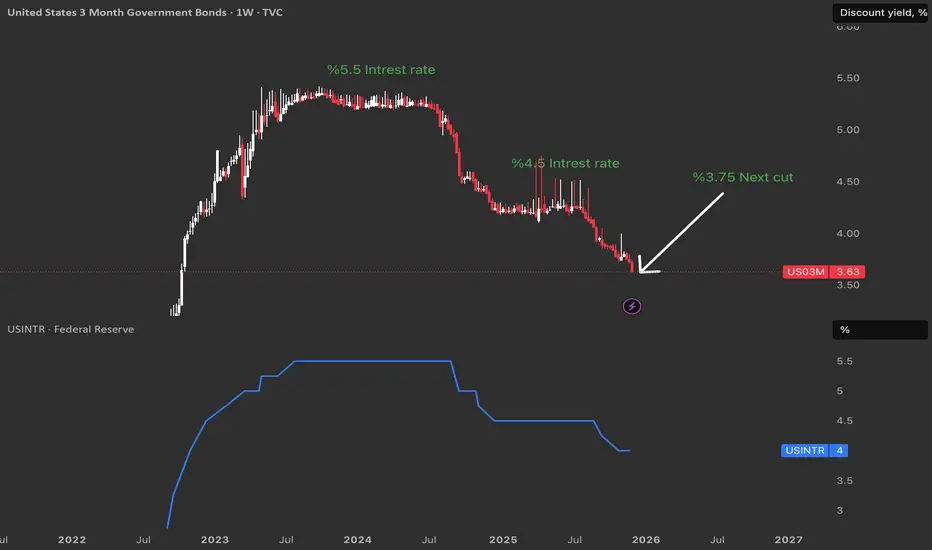
How US03M Are Front‑Running the Next Fed Cut The link between bonds and rates
The US03M tracks the yield investors demand to lend to the U.S. government for three months, and this yield moves closely with the Federal Funds Rate set by the Fed.
When the Fed hikes, short‑term Treasury yields usually rise toward the new policy rate, and when markets expect cuts, these same yields start dropping before the official decision.
Why US03M front‑runs the Fed 🕒
US03M is a pure play on near‑term monetary policy, so traders price in where they t
10 Year 2.4% 2028-2029 10 Year Yields
Using a double curve and a flipped forecast to track this. 2028-2029 yields could be around 2.4%
fed funds in blue
points used dashed lines to market it
3/6/20
12/20/21
11/1/22
1/14/25
keep in mind this can change depending on the global economy and macro events
Digital Dominates the Market & Old Methods Fall Behind1. Digital Transformation: Speed, Scalability, and Efficiency
Digital systems offer lightning-fast operations that traditional methods cannot match.
Where old systems depend on manual processes, paperwork, or physical presence, digital models operate instantly across the globe.
Speed
Transactions take seconds, from online banking to e-commerce checkout.
Supply chain decisions update in real time through sensors and AI dashboards.
Digital communication—emails, messaging, cloud collaboration—
US 10Y TREASURY a 25bps cut – decision weekSeptember's PCE data came just a bit lower than anticipated. The data showed inflation at 2,8%, while the market was expecting a figure of 2,9%. Easing inflation heated market expectations that the Fed will cut interest rates by 25 basis points at their meeting on Wednesday, December 10th. Odds for a rate cut currently stand at 87%. The 10Y Treasury yields turned to the upside during the previous week, after testing support at 4,0%. The highest weekly level of 4,14% was reached at Friday's tradi
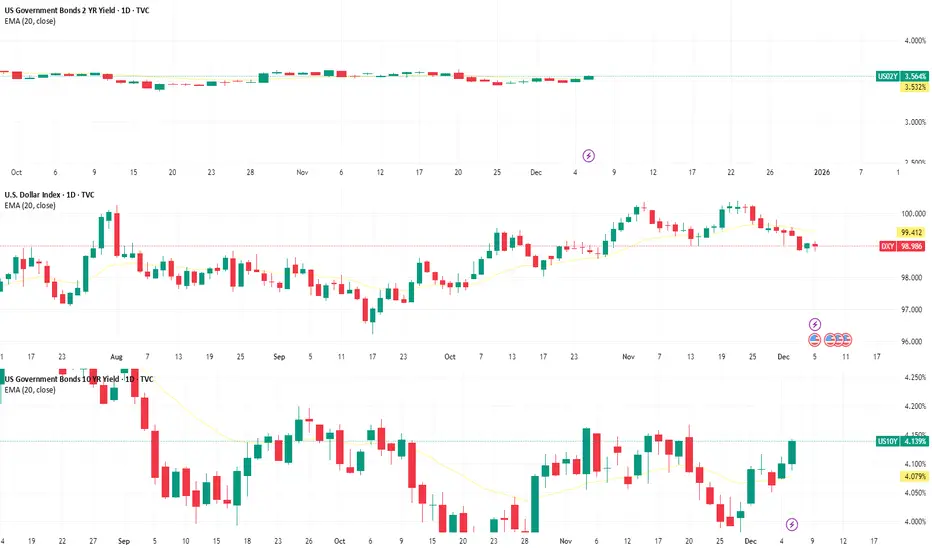
Short-Term Rates, DXY, and Long-Term Rates, Weekly Macro Clarity1️⃣ Short-Term Rates (02Y)
“Short-term yields show mild upward pressure today, though momentum remains neutral overall with a flat 20 EMA.”
2️⃣ DXY
“The dollar eased, pulling back from recent highs. Momentum is cooling but still structurally intact.”
3️⃣ Long-Term Rates (10Y)
“Long-term yields show a clearer rebound, with stronger upward candles and improving structure.”
4️⃣ Macro Alignment
“Overall alignment remains mixed: slight upward movement in short-term rates, a decline in the dollar,
US10Y - move downAt the end of October 2023, we finished the upward move and entered a correction phase.
The higher-level corrections are coming to an end, and in the medium term a deeper move downward is expected.
For a short period, we may still see some upside (or fluctuations) within the correction, but compared to the main move, it will be insignificant.
The reference level is around 2,770 .
---
Please subscribe and leave a comment.
You’ll get new information faster than anyone else.
Together, we’ll grow
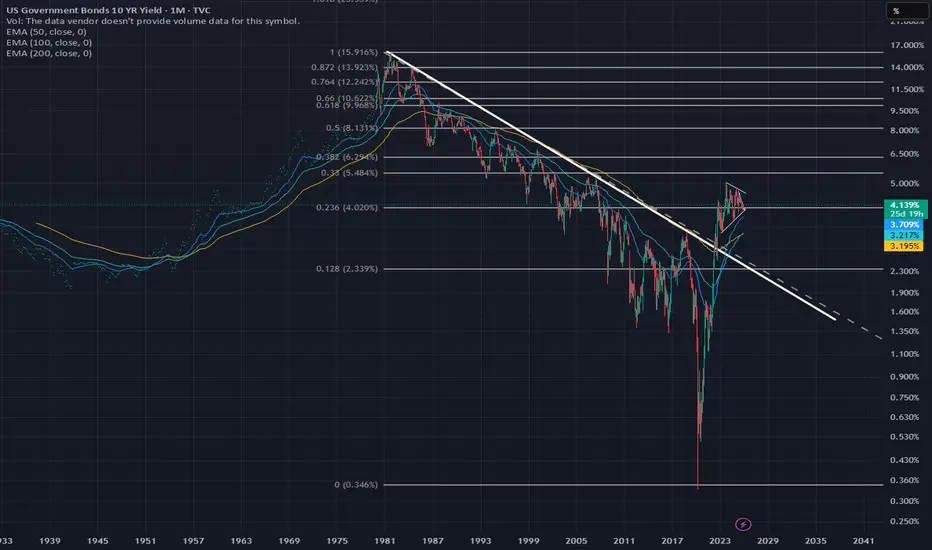
10 Year Yield primed for explosive break outAs the Japanese carry trade unwinds with BOJ having no alternative than to raise rates after decades of real negative rates we expect over 1.3 trillion dollars of Japanese holdings of US treasuries to hit the market along with another 800 Billion Chinese holdings. The 10 Year note is consolidating in a pennant formation which indicates yields rising to a minimum of 10% but chances of rising to 16% to completely retrace the corrective decline. Nasdaq reaches its 55 year Fibonacci run in February
The Bond Markets Effect on the Stock MarketThe trend shown here is what helped me derisk prior to sustained market pullbacks seen during the Covid crash and in early 2022. When the 10Y rises sharply, the stock market usually pulls back in the days / weeks to follow. The major 10Y trend can be seen in my previous post which uses the blue lines shown here to show the large wedge that is forming. Right now we are bottoming on this wedge again and forming an upside down Head and Shoulder pattern. I believe we will have a Santa crash this ye
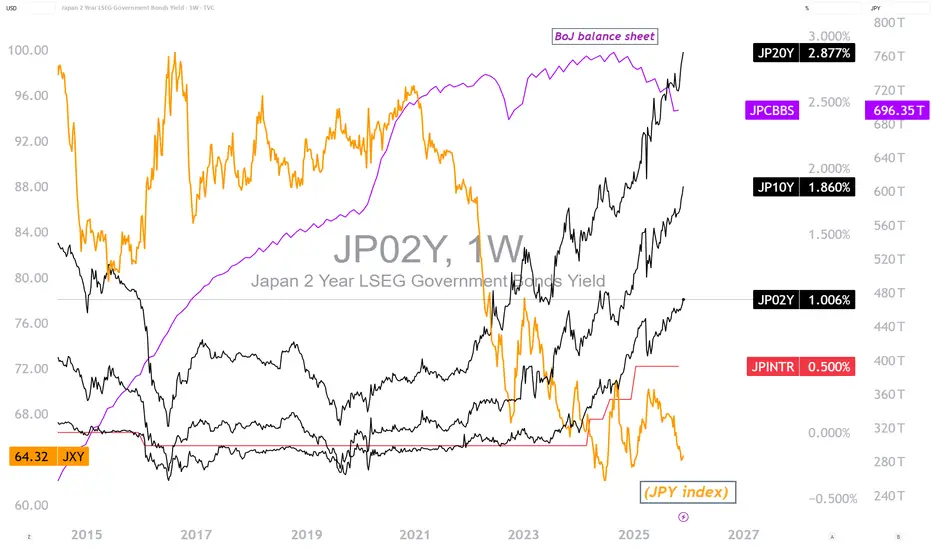
The Earthquake in Japanese Titles: End of an EraJapan's 10-year bond yield jumped to 1.84% (highest since 2008), and the 2-year yield to 1%. The market is pricing in a BOJ rate hike as early as December 2025 (62% probability) or January (90%). The Yen appreciated 0.3% against the dollar.
Macro Impact: Withdrawal of the "Largest Global Creditor": Japan is a massive international creditor. An increase in domestic yields makes Japanese assets more attractive, potentially repatriating capital that was invested abroad (including US Treasury bonds
End of the Yen Carry Trade: What Risk for the Stock Market?For more than two decades, the “yen carry trade” has been a discreet yet powerful pillar of global finance. This mechanism relies on borrowing at low cost in yen—thanks to the ultra-low rates set by the Bank of Japan (BoJ)—and investing those funds in higher-yielding foreign assets (equities, bonds, emerging markets, etc.). The logic was appealing: low financing costs + high returns = profit.
But estimating the size of this phenomenon is challenging. The transactions span loans, bonds, derivati
US 10Y TREASURY: aligning to a Feds cutWeaker inflation and economic output data increased investors sentiment of a potential Fed rate cut at December's FOMC meeting. The 10Y US Treasury benchmark yields reacted to these expectations, pushing yields further to the lower side. The 10Y yields started the week around 4,04%, but reached the lowest weekly level at Friday's trading session, at 3,96%. Still, they closed the week at 4,01%.
Although yields are holding around the 4%, still next Friday might bring some higher volatility, as Se
Economic Future at Risk in the Trading Market1. Heightened Market Volatility and Unpredictability
Market volatility is not new, but its frequency, magnitude, and drivers have changed. Previously, volatility was largely triggered by economic data or company earnings. Today, geopolitical shocks, pandemic-like events, cyber-attacks, and supply chain breakdowns trigger sudden movements across global markets.
High-frequency trading algorithms and automated systems amplify these movements. A minor headline can trigger billions of dollars in bu
S&P 500 HAS PEAKEDI’ve been studying long-term market cycles, and I noticed something crazy on the 2-year Treasury chart that almost nobody talks about.
Every time the 2-year Treasury yield drops below the 54-month moving average, the S&P 500 is either at its peak or tops out within about 3 months.
✔ 2000 – Dot-Com Bubble
✔ 2007 – Housing Crash & Global Financial Crisis
✔ 2020 – COVID Crash
✔ 2025 – Right now
This same pattern is showing up again… today.
And every time it happened, the market entered a major d