JP10Y JAPANESE GOVERMENT 10 YEAR BOND YIELDJP10Y PLAYS A KEY ROLE IN YEN TRADING ACROSS ALL PAIRS
Interest Rate Differential: When JGB yields rise, it increases the interest rate differential between Japan and other countries. This makes JPY more attractive to investors, causing the currency to strengthen.
2. Capital Inflows: Higher JGB yields attract foreign investors seeking higher returns, leading to capital inflows into Japan. This increased demand for JPY causes the currency to appreciate.
3. Reduced Carry Trade: A higher JGB yiel
Government bonds
2024 is a wrap - time for 2025 outlook - let's go2024 will be a memorable year
-23% gains
-Mag 7 + Semiconductors + Bitcoin all contributing nicely
-PLTR was the top performing stock in the S&P 500 (impressive 340.48%)
As always, 2024 wasn't in a straight line up, though it felt like it at times
VIX had #1 and #2 largest single day moves ever (Aug 5 and Dec 18)
April was a sticky inflation pullback month
August was a Bank of Japan deleveraging weekend scare
FED dominated the catalysts with guidance, narrative, and wait and see between emplo
US 3mo as short term Leading Indicator?As I continue to watch bond markets and the 3 month specifically I have noticed a pattern for short term bullish confluence with SPY.
I have highlighted (with the light purple dots) the pops in the daily 3mo chart that occur after at least a five day downward yield slide. Above the 3mo candles is a snip of the SPY chart that corresponds with the initial 3mo daily pop. The text in green notes the percentages over the following 7 and 13 trading days. A couple of the SPY snips actually fell off on
US 10Y TREASURY: adjusting to Fed`s narrativeThe largest surprise during the Holiday week on the Western markets was a sudden move of the 10Y US benchmark yields toward the higher grounds. The 10Y yields reached the level of 4,629% after weightening the Fed`s narrative from the last FOMC meeting. The market is now anticipating a more hawkish Fed's policy in 2025. The next FOMC meeting is scheduled for January 2025, but there is no expectation that the Fed will make any move in interest rates during this meeting. As Fed Chair Powell noted i
Weelky Leading Indicators are NOT BullishThe Weekly Leading Indicators have had broken into Bearish mode.
SG10Y have broken up of a trendline
TIPS and TLT have broken down support
JNK similarly broke down of support
The combined US Equities weekly chart are at an indecision range, but daily chart analyis tells of a more bearish story.
SOXL is holding up somewhat though.
So while all 4 Leading Indicators are red flagging.
The Indices have yet to respond.
Watch for it... and be careful.
Happy New Year 2025!
UP "Please provide a meaningful and detailed description of your prediction..." Says Tradingview
Up. It go up. Why? Idono the same as you do or do not know. It's the simple things I think that makes dollars sound like soundness of mind. While lil Timmy has been working hard to get a few bucks to buy his favorite dog coin he heard about at lunch yesterday in middle school.
Asking a fool like me what to buy with his allowance. Who isn't looking for a return nowadays I guess even at 11 we need t
10 YR StuckAll bets are off until further notice following the Fed day rout. That said, it has been and continues to be the case that any meaningful improvement in rates will require downbeat economic data and softer inflation. At this point in the year, we're waiting until early January for the next major shoes to drop (NFP and CPI, specifically).
10 YR Heading HigherAll bets are off until further notice following the Fed day rout. That said, it has been and continues to be the case that any meaningful improvement in rates will require downbeat economic data and softer inflation. At this point in the year, we're waiting until early January for the next major shoes to drop (NFP and CPI, specifically).
A Turning Point for RatesAll bets are off until further notice following the Fed day rout. That said, it has been and continues to be the case that any meaningful improvement in rates will require downbeat economic data and softer inflation. At this point in the year, we're waiting until early January for the next major shoes to drop (NFP and CPI, specifically).
Comparing US10Y/DXY/US500/VIX, fundamental/technical analysisProposed technical/fundamental analysis for US10Y/DXY/US500/VIX.
Bank unrealized losses on available-for-sale and held to maturity securities was $364 billion in Q3 2024; this number will continue to increase as long-term treasure rates increase (www.fdic.gov).
US10Y yield chart looks for yield to go higher, north of 5%. If treasury rates continue to increase, there may be a bank run, as banks get more and more underwater with their unrealized losses. DXY will go up above 120, US500 will crate
Understanding the US10Y Crab Pattern in 2024
The US10Y refers to the 10-year Treasury bond yield, which is a key indicator of the overall health of the economy and is closely watched by investors.
"Analyzing the US10Y trend, a bearish butterfly pattern has emerged at the 1.276 and 1.618 level, indicating a potential bullish trend in 2023. This pattern suggested a reversal in the current market direction, and The US10Y bond market has been exhibiting an intriguing pattern known as the "CRAB PATTERN," with implications for the year 2
US 10Y TREASURY: only 50 bps in 2025?The Fed spoiled the market game for one more time. Although interest rates were cut by another 25 bps as expected, still the market did not like what Powell said about projections for 2025. He noted that the Fed expects persistent inflation, hence, the current projections are drop in interest rates by only 50 bps. Inflation expectations were also corrected, so now the Fed expects the PCE indicator to end next year at 2,5%, versus 2,2% previously forecasted, while its targeted 2% is expected to r
100 Years of 100% ProbabilityThis Chart shows the normalized Bollinger Band Width for the US Ten Year Treasury Bond Yield.
Basis = 10 Year SMA
Upper and Lower Bollinger Bands = 3.0 Standard Deviations from Basis
Normalized BB Width = (Upper - Lower) / Basis
For the last century, 100% of the time that US Ten Year Yields extended 3 Standard Deviations above their 10 Year SMA while their normalized Bollinger Band width reached this 100 year long trend, rates experienced a sharp and meaningful correction.
*** During World Wa
SG10Y SG Govt Bond Yield UNCANNY heads up on US EquitiesHere is a rehash of the relationship between the Singapore 10Y Govt Bond Yields and US Equities ETF, SPY (Blue Line).
Noted that when the SG10Y technically breaks out, the SPY technically breaks down, and vice versa.
This is not 100% but happens an estimated 80% of the time, and recent occurences since September are marked out with bullish green or bearish red time lines, respective to SPY from the SG10Y leading indications.
Just middle of this past week, the SG10Y spiked strongly and broke ou
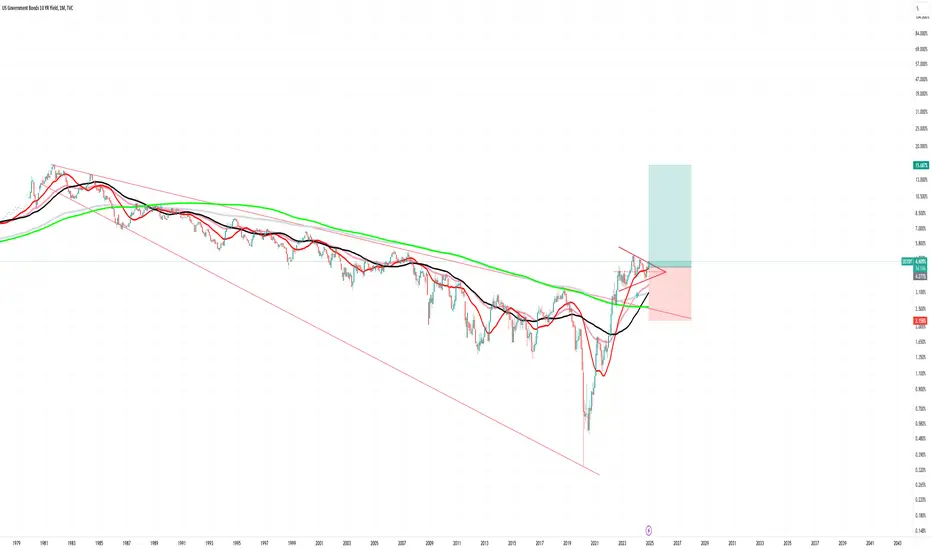
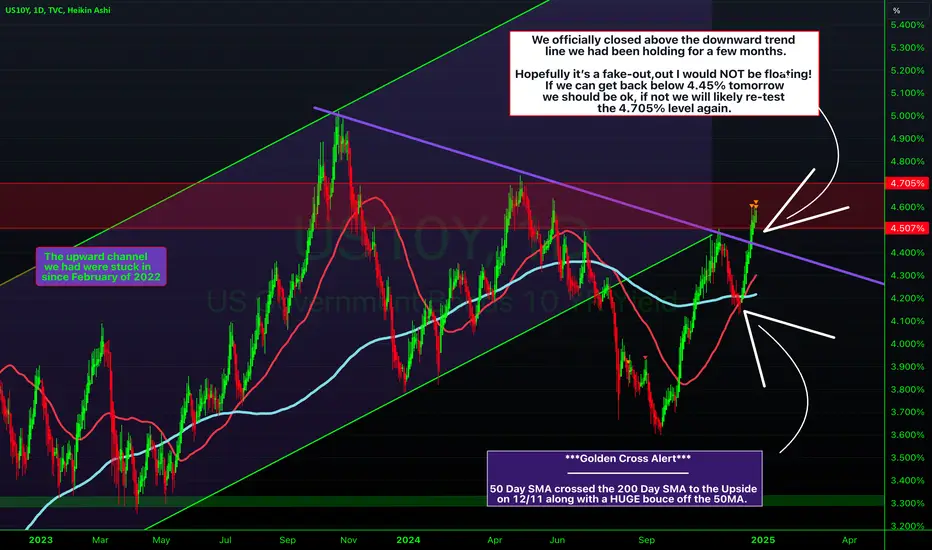
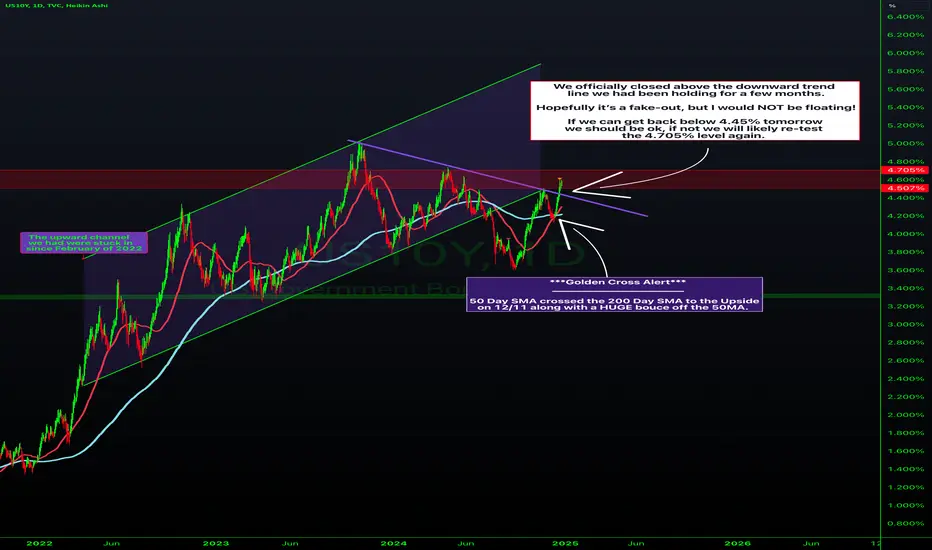
Market Alert: US 10Y YieldBack in mid-October, I mentioned keeping the US 10Y yield on your radar 📊 as it appeared to be forming a potential falling wedge pattern. This pattern, if completed, would indicate higher interest rates ahead.
Well... the time is here! 👀 Should the market close above 4.42% today, this pattern will officially complete.
🔑 Key Levels to Watch:
✅ Ideally, a second close above this zone in the New Year would confirm the breakout.
✅ This suggests not only a retest of the 2023 high of 5.02%, but als
US10Y going lower as Fed has no choice but to continue cutting.More than 1 year ago (November 7 2023, see chart below), we made a bold (for the time being) call on the U.S. Government Bonds 10YR Yield (US10Y), as against the prevailing market sentiment we gave a sell signal, right after what turned out to be a top:
Today we revisit this pattern, following yesterday's Rate Cut by the Fed primarily because of their statements that instead of 4, they will only proceed to 2 more cuts in 2025. We believe this to be false and expect the Fed to quickly resume
Weekly Indicator Panel WARNED last weekend...ALL Red Flags already, as warned by my panel of leading indicators.
You would see that all threshold have been triggered and are clearly red flags IF the week closes at current levels. The week has not ended, but it appears bad enough.
There should be an attempt tp recover somewhat, but overall appears that Santa Claus might crash this rally this year. Furthermore, the year end and year start are keen indicators of the year ahead as well... so watch closely.