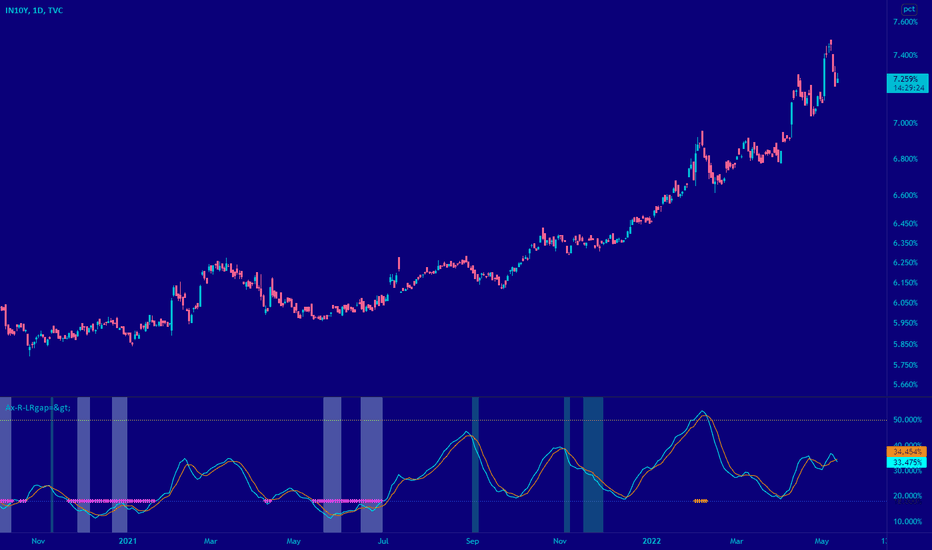
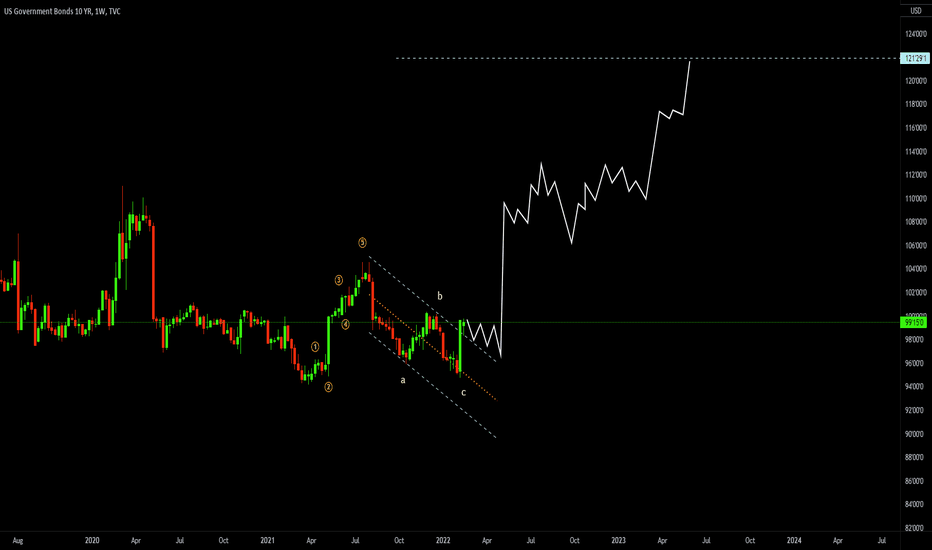
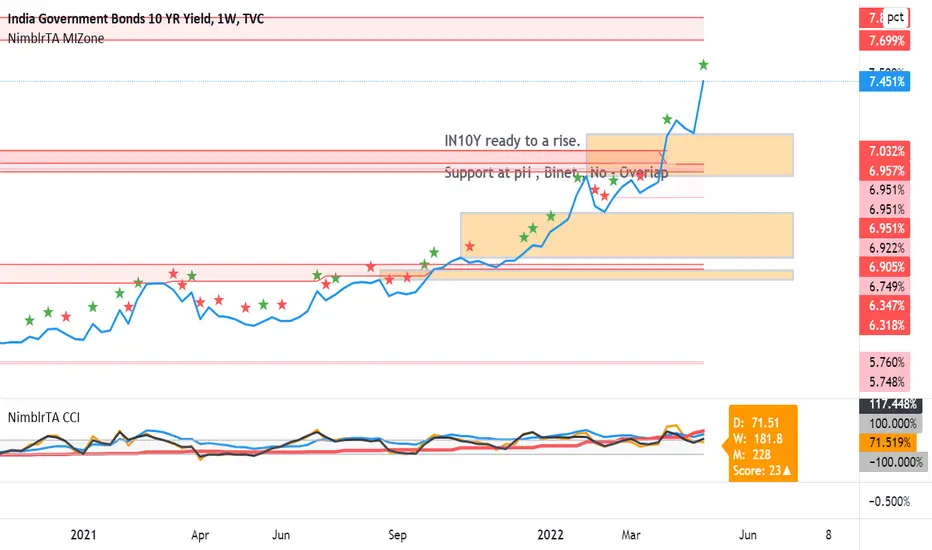
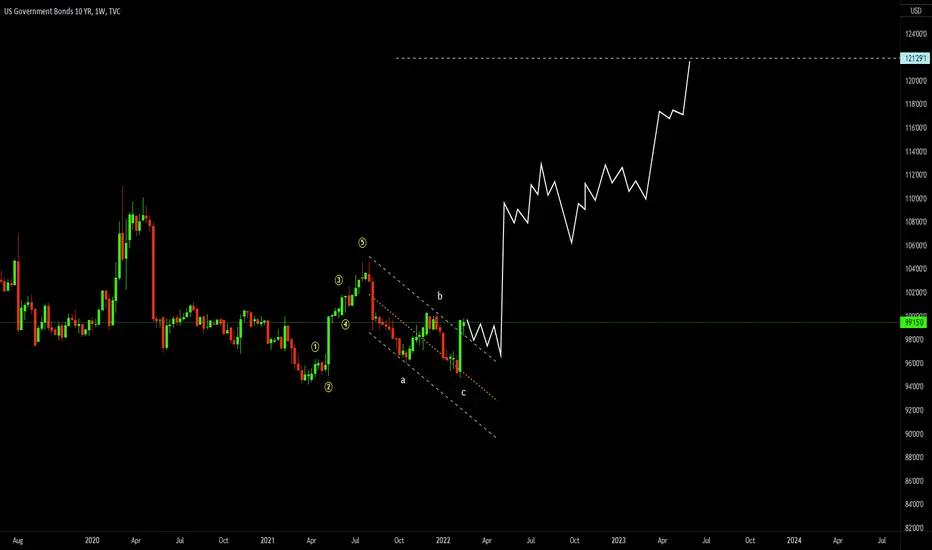
10 Year GSEC Short 10 year GSEC should shed the gains in the next few days.
SL should be on or above 95.76 with appropriate 1:1 to 1:2 RR ratio at least
targets can be 94.5 , 93.67 levels
my choice would be to sell on a flat open with 60-70% position size
add more shorts on rise
add the rest when the low breaches
Government bonds
Recession Incoming? Here is what the technicals say
US10Y-TVC:US02Y
Economists: Recession incoming!
World Leaders: Recession is out of the books.
Whom to believe? Here is my analysis from a technical standpoint👇
As someone who believes in data driven decision making, the technicals point towards a recession. How so?
When the difference between the 10 year bond yield and 2 year bond yield becomes negative, it is known as an 'Inversion in bond yield curve' and this inversion has been a strong indicator in predicting recession.
Since this chart (US10Y-US02Y) started back in 1976, whenever the curve went into the negative zone, we experienced a recession shortly after.
So the question now is, are we in the negative zone? YES!
Recession incoming? Most likely yes!
To all my connections in the field of finance especially, I'd love to know your thoughts on the same below in the comments 👇
Follow AVZ_Trades for more such content
#finance #data #recession #bonds
EURUSD recordingThere have been short-term abnormal fluctuations in interest rate spreads recently
For the euro, two sets of interest rate differentials inside and outside are still used to observe changes in the exchange rate.
The euro exchange rate has always been under obvious pressure. In principle, it is because of energy security issues. Europe's attitude towards Russia has always been relatively tough. Due to energy issues, European economic expectations have dropped significantly. At the same time, the obvious split between the two sets of U.S. Treasury bond interest rate spreads also proves this on the side.
We observed the internal two sets of long- and short-end interest rate spreads, and the long-end interest rate spread showed a clear V-shaped reversal. Although it cannot be determined that the interest rate difference has reversed, it must have a certain degree of support for the euro exchange rate in the short term. The short-end spread structure also appeared a pattern similar to a double bottom.
As the Fed raises interest rates, the European Central Bank has also made clear its attitude, and its expectations for future interest rate hikes by the European Central Bank are also clear. So I can't rule out the external long-end spread as a result of the ECB rate hike.
The long-end spread broke the volatile range, but the overall strength was not very strong.
The short-term interest rate spread also broke out of the range at the same time, and in principle, it began to show a state of obvious stabilization.
The exchange rate still needs to be observed. There are signs of a double bottom on the technical chart, but I am not sure whether the price trend can be maintained. The feeling of staring at the disk is that the euro itself is still in a relatively weak state.
There is also a big question: the ECB said that after raising interest rates, there will be new tools to maintain the health of internal interest rate spreads, but the tools the ECB can use seems to be limited. If this doubt can be dispelled, then it is expected that the euro will have a more obvious rebound.
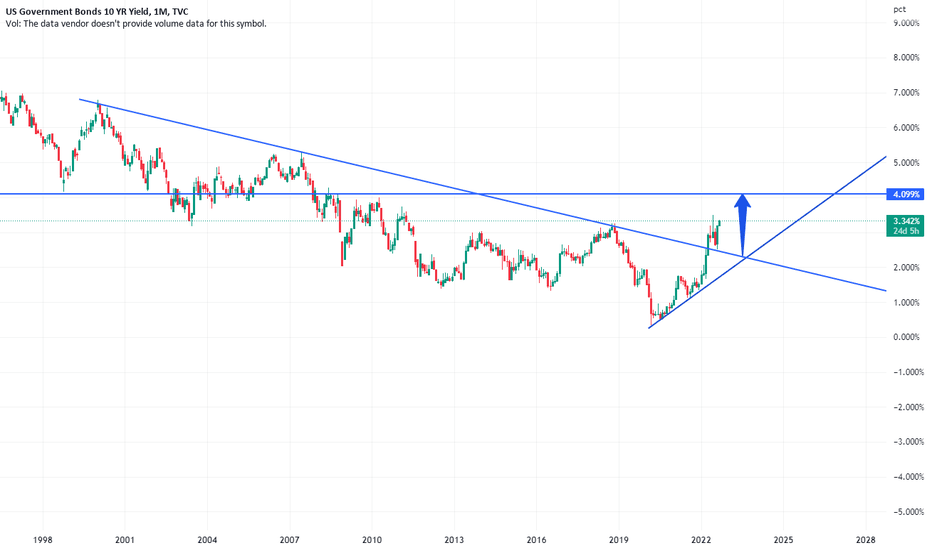
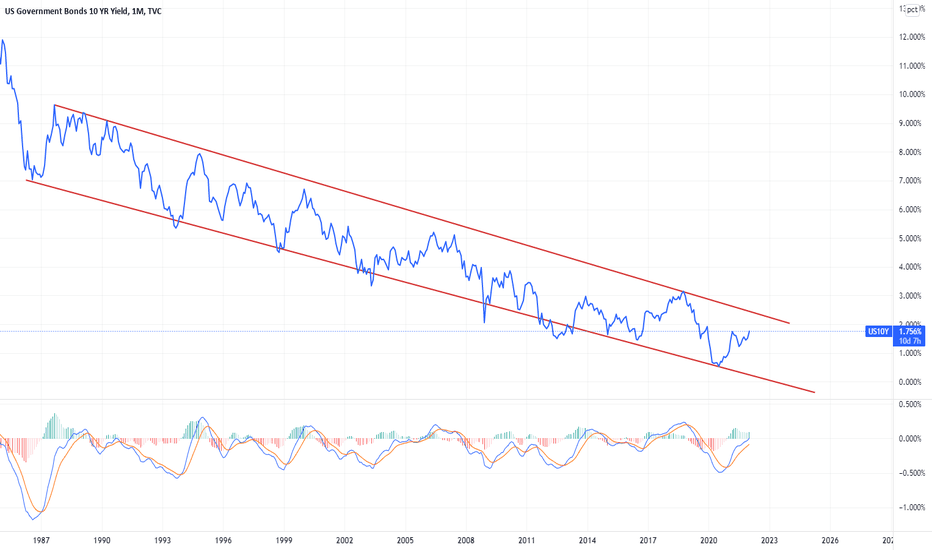
US10Y aheading to cross 2% this timeUS10Y has been trending in a downward channel, currently aheading towards its resistance. It acts as a leading indicator to US equity indexes and works in contrast to major benchmarks.
Disclaimer: View for Educational purpose only, not to be taken as trading/investment advice.
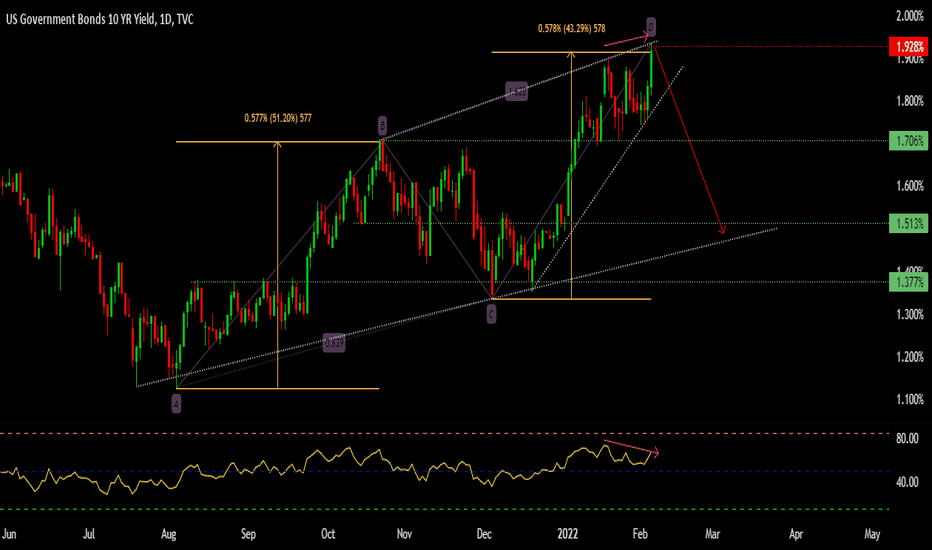
US10Y scaring the markets again?I do not have the detailed economic understanding of this matter but have observed that a rise in the US 10 year treasury yields leads to a overall feeling of fear and turmoil in the markets. Back in the March and April of 2021, US10Y was continuously making news as it was reaching levels of about 1.75, with commentators discussing how a test of the levels of 2 and beyond could lead to a sharp sell off in the markets. But, it failed to move past decisively beyond the 1.75 levels as market on the chart.
_____________________________________________________________________________________________________________________________________________________
Since then I have been following this ticker, US10Y corrected back to levels of around 1.12 which it failed to break below in July and August. After that it had started forming higher lows leading to bullish structure. It was consolidating just below 1.38 trying to break through it, which it finally did on the 23rd of September.
_____________________________________________________________________________________________________________________________________________________
In short, if this trend continues upward leading the US10Y to the April highs of 1.75 and beyond, we could observe the markets struggling to move ahead, also possibly correcting. It would be prudent to keep watch.
Manage risks properly and trade your plan.
Like and follow for more. :)
Rising bond yields are dollar bearishThe number of classic relationships that I have to debunk just to be on the right side and convince the world is just overboard. And the charts are as straightforward as they can be. So here goes stupidity. Rising bond yields are not dollar bullish, at least not in the time frame of this chart. So when bond yields rise then the dollar actually falls. Yes naturally if I sell US bonds and take my money out of the US, the dollar should fall, right? They why do you expect the opposite? Because some overnight Journo on Bloomberg says so? Or because you were taught this in economics class? Interest rate parity in your Forex lecture. Then you find it very hard to accept or explain the chart below. Or maybe you find periods in the chart when the two are directly correlated to make your point. The answer is simple it is a risk on trade till it is not. The day falling stocks cause bond yields to decline, the dollar will rise and it is time to take risk off the table by reducing your market exposure. Till that happens it is all noise. Weak hands get cleaned out this way. Bond yields started to breakout higher above the 2021 high recently and the dollar fell. This is good for risk assets, unless we see that trend clearly change I do not see a reason to be concerned about incremental changes in bond yields.
US10YAt their policy meeting in December, FOMC participants agreed to double down on QE pace to close the same by Mar’22 amid growing concerns about hotter inflation. Fed officials also began discussing at the December meeting about balance sheet (bond holdings), and some policymakers are pushing to start shrinking them sooner and faster than they did after an earlier asset-purchase (QE) program after 2007-08 GFC. Markets would see that as a form of tightening monetary policy because it would signal the central bank’s desire to deliberately slow the economy.
Once the Fed stops buying bonds/assets (after QE tapering), it could keep the holdings steady by reinvesting the proceeds of maturing securities into new ones, which should have an economically neutral effect. Alternatively, the Fed could allow its holdings to shrink by allowing bonds to mature, or runoff (QT-Quantitative Tightening).