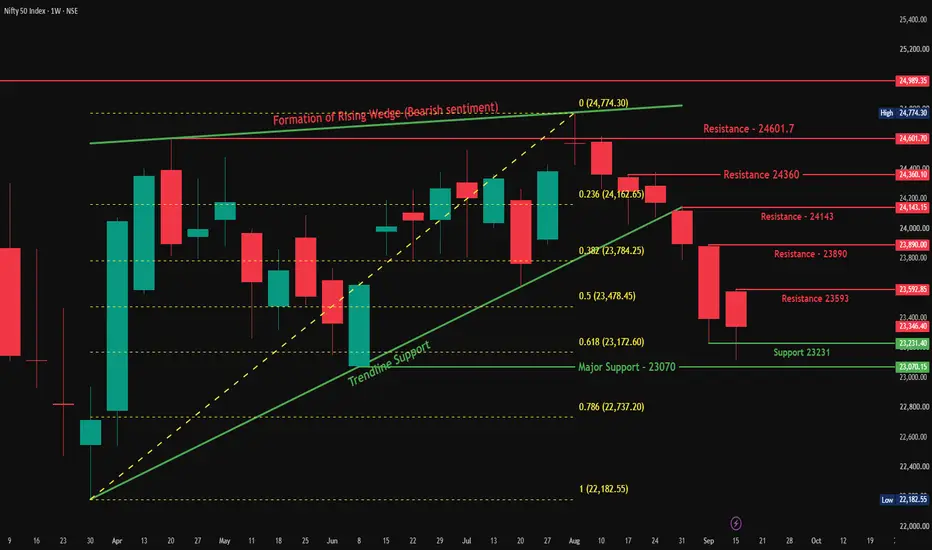
Nifty 50 Trade Plan [21.07.2026: Tuesday]Probable Scenario Analysis and Trade Plan for the Nifty 50 Index NSE:NIFTY for the 21st of July, 2026.
🟢 Bullish Scenario
There is no observable bullish setup. The price needs to first sustain above 24350. There might be a weak bullish move till 24400. There is strong resistance at 24400. N
Market indices
Index collections
Nifty Intraday Outlook for 21-07-2026NIFTY 15 Min Chart Reading
Overall Bias: 🟠 Neutral to Mildly Bearish (until key resistance is reclaimed)
Current Market Drivers
Rising crude oil prices and renewed Middle East geopolitical tensions are weighing on sentiment.
GIFT Nifty indicated a weaker start, while recent FII selling continues
NIFTY – INTRADAY TRADING PLAN | 21-Jul-2026 | Expiry DayPrevious Close: 24,239.50 | Last Intraday Support: 24,162 | No Trade Zone: 24,251–24,317 | Last Intraday Resistance Zone: 24,464–24,510 | Buyer's Support: 24,032–24,055
⚠️ This is an educational post for learning purposes only. Please read levels along with price action, volume & candle confirmatio
Nifty - Expiry day analysis July 21.The price did not give a trending movement today and moved within a range. As per the daily chart, an inside bar has formed today. Sustaining 24200 - 24240 is important to move up further.
Buy above 24260 with the stop loss of 24200 for the targets 24300, 24340, 24400, 24460 and 24500.
Sell below 2
NIFTY Levels for Today
Here are the NIFTY's Levels for intraday (in the image below) today. Based on market movement, these levels can act as support, resistance or both.
Please consider these levels only if there is movement in index and 15m candle sustains at the given levels. The SL (Stop loss) for each BUY trade sh
#NIFTY Intraday Support and Resistance Levels - 21/07/2026Nifty is expected to witness a flat opening with no major overnight triggers. The index is consolidating near the 24200–24250 support zone after the recent recovery, indicating that traders should wait for confirmation before taking fresh positions.
If Nifty sustains above 24250–24300 after the ope
And the volatility continues..As we can see NIFTY again opened weak and remained sideways throughout the day. We clearly analysed that until and unless NIFTY breaks and sustains either of the mentioned levels, it would likely remain volatile. So keep a close watch of these levels and plan your trades accordingly.
Nifty Intraday Analysis for 21st July 2026NSE:NIFTY
Index is the range between 24000 - 24350 range and range bound moment is expected as long as the index will be in this range. If index breaks and sustain above 24350, then -
The upward movement may lead to 24450 – 24500 resistance range and if the index crosses and sustains above th
NIFTY DAILY / Short Range Level Analysis for 22nd Jul 2026🔕 SGMN SplD BULLISH Above => 24257.
🔕 SGMN SplD Bearish BELOW => 24122.
Mentioned analysis based on 2 consecutive candle close in 15 min Time Frame.
━━━━━🟥🟧🟨🟩🟦🟪⬛━━━━━
💥Level Interpretation / description:
✍🏻L#1: If the candle crossed & stays above the “Buy Gen”, it is treated / considered as
NIFTY: 24,200 Is the Battlefield. 24,250 Decides the Next Move.NIFTY: 24,200 Is the Battlefield. 24,250 Decides the Next Move.
I'm entering today's session with one level in mind—24,200.
On the daily chart, NIFTY is trading comfortably above the 20 SMA (24,106), 50 SMA (23,830) and 100 SMA (23,925), which keeps the broader trend constructive. However, the ind
See all popular ideas
Frequently asked questions
An index is a financial instrument that measures the performance of underlying assets or tracks other financial data. Some indices are designed to provide a broad view of the market, while others focus on tracking a particular sector of the economy. Indices give traders an instant snapshot of market sentiment with a rising index suggesting optimism about the economy and a declining index signaling uncertainty.
For example, the S&P 500 Index (SPX) tracks the performance of 500 large publicly traded companies in the United States, while the US consumer price index (CPI) measures US inflation and deflation.
Usually, indices are expressed in points, but some, like the S&P 500, can be expressed in the national currency.
With TradingView, you can follow all indices in one place.
For example, the S&P 500 Index (SPX) tracks the performance of 500 large publicly traded companies in the United States, while the US consumer price index (CPI) measures US inflation and deflation.
Usually, indices are expressed in points, but some, like the S&P 500, can be expressed in the national currency.
With TradingView, you can follow all indices in one place.
Indices are used to track assets or financial data, so they're not designed for trading, but some financial instruments linked to indices can be traded on exchanges. They include mutual funds, exchange-traded funds (ETFs), index futures, contracts for difference (CFDs), and options on indices.
We recommend conducting a thorough analysis before settling with any of these instruments: explore indices ideas and forecasts and then select a reliable brokerage on TradingView. Once you open an account, you'll be all set to start investing in indices.
The main global indices that investors and traders track include the S&P 500, FTSE 100, Dow Jones, and more.
For your convenience, we have a list of all major indices in one place — analyze their stats to conduct a well-rounded analysis.
Stock market indices are mainly used to gauge the health of a particular sector of the world economy. For example, as one of the main global indices, the S&P 500 (SPX) provides investors and traders with insight into the health of the US economy. Another reputable index, the DAX Index, helps assess the performance of German blue-chip companies. It is one of the primary indicators of Germany's economic health in particular and, more broadly, the EU's economic health.
Today, CAC 40 is 8,363.14 . It has decreased by 1.30% over the past month. DAX is 25,011.35 (0.26% down since last month) while FTSE 100 is 10,585.91 GBP (1.78% up since last month).
For the broader outlook, we have a list with indices of the European countries.
As of today, the S&P 500 stands at 7,509.20 , showing a 0.29% increase over the past month. Dow Jones is currently at 52,224.64 , reflecting a 1.27% increase during the same period. Meanwhile, Nasdaq 100 has reached 29,155.18 , marking a 3.66% decrease compared to the previous month.
For the broader outlook, we have a list with all indices in one place.
The Standard and Poor's 500 (SPX) is one of the most reputable indices, tracking the performance of 500 largest publicly traded US-based companies. It represents approximately 80% of the total US equity market capitalization, making it the prime indicator of the US economy's health.
Today, the SPX is 7,509.20 , it has increased by 0.29% over the past month.
On TradingView, you can track SPX components and watch the SPX chart to stay on top on index dynamics.
Today, the SPX is 7,509.20 , it has increased by 0.29% over the past month.
On TradingView, you can track SPX components and watch the SPX chart to stay on top on index dynamics.
The Dow Jones, or just the Dow, is short for the Dow Jones Industrial Average Index (DJI). It is one of the most reputable indices, tracking the performance of 30 blue-chip US stocks. All of them are stable and trusted companies boasting a long history of weathering the market under different circumstances, from gains during bull runs to surviving global economic crises.
Today, the DJI is 52,224.64 , it has increased by 1.27% over the past month.
On TradingView, you can track DJI components and watch the DJI chart to stay on top of index dynamics.
Today, the DJI is 52,224.64 , it has increased by 1.27% over the past month.
On TradingView, you can track DJI components and watch the DJI chart to stay on top of index dynamics.
An index fund is a financial instrument that tracks the performance of a financial index. Since indices cannot be bought as they are, index funds can have different structures that provide investors with exposure to the identical price fluctuations of a given set of stocks.
For example, an index fund can hold the exact stocks in a proportion similar to the index's initial weight, given to each stock. Therefore, as the index changes, a well-structured index fund would change by the same value.
To gain insight into market indices, explore our community ideas on indices.
For example, an index fund can hold the exact stocks in a proportion similar to the index's initial weight, given to each stock. Therefore, as the index changes, a well-structured index fund would change by the same value.
To gain insight into market indices, explore our community ideas on indices.