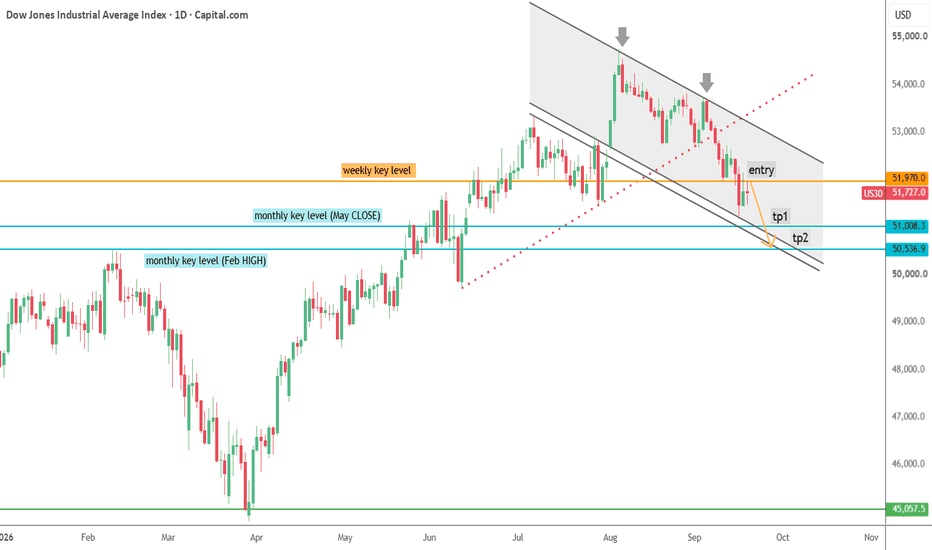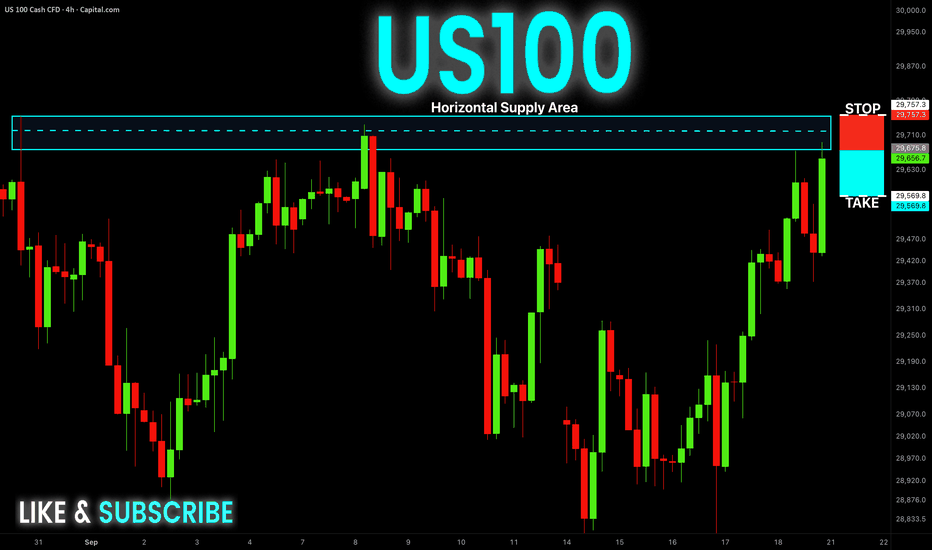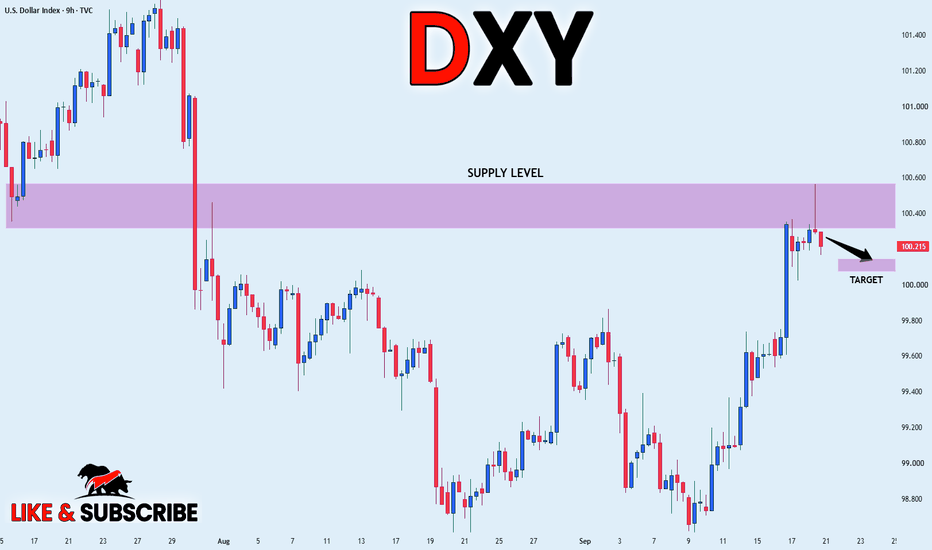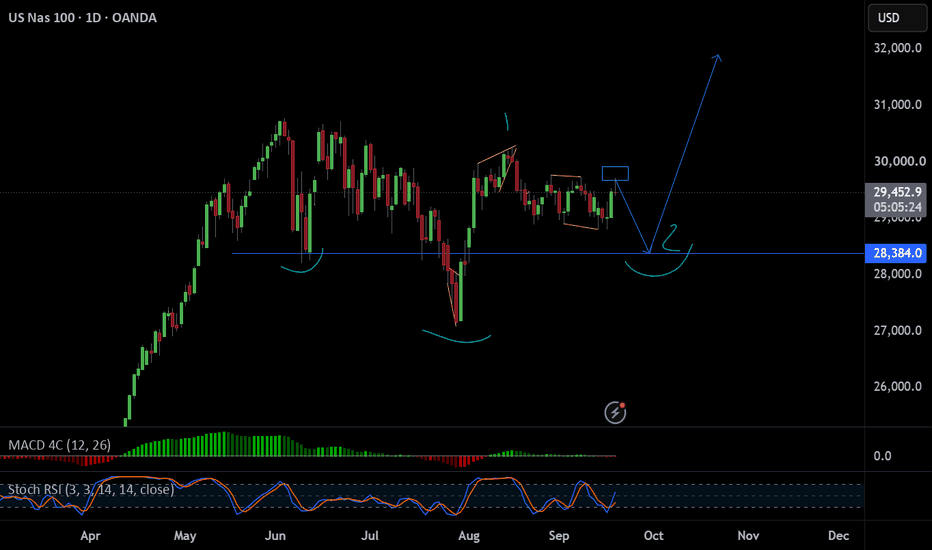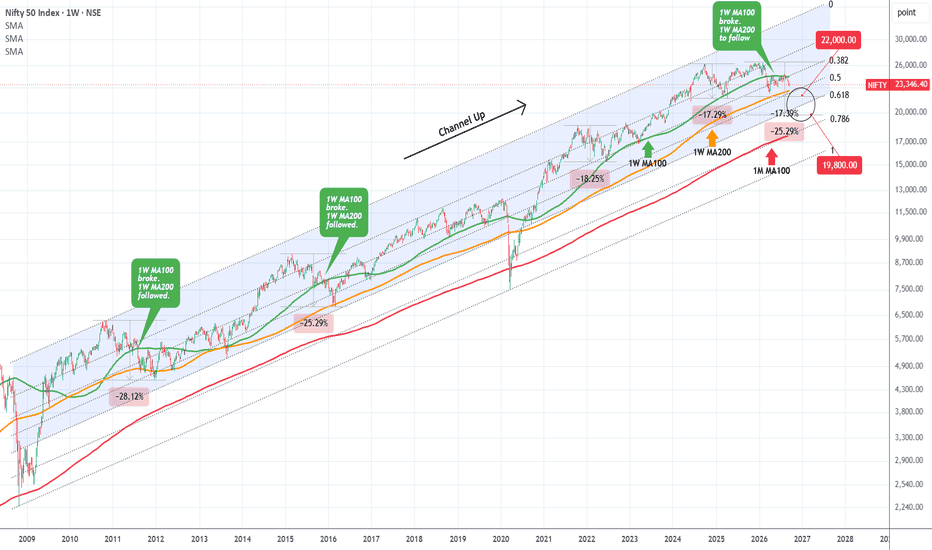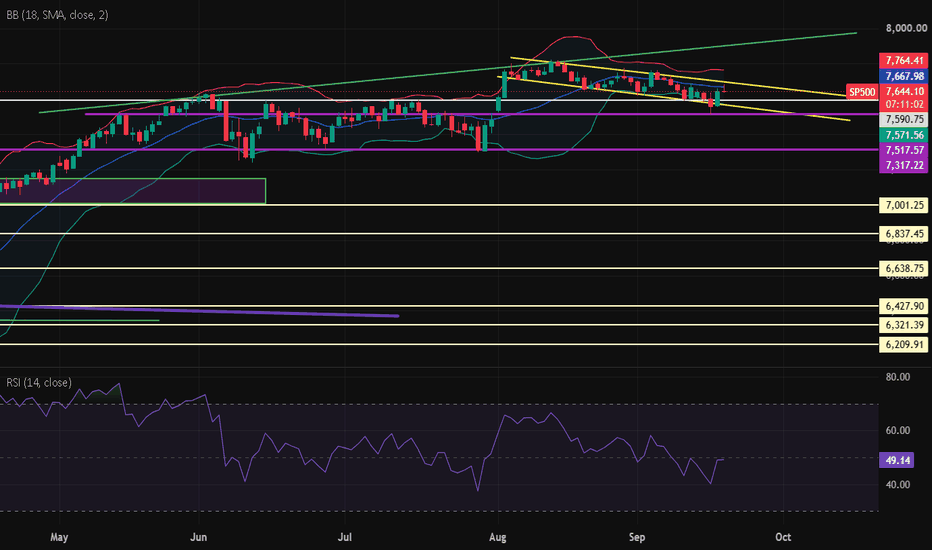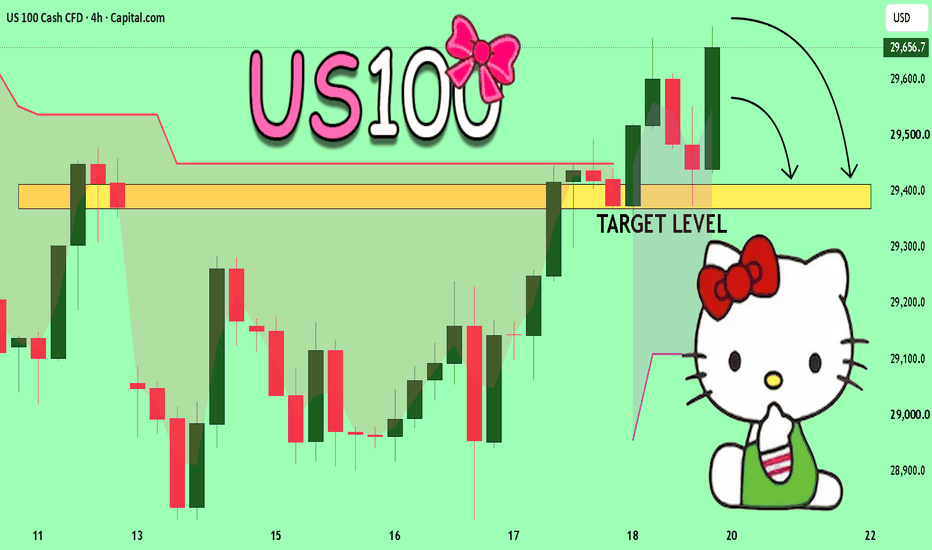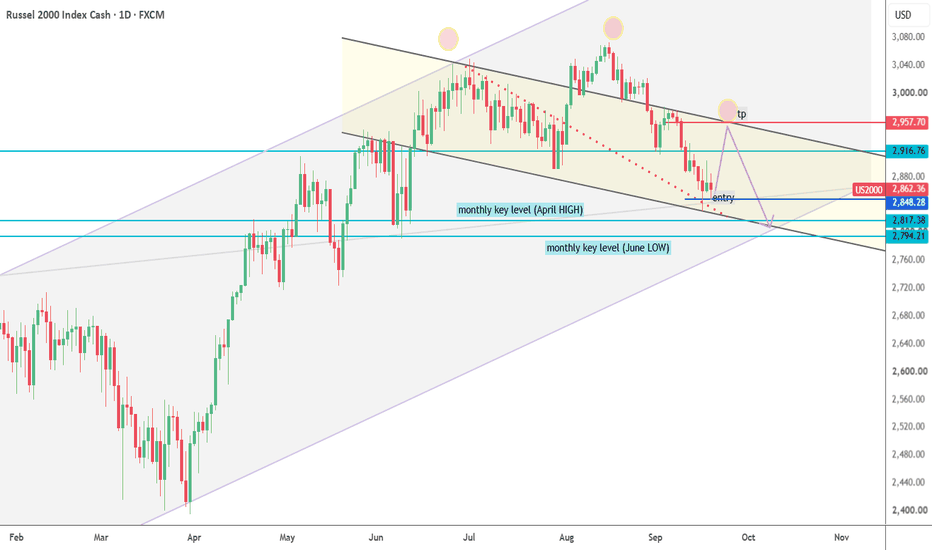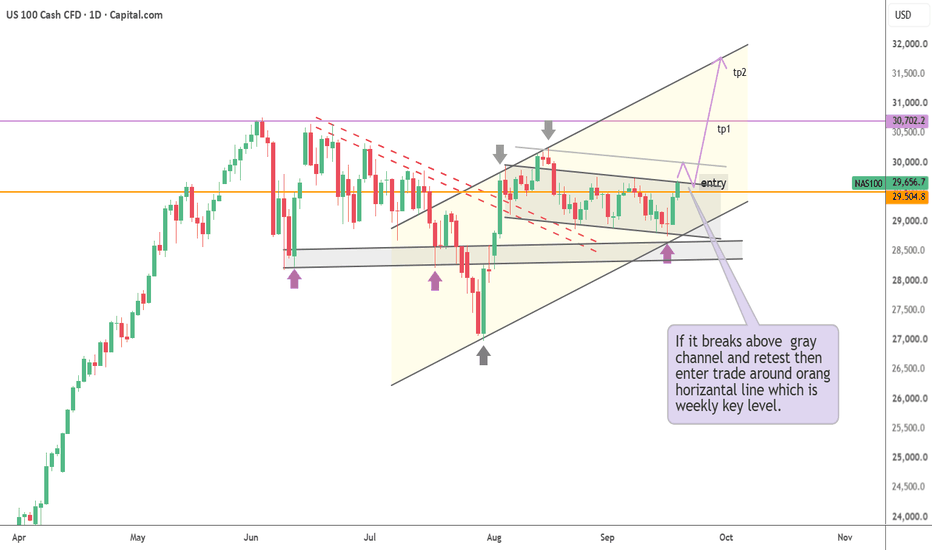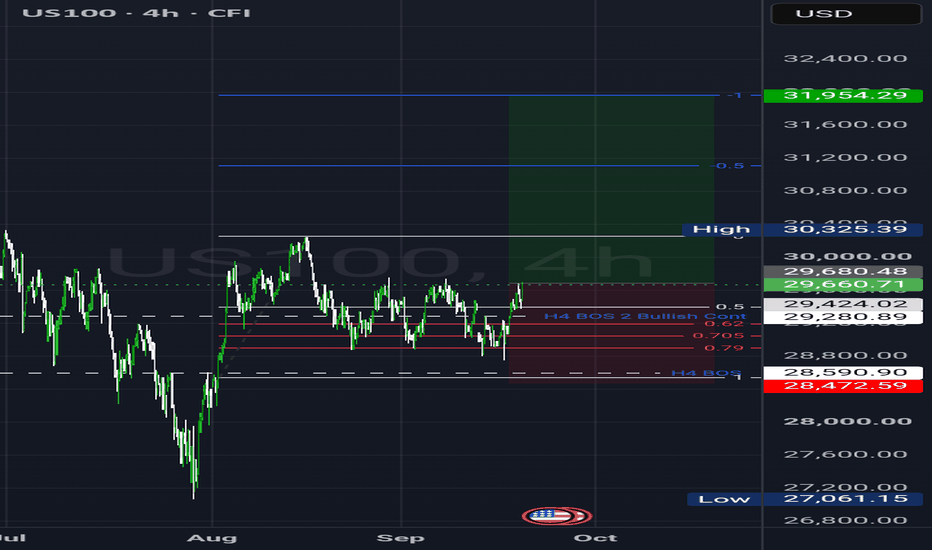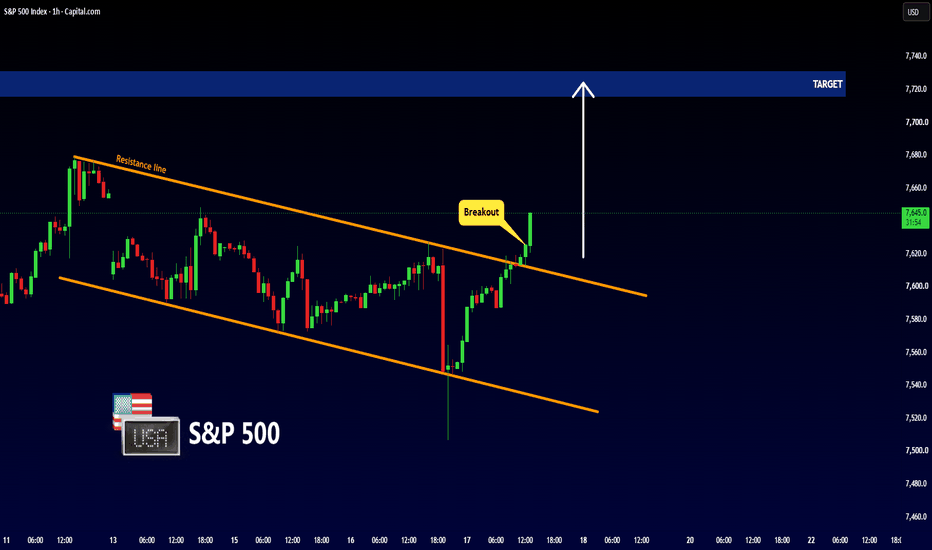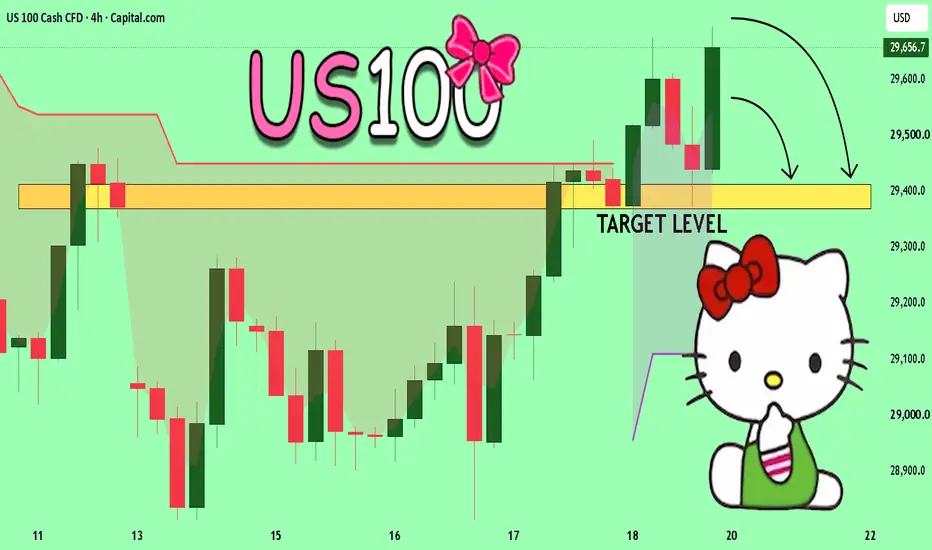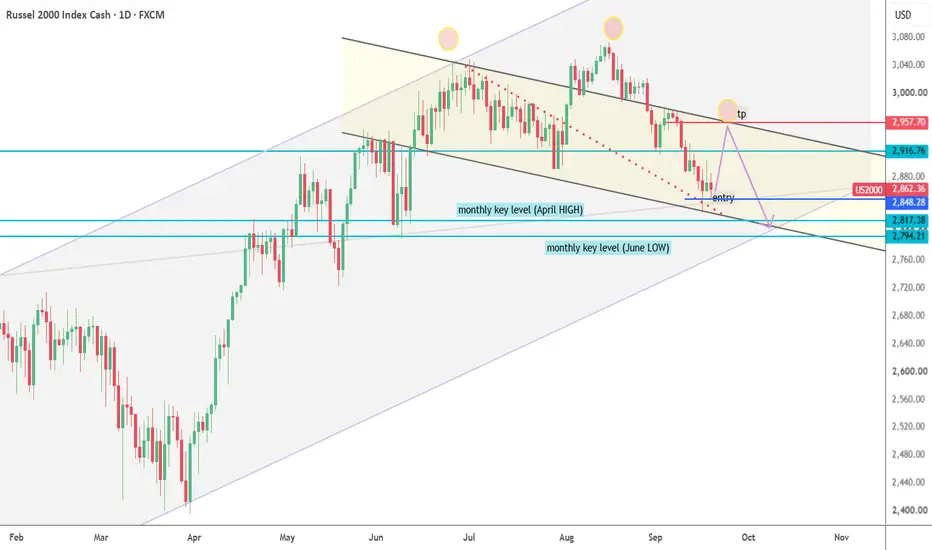
*US TECH 100 BULLISH REVERSAL FROM KEY SUPPORT — TARGET 29,296**
US Tech 100 has formed a strong bullish rebound after testing the **28,400 major support zone**. The price has recovered from the recent sell-off and is now showing increasing buying momentum. A sustained move above the **29,000 psychological level** could open the way toward the marked **29,296 target**.
🎯 **TARGET: 29,296**
🟢 **SUPPORT: 28,400**
📈 **BIAS: BULLISH**
Market indices
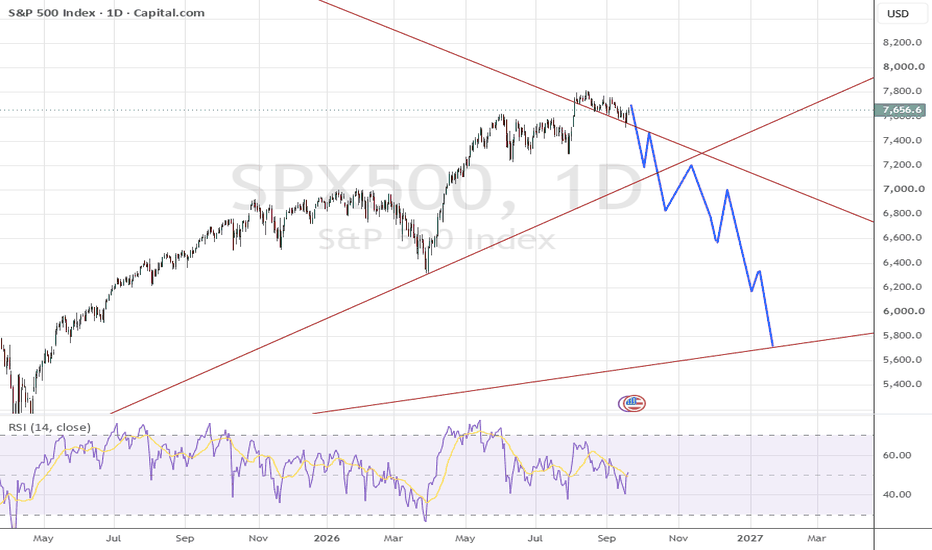
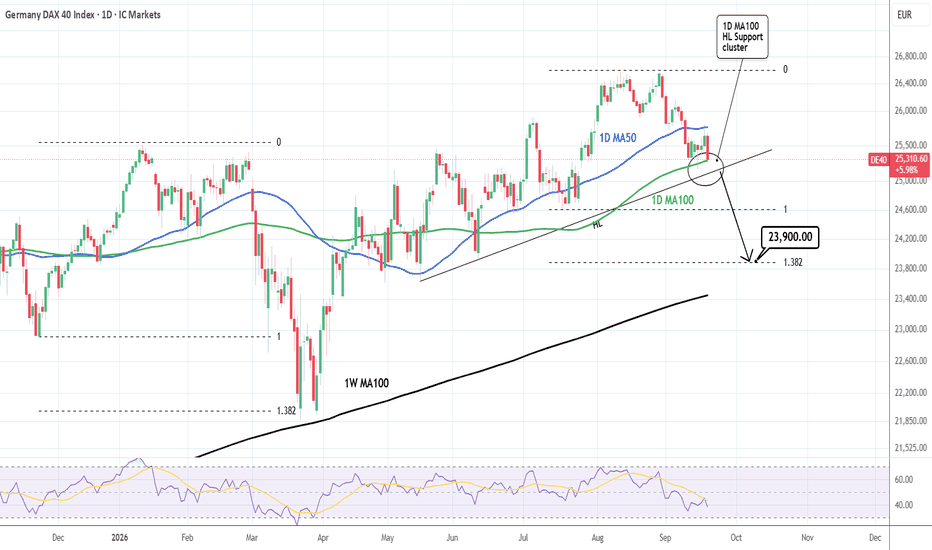
S&P500 Is it about to correct to 7000 minimum?The S&P500 index (SPX) has turned into a sideways consolidation for almost 2 months, putting a stop to the relentless 9 straight green weeks rally that preceded it. At the same time, the 1W RSI has been falling under Lower Highs pressure.
Every time we saw this RSI pattern since late 2021, the index always corrected. The first two times (2022 and 2025), it corrected to the 0.5 Fibonacci retracement level and the 1W MA200 (orange trend-line). The most recent (March 2026) it 'only' breached the 1W MA50 (blue trend-line).
If repeated, S&P500 could break again its 1W MA50 and hit the 0.5 Fib level from the March Low at 7000. Based on that pattern that is the minimum long-term Target. If however we ignore the Jan - March 2026 correction and we are in a wider pattern since the April 2025 Low, the 0.5 Fib would be located at 6250, which would again make the index approach its 1W MA200. Basically that lower target (6250) would be justified only if we get trend continuation confirmation by closing a weekly candle below the 1W MA100 (green trend-line).
In any case, if the 1W RSI enters its 4-year Buy Zone regardless of the price S&P500 will be at that time, it would be at the best interest for long-term investors to start buying again.
---
** Please LIKE 👍, FOLLOW ✅, SHARE 🙌 and COMMENT ✍ if you enjoy this idea! Also share your ideas and charts in the comments section below! This is best way to keep it relevant, support us, keep the content here free and allow the idea to reach as many people as possible. **
---
💸💸💸💸💸💸
👇 👇 👇 👇 👇 👇
S&P500 INDEX (US/500): Your Trading Plan ExplainedThe ⚠️S&P500 index is currently testing a horizontal structure that was recently breached. It is highly probable that this level has now become support.
For a confirmed buying opportunity, please observe the formation of a double bottom pattern on the 4-hour chart.
Should the price break and close above 7521, this would provide strong bullish confirmation.
In such a scenario, the market is anticipated to advance to at least the 7584 level.
Conversely, if the price declines and establishes a new lower low, this trading setup would no longer be valid.
JPN225 The Break That Sends It to 69,015 or 63,825▪️ JPN225 H1 SNAPSHOT — EXECUTIVE SUMMARY
▪️ the Nikkei 225 is currently trading near 66,088, holding just above a well-defended support shelf after failing to reclaim overhead supply. Market structure is consolidating, with price pinned between a defended floor below and resistance above.
▪️ Primary outlook is neutral-to-constructive — the reaction at 65,605 is the key tell. While that shelf holds, buyers can attempt another push higher; losing it exposes the deeper demand stack below.
▪️ Key resistance zone: 67,795, where sellers have defended 13 times and are expected to lean again on first test. Beyond it, 69,015 is the next hurdle.
▪️ Major defense line: 65,605 — a strong level at 15 retests. Holding here keeps the bullish attempt alive; a decisive break below opens the door for a corrective slide.
▪️ Primary downside targets: 63,825, where liquidity and demand are stacked.
▪️ Major liquidity magnet below: 65,605–63,825 — this zone could trigger a strong bounce or reversal once tested.
▪️ Bullish scenario: If buyers reclaim and hold above 67,795, the path opens toward 69,015 as the primary upside objective.
▪️ KEY LEVELS
▪️ Current Price: 66,088
RESISTANCEs
▪️ 69,015 — ★★★★ 8.2 Very Strong · 22 retests
▪️ 67,795 — ★★ 6.0 Moderate · 13 retests
SUPPORTs
▪️ 65,605 — ★★★ 7.1 Strong · 15 retests
▪️ 63,825 — ★ 5.0 Weak · 13 retests
▪️ ProjectSyndicate Levels Desk — Overview of key S/R zones for JPN225, NVDA, NQ, ES & GC traders every week. Subscribe to stay up to date with the latest levels.
NAS100 — Daily FVG Short Into Monthly DrawStill trading inside a bearish structure — lower highs holding since the June peak.
The daily FVG at 29,061–29,235 is the entry POI. Price retraces into unfilled inefficiency, sellers step back in.
Target is the monthly low at 28,202. That level isn't just external range liquidity — there's a monthly FVG sitting there too. Daily and monthly line up on the same draw.
Invalidation: 29,634.
Do you wait for the FVG fill, or take the entry earlier?
Not financial advice.
21.07.26 Daily ForecastGood day everyone!!
No video forecast today due to being out of the door early to work, hopefully this should be the last day before fully resuming video forecasts as normal.
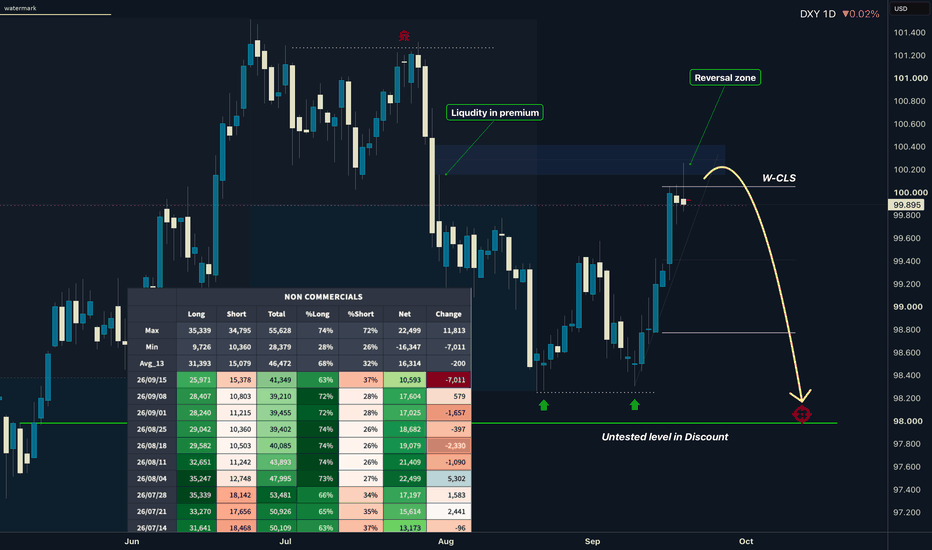
As you can see from previous forecasts with the DXY, we did get that move to the upside as expected. Now it is a question of whether price needs a deeper pullback or this is the new base for the next move to the upside.
Today I am looking at :
FX:EURAUD - After the sell we got yesterday, we could now be seeing a 1H structure develop underneath the low for a 15M risk entry short, to complete the move into the next main low.
FX:USDCAD : I am open to the long and short on this pair as it is conflicting a little with the DXY. Either a 1H tight flag filtered to the 15M for a risk entry or reduce risk for the longs. Or price drops back through from the V shape and provides an insurance entry short.
FX:NZDUSD : Price is currently sat at a value area for sells and also completing a reversal structure into that high, so we could see a turnaround from here for the sells. However, if the DXY needs the deeper pullback then this pair may move higher into the ray line above before we see any sell moves occur.
DXY Bullish Recovery from Support – Eyes on 101.02 Resistance
The **U.S. Dollar Index (DXY)** is showing signs of a potential bullish recovery after finding strong support around the **100.45–100.50** demand zone. Price recently bounced from this key support area and is attempting to stabilize above the **100.70** level.
Although the broader trend has been bearish, the current structure suggests buyers are defending the support zone. The Ichimoku Cloud indicates that momentum is still mixed, but a sustained move above the cloud and nearby resistance could confirm a bullish continuation.
The projected path on the chart suggests a minor pullback toward the support region before buyers regain control and push the index higher. A successful hold above support may open the door for a rally toward the next resistance level.
### **Target:**
* **Primary Target:** **101.02**
* **Support Zone:** **100.45–100.50**
* **Confirmation Level:** **100.80–100.90**
* **Major Resistance:** **101.75–101.80**
**Trading Idea:**
As long as DXY remains above the **100.45 support**, the bullish recovery scenario remains valid. A confirmed breakout above **100.90** would increase the probability of price reaching the **101.02** target, while a break below support would invalidate the bullish outlook.
FTSE 100 Bearish Setup
Price has rejected from the upper boundary of the 4H range/resistance zone.
The rejection also coincides with a potential rising wedge / Head & Shoulders breaking to the downside.
Stochastic has a bearish cross following the rejection, suggesting momentum may be shifting lower.
OBV is also beginning to break lower, indicating weakening buying pressure and supporting the bearish move.
Broader geopolitical uncertainty and risk-off sentiment could provide additional downside pressure for UK equities.
Initial downside target sits around the lower 4H support zone near 10,180–10,200.
Invalidation would come from a strong move back above the recent highs / upper resistance zone around 10,700–10,735.
UK inflation data is due this week, which could create volatility across the FTSE and GBP. It may be worth waiting for the data release before entering, or for clearer post-data confirmation of the bearish move.
SPX500 H4: Uptrend Holds Above Key SupportMarket Outlook:
SPX500 continues to maintain its bullish H4 structure, with price holding above the ascending trendline and consistently forming higher lows. The 7,460 area is acting as the nearest support, while 7,560 remains the key resistance level that must be cleared for the uptrend to extend.
Trading Bias:
The preferred scenario is to look for Buy opportunities if SPX500 continues to hold above 7,460 and prints a clear bullish confirmation signal. If confirmed, the index could move higher to retest 7,560, with the next upside target around 7,650.
Invalidation:
The bullish outlook will be invalidated if price breaks below the ascending trendline and an H4 candle closes decisively beneath the 7,440–7,460 support zone.
[JP225] Post-BOS Pullback: Observing the EMA Resistance levelsCurrent Status:
Price is currently in a retracement phase following the confirmed Bearish BOS. We are testing the EMA 20 (Yellow circle). If the momentum continues, the next resistance to watch is the EMA 50 (Green circle).
Since the price is trading below the EMA 200, my macro bias remains strictly bearish as long as this level is not breached.
Strategy:
The goal here is not to "predict" the top of the pullback, but to observe how the price reacts at these key levels. I am initiating a Probe Short to test the downward momentum.
Action Plan:
I will monitor for rejection at the EMA 20 or EMA 50. If the price remains suppressed below the EMA 200, the structural integrity of the downtrend remains intact. Discipline is about following the process, not chasing the price.
#JP225 #Nikkei225 #TechnicalAnalysis #PropFirm #AestheticsOfSubtraction
NASDAQ-100 Bulls Are Back! AI Stocks Fuel the Next Rally🚨💰 US100 / NDX "NASDAQ100" INDEX — THE VAULT HEIST SETUP: BULLISH PULLBACK PLAY TOWARD 31,000 🔓📈
━━━━━━━━━━━━━━━━━━━━━━
🎯 THE HEIST PLAN — Day/Swing Trade
Bullish continuation setup building off a moving average pullback confirmation. Price action retesting dynamic support before the next leg toward the vault.
🔑 ENTRY (Vault Zone): Flexible — you can enter at any price level that fits your own risk plan. No fixed entry dictated here, use your own confirmation (MA bounce, candle close, order block reaction — whatever fits your playbook).
🚔 TARGETS (Getaway Points):
Heads up — the police barricade zone sits just above current price acting as strong resistance, and there's overbought + trap + reversal risk stacking up there. Escape with profits before the sirens catch up 🚨
Scalper/Day Trader — Target 1 🥇 @ 29,500
Day Trader — Target 2 🥈 @ 30,500
Swing / Main Getaway Target 🏆 @ 31,000
⚠️ Dear Ladies & Gentlemen — Thief OG's — I'm not recommending you set only my TP. It's your own choice, you make the money then you take the money, at your own risk 💸
🚨 THIEF SL (Stop Loss): @ 28,000
⚠️ Same goes here, Thief OG's — I'm not recommending you set only my SL. Your capital, your call, manage it at your own risk 🛡️
━━━━━━━━━━━━━━━━━━━━━━
🔗 CORRELATED PAIRS TO WATCH (getaway crew — know your accomplices)
💵 TVC:DXY (US Dollar Index) — trading around 101.06, broadly flat/firm. NDX and DXY typically move inverse — a stronger dollar is a headwind for tech-heavy risk assets, so watch DXY strength for confirmation of any NDX weakness.
🥇 OANDA:XAUUSD (Gold) — around $4,059/oz, holding a bid near 9-month lows amid Middle East tension. Gold and NDX aren't tightly correlated day-to-day, but a spike in gold usually signals a broader risk-off shift that can drag tech down with it.
😨 TVC:VIX (Volatility Index) — around 17.50, cooling off from last week's spike above 18.7. VIX and NDX are strongly inverse — falling VIX supports the bullish tech thesis; a VIX re-spike is your early warning the vault door is closing.
🛢️ BLACKBULL:WTI Crude Oil — around $84.61/bbl, up sharply on US-Iran tensions and Strait of Hormuz risk. Rising oil = rising inflation risk = hawkish Fed repricing, which is a headwind for growth-heavy NDX.
₿ BTC/USD (Bitcoin) — around $66,816, up on the session. Bitcoin has traded as a high-beta risk proxy alongside NDX in recent cycles — watch for confirmation/divergence.
📈 US500/SPX (S&P 500) — around 7,492, +0.66%. Broader risk barometer — NDX rarely runs far without SPX participation.
━━━━━━━━━━━━━━━━━━━━━━
📰 FUNDAMENTAL & ECONOMIC FACTORS ON THE RADAR (neutral — what the market is actually showing)
🏦 Fed Chair Kevin Warsh delivered his first congressional testimony on 14 July; markets are now pricing roughly a 55% chance of a Fed rate hike in September, up from 51% the prior session. The Fed enters its blackout period ahead of next week's FOMC meeting, where policymakers are widely expected to hold rates steady.
📉 June CPI ran at 3.5% YoY; core PCE climbed to 3.4% in May per Fed Governor Waller's recent remarks. June PPI fell -0.3% MoM, driven by a sharp drop in energy costs. Unemployment sits at 4.2% (June reading).
⚔️ US-Iran tensions remain elevated — reports of a possible 10-day ceasefire are circulating, but Brent crude has pushed above $90/bbl on Strait of Hormuz risk. This geopolitical overhang is feeding directly into inflation expectations and rate-path uncertainty.
🏢 Big Tech earnings week is live — GM reported 21 July; Alphabet and Tesla report after the close on 22 July, Intel follows 23 July. Markets are laser-focused on AI capex payoff — Alphabet's Google Cloud backlog ($462B) and margin commentary could be a major NDX catalyst either direction. Chip stocks dragged the Nasdaq down ~2.9% last week on AI-spend scrutiny; semiconductor sales are still running +79% YoY in Q1 2026 with BNP forecasting +132% in Q2.
🗓️ Next CPI print is due 12 August 2026 — mark your calendar, that's the next big volatility trigger for NDX.
━━━━━━━━━━━━━━━━━━━━━━
🦹 THIEF TRADER'S WISHES & MOTIVATION
"A real thief doesn't chase the vault — the vault comes to a patient thief." 🕰️💰
"Enter like a ghost, exit like a legend — profits secured, no trace left behind." 👻🔓
"The market pays those who wait for the pullback, not those who chase the breakout." 📉➡️📈
Stay sharp, Thief OG's — protect your capital first, profits second. This crew runs on discipline, not luck 🙌🔥
━━━━━━━━━━━━━━━━━━━━━━
⚠️ RISK DISCLAIMER: This is not financial advice. Trading CFDs, indices, and leveraged products carries substantial risk of loss. Always use proper risk management and only trade capital you can afford to lose.
TEAM UPDATE — DAX LONG SETUPTeam, yesterday we handled DAX beautifully — clean execution, clean profits.
Today we stay sharp and focused because the levels are tight and the reaction zone is clear.
ENTRY ZONE:
24742 – 24715
STOP LOSS: 24560
Target 1: 24765 – 24783
Target 2: 24705 – 24865
MARKET NOTES
Price is pulling back into our premium buy zone.
Same structure as always: partials at T1, protect capital, let the rest run.
LETS GO
NASDAQ Uncanny symmetry with Q1 points to 26800.Nasdaq (NDX) has made three straight 1D candle closings below its 1D MA50 (blue trend-line), confirming that it is on a strong technical medium-term correction course.
The structural base of the pattern since May, resembles that of the beginning of 2026. Megaphone pattern after an initial drop of -8.00% giving way to the Lower Highs correction that eventually completed a -13.14% total decline on the 1.618 Fibonacci extension.
If the current sequence continues to repeat that of Q1 (January - March), then expect the index to target 26800, which won't just be a -13.14% correction on the 1.618 Fib ext, but will also test the 1D MA200 (orange trend-line) for the first time since April 08.
Notice also how similar the 1D RSI sequences are among the two fractals.
---
** Please LIKE 👍, FOLLOW ✅, SHARE 🙌 and COMMENT ✍ if you enjoy this idea! Also share your ideas and charts in the comments section below! This is best way to keep it relevant, support us, keep the content here free and allow the idea to reach as many people as possible. **
---
💸💸💸💸💸💸
👇 👇 👇 👇 👇 👇
Semiconductors (SOX): This Is the Signal You Need to Watch!Far more than geopolitics or the situation in the Middle East, the long-term trend in the semiconductor sector is currently the number one fundamental concern for major financial institutions.
Semiconductors are the segment of the technology sector generating the highest profits and, above all, the strongest expected earnings. AI GPUs, AI memory chips, data centers, and other computing chips have driven this sector to a near-vertical stock market rally since the spring of 2025.
Given its mathematical weight in the calculation of the S&P 500 index, this market segment will ultimately determine when the S&P 500 reaches its cyclical peak.
It is not worthwhile to predict the end of the long-term bull trend every single week because, after each short-term correction, the underlying uptrend has consistently resumed. Claiming every week that the market has reached its top is therefore a losing strategy.
Instead, investors should adopt a more precise and methodical approach by waiting for genuine, tangible signals that the long-term trend of the U.S. stock market has turned bearish. Until such signals appear, every short-term correction should be viewed as a buying opportunity.
Here is the key takeaway: in technical analysis, the strongest and most reliable signals come from long-term charts, namely the monthly timeframe. Only a technical signal from this long-term horizon can truly invalidate a major bullish trend.
In this new analysis published on TradingView, I invite you to closely monitor the RSI indicator on the monthly SOX chart. For more than 30 years, whenever the RSI has fallen back below the overbought zone (70), whether preceded by a bearish divergence or not, it has signaled a significant pullback in the SOX.
Take a close look at the chart below. For now, this bearish signal has not yet been triggered. But the day it is confirmed, expect a substantial correction in semiconductor stocks—and therefore in the S&P 500 as well.
The chart below shows the monthly Japanese candlesticks of the U.S. Semiconductor Index (SOX).
DISCLAIMER:
This content is intended for individuals who are familiar with financial markets and instruments and is for information purposes only. The presented idea (including market commentary, market data and observations) is not a work product of any research department of Swissquote or its affiliates. This material is intended to highlight market action and does not constitute investment, legal or tax advice. If you are a retail investor or lack experience in trading complex financial products, it is advisable to seek professional advice from licensed advisor before making any financial decisions.
This content is not intended to manipulate the market or encourage any specific financial behavior.
Swissquote makes no representation or warranty as to the quality, completeness, accuracy, comprehensiveness or non-infringement of such content. The views expressed are those of the consultant and are provided for educational purposes only. Any information provided relating to a product or market should not be construed as recommending an investment strategy or transaction. Past performance is not a guarantee of future results.
Swissquote and its employees and representatives shall in no event be held liable for any damages or losses arising directly or indirectly from decisions made on the basis of this content.
The use of any third-party brands or trademarks is for information only and does not imply endorsement by Swissquote, or that the trademark owner has authorised Swissquote to promote its products or services.
Swissquote is the marketing brand for the activities of Swissquote Bank Ltd (Switzerland) regulated by FINMA, Swissquote Capital Markets Limited regulated by CySEC (Cyprus), Swissquote Bank Europe SA (Luxembourg) regulated by the CSSF, Swissquote Ltd (UK) regulated by the FCA, Swissquote Financial Services (Malta) Ltd regulated by the Malta Financial Services Authority, Swissquote MEA Ltd. (UAE) regulated by the Dubai Financial Services Authority, Swissquote Pte Ltd (Singapore) regulated by the Monetary Authority of Singapore, Swissquote Asia Limited (Hong Kong) licensed by the Hong Kong Securities and Futures Commission (SFC) and Swissquote South Africa (Pty) Ltd supervised by the FSCA.
Products and services of Swissquote are only intended for those permitted to receive them under local law.
All investments carry a degree of risk. The risk of loss in trading or holding financial instruments can be substantial. The value of financial instruments, including but not limited to stocks, bonds, cryptocurrencies, and other assets, can fluctuate both upwards and downwards. There is a significant risk of financial loss when buying, selling, holding, staking, or investing in these instruments. SQBE makes no recommendations regarding any specific investment, transaction, or the use of any particular investment strategy.
CFDs are complex instruments and come with a high risk of losing money rapidly due to leverage. The vast majority of retail client accounts suffer capital losses when trading in CFDs. You should consider whether you understand how CFDs work and whether you can afford to take the high risk of losing your money.
Digital Assets are unregulated in most countries and consumer protection rules may not apply. As highly volatile speculative investments, Digital Assets are not suitable for investors without a high-risk tolerance. Make sure you understand each Digital Asset before you trade.
Cryptocurrencies are not considered legal tender in some jurisdictions and are subject to regulatory uncertainties.
The use of Internet-based systems can involve high risks, including, but not limited to, fraud, cyber-attacks, network and communication failures, as well as identity theft and phishing attacks related to crypto-assets.
USNAS100 | Decision Zone Before Big Tech EarningsUSNAS100 | Decision Zone Before Big Tech Earnings
Markets are entering one of the most volatile weeks of the quarter, with earnings from major technology companies including Google and several other AI leaders expected to drive sentiment. Their results could determine whether the Nasdaq resumes its recovery or extends its recent decline.
Technically
The Nasdaq is currently trading inside a critical decision zone that could determine the next 5% directional move.
As long as price holds above 28900, buyers remain active and the index is likely to target 29210, followed by 29590, with the next resistance around 29980.
However, if the market stabilizes below 28750, bearish pressure is expected to increase toward 28400.
A confirmed break below 28400 would signal the start of a new bearish leg toward 27530, with the broader downside target around 26720.
Pivot Zone: 28750 – 28900
Resistance: 29210 – 29590 – 29980
Support: 28400 – 27530 – 26720
NDX Alert: Wall Street Warns of AI OverheatingRecently, you may have noticed an intriguing paradox in the tech sector: corporate earnings remain stellar, and capital expenditure plans are still being ramped up, yet stock prices are struggling to push higher. This is exactly when we, as traders, need to be on high alert—the market is actively "re-pricing" the AI boom. By combining the latest insights from Nomura with stark warnings from legendary short-seller Jim Chanos, let's break down the hidden risks in the AI market and how CFD traders can capture the impending volatility.
Macro Previews: Nomura’s "4 Scenarios" & The Chanos Warning
Why is there a growing disconnect between tech fundamentals and price action? The market is heavily clouded by uncertainty regarding the true payoff of massive AI investments. Currently, semiconductors and the "Magnificent Seven" are stumbling, while defensive sectors hold their ground.
Nomura’s "4th Fatal Scenario":
The market initially focused on three pivot scenarios for the AI cycle: Big Tech burning too much cash and being forced to pull back, high memory prices dragging down investment, and raw materials driving up inflation to keep central banks hawkish. However, Nomura recently highlighted a fourth, potentially fatal scenario: Surging memory prices stimulating a frantic capacity expansion in the semiconductor industry, ultimately leading to massive overcapacity and a price collapse. With these four scenarios wrestling for dominance, capital is hesitant. Interestingly, the bond market isn't seeing a rush of bets on rate cuts; instead, rate hike expectations are simmering. This tension is the ultimate precursor to a massive volatility spike.
The Chanos Warning: Worse than the Dot-Com Bubble?
While Nomura highlights market-level concerns, Jim Chanos points to a structural ticking time bomb. He warns that the current AI infrastructure investment craze is a classic "price-to-dream ratio" game, potentially eclipsing the late-1990s dot-com bubble. He highlights three lethal issues:
Duration Mismatch & Accounting Illusions: Companies are using short-term spot prices to justify 20-year capital plans. Massive amounts of unused equipment are booked as "construction in progress" without depreciation, masking true devaluation pressures.
Plummeting ROIC: The return on incremental invested capital for cloud giants has already dropped from 40% to 20%. If reckless cash burning continues, by late 2026, investing in treasuries might literally be more profitable.
The Interest Rate Detonator: With razor-thin spreads and high leverage, if interest rates inch back toward 5% or higher, various asset classes could face a domino-style collapse.
Deep Technical Analysis: Daily (1D) Bearish Breakdown & GMMA Crossover
Looking at the Daily chart for the Nasdaq 100 (NDX), the era of "blindly going long" on tech is clearly fading. Price action has fundamentally shifted, and we are witnessing a significant structural breakdown:
GMMA Trend Reversal Confirmation:
The Guppy Multiple Moving Average (GMMA) indicator is flashing a major warning sign. The short-term moving average group (yellow) has aggressively crossed down through the long-term moving average group (blue). Furthermore, the long-term blue MAs are beginning to flatten and turn downwards. This indicates that the broader macro uptrend has lost its momentum, and sellers are seizing control of the narrative.
Key Support / Resistance Zones:
Based on the chart structure, price recently broke below a critical consolidation phase.
Immediate Resistance (Red Dotted Line & MAs): Price is currently attempting a weak retest of the breakdown level around 28,604. The cluster of descending MAs sits directly above this, acting as a heavy dynamic ceiling.
Macro Resistance: The upper boundary of the previous distribution range sits near 29,629.
Critical Support: The immediate floor and our primary downside target rests at the major horizontal support near 28,196.
Trading Strategy: Navigating the AI Re-pricing Volatility
With fundamental divergence and a clear technical breakdown, traders must shift from a buy-the-dip mentality to a more tactical, two-way approach. Volatility is where the profit lies.
Trend-Following Approach: Sell the Rallies (Shorting the Retest)
Given the bearish GMMA crossover and Chanos's macro warnings, the current bounce toward the 28,604 level offers a prime "sell the rally" opportunity. Watch for exhaustion signals on lower timeframes (1H/4H) around this resistance. A rejection here confirms the structural breakdown, allowing traders to initiate short positions targeting the 28,196 support zone.
Breakdown Scenario (Momentum Short):
If the broader tech sector succumbs to the "overcapacity" fears highlighted by Nomura, watch for a high-volume daily close below the 28,196 support line. A break below this psychological floor will trigger a cascading liquidation of long positions, opening the door for a much deeper macro correction.
Invalidation (Upside Squeeze):
In this data-heavy environment, a dovish pivot from the Fed or an unexpected blowout earnings report from a mega-cap could trigger a massive short squeeze. If the price reclaims the 28,604 level and the yellow MAs cross back above the blue MAs, the bearish thesis is temporarily invalidated, and we could see a grind back toward the 29,600 region.
Next Focus: We are entering a highly news-sensitive period for tech. Internal sector divergence will be extreme. Keep your position sizes strictly managed, avoid fighting the tape, and always use hard stop-losses!
How the 2026 AI Bubble Mirrors 2000 Dot-Com The 2000 dot-com bubble and today’s AI bubble share one key similarity: the anticipation of mass adoption.
Back then, it was the anticipation of mass adoption internet shopping. Today, it is the anticipation of widespread AI usage among individuals and businesses.
Yet, we are still debating whether or not to integrate AI in our work and day-to-day lives.
So, are we in a AI bubble?
CME Group - SINGLE STOCK FUTURES
AAPL, ABBV, ADBE, AMAT, AMD, AMGN, AMZN, AVGO, BA, BAC, BKNG, BRKB, CAT, CMCSA, COP, COST, CRM, CSCO, CVX, DIS, GOOGL, HD, IBM, INTC, JNJ, JPM, KO, LLY, LMT, MA, MCD, META, MRK, MSFT, MU, NEM, NFLX, NVDA, ORCL, PANW, PEP, PFE, PG, PLD, PLTR, QCOM, SBUX, SPCX, TSLA, TXN, UNH, V, VZ, WMT, XOM
CME Group - MICRO SINGLE STOCK FUTURES
AAPL, AMD, AMZN, AVGO, BA, BAC, CSCO, GOOGL, INTC, JPM, META, MSFT, MU, NEM, NFLX, NVDA, PFE, PLTR, SPCX, TSLA, WMT, XOM
Disclaimer:
• What presented here is not a recommendation, please consult your licensed broker.
• Our mission is to create lateral thinking skills for every investor and trader, knowing when to take a calculated risk with market uncertainty and a bolder risk when opportunity arises.
CME Real-time Market Data help identify trading set-ups in real-time and express my market views. If you have futures in your trading portfolio, you can check out on CME Group data plans available that suit your trading needs www.tradingview.com
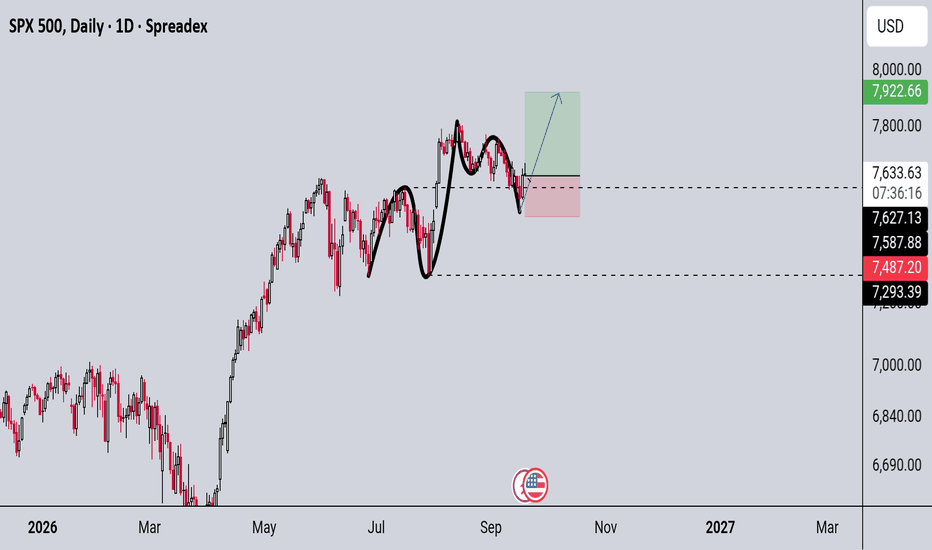
S&P500: All eyes on this Support.S&P500 has turned neutral on its 1D technical outlook (RSI = 46.915, MACD = 4.060, ADX = 17.602) as it is about to test the S1 Zone, having invalidated the 1 month Channel Up. Given the oversold 4H RSI, a bounce here is likely. Selling is valid only below the S1 Zone, in which case, expect S2 to be tested (TP = 7,300).
See how our prior idea has worked out:
## If you like our free content follow our profile to get more daily ideas. ##
## Comments and likes are greatly appreciated. ##
Range squeezeThe range trade is still in place - we tested the lows at the close, but it didn't break so we rallied and probably will test the highs of the range today. I still think we will come down hard, but today may be mostly positive. Tech (soxx and qqq) may top out today according to the spy/qqq ratio charts.