Is Market Complacency About to Shatter? Watching the VIX SqueezeMarket complacency is reaching a critical tipping point. While major equity indexes push into tight ranges, the Volatility S&P 500 Index (VIX) has spent weeks grinding sideways, winding up a massive spring. The Auto Pattern Detector has locked in a textbook structure right at the local base of a multi-month corrective downtrend, signaling that a major volatility expansion is imminent.
📊 Technical Breakdown
The Squeeze: After months of structural decline bounded by the overhead descending resistance arc, price action has compressed into a razor-thin pocket. The VIX has spent 22 bars grinding sideways at the absolute apex of this formation, meaning the market is completely starved for room to move.
Pattern Bias: Despite immediate downward intraday pressure, the algorithm has flagged a clear Bullish Pennant structure, maintaining a strong "Bull" Active Pattern Bias (100% Pivot Depth). The structural geometry is heavily weighted toward an explosive upside resolution.
Volatility Component: The daily Average True Range (ATR 14) has shrunk dramatically to 1.91, while the daily volume spike sits at a mere 8%. This extreme compression represents classic "calm before the storm" behavior right before a systemic risk-off repricing.
🎯 Key Levels & Trade Parameters
🟡 Breakout Activation Trigger: 16.33 — This is the immediate line in the sand. A decisive daily candle close above this level confirms the pennant has snapped to the upside, signaling a rapid return of market fear and institutional hedging.
🎯 Technical Target: 31.72 — Calculated using the classic measured move of the pennant's flagpole. If equity markets face a sharp correction and the VIX breaks its overhead resistance channel, this handle is the macro institutional liquidity target, offering an asymmetric 4:1 Risk-to-Reward profile.
🔴 Invalidation / Stop Loss: 12.48 — A daily close below this critical baseline floor completely invalidates the pennant structure, indicating that volatility will drop back into deep, prolonged complacency.
💡 The Macro Strategy
Because the VIX represents implied market volatility, an upside breakout here will likely serve as a leading or simultaneous indicator of a sharp correction in the S&P 500 and Nasdaq. Do not chase the noise inside this minor 15.00–16.00 consolidation pocket. Watch for a definitive daily close outside of the trendlines accompanied by a sudden surge in volume to validate the breakout.
Are you hedging for a sharp volatility spike, or do you expect market complacency to push the VIX into single digits? Let me know your game plan in the comments below!
Disclaimer: This analysis is for educational and study purposes only and does not constitute financial, investment, or trading advice. Trading involves risk.
Market indices
S&P 500 knocking on the door of record highsThe S&P 500 has been range-bound over the past couple of weeks, repeatedly finding buyers on dips towards 7,425 support while remaining capped beneath 7,550 resistance. Having just completed a bullish engulfing candle, taking the index back to the top of the range, and with Asian equity markets ripping higher led by technology stocks, the positive tone may extend into the US session.
Should we see a break above 7,550 that sticks, long positions could be considered with a tight stop beneath 7,550 for protection, initially targeting a retest of the record high at 7,620.
The oscillators favour longs over shorts, with RSI (14) holding above 50 while MACD has staged a bullish crossover, bolstering both the signal and the merits of the trade. The same applies to the key medium and long-term moving averages, with the 50, 100 and 200-day moving averages all rising and stacked in bullish order.
Good luck!
DS
Spx500 All The Way To The Top?!?!?So I will keep this short as I already have notes on the chart. But main thing to take away is the fact that Thursday expanded after creating a fractal low breaking the daily divergent. Now I’m long into highs. Any structure that forms supporting longs and I will enter.
What to look out for is the fact that tomorrow is CPI and that means anything can happen. Looking at the weekly candle I am not a fan of trading pass the open on a regular week but with CPI I believe we can make the objective.
What do you think? Leave feedback .
SP 500 Forecast panic cycles 8/5 and 10/16 The Sp 500 is nearing the end of the decline in wave C for wave B low The last advance should see above the last high likely 7641 to 7710 focus 7660 july 10th . Then THE start The first leg of the panic is ugly into 8/5 low from there we should see a ABC rally into sept 2nd Then The next leg of the CRASH cycle into oct 10 to the 20th focus is 10/16th This is what I see and how it will unfold ! best of trades WAVETIMER
Your perfect trade got killed by one solution from WashingtonYou make a perfect analysis, found the perfect entry. Level, volume, divergence — everything lined up. You enter the trade… and 10 minutes later price blows through your stop like your analysis never existed. Sound familiar? At that exact moment, the Fed Chair was speaking somewhere - and the market was listening to him, not your indicator. Technical analysis shows you WHAT price is doing. Fundamental analysis explains WHY. And in 3 minutes, i ’ll give you the entire macro foundation - without it, you’re trading blindfolded.
1. Inflation — the Economy’s Thermometer
Inflation is the speed at which your money loses value. A year ago coffee cost $4, today it’s $4.40 - that’s 10% inflation. An inflation (around 2%) is normal — the economy is “warm.” But when it accelerates, central banks step in. And that’s where things get critical for traders.
Watch the CPI report (Consumer Price Index) - on release day, the market can move 2-3% in minutes.
2. The Fed Rate — the price of money
Imagine money is a product, and it has a price. That price is the interest rate.
• Low rate → cheap loans → businesses and investors borrow and buy assets → stocks and crypto rise UP
• High rate → expensive loans → money flows out of risk assets → markets fall DOWM
The Fed raises rates to cool inflation and cuts them to stimulate the economy. This is the main lever moving ALL markets — from the SPCFD:SPX S&P 500 to Bitcoin BITGET:BTCUSDT
The FOMC meets 8 times a year. Mark those dates in your calendar - trading during these events without understanding the context is dangerous.
3. Unemployment — the Economy’s Pulse
It sounds paradoxical, but for markets: too much good news is bad news.
Low unemployment → companies fight for workers → wages rise → people spend more → inflation accelerates → the Fed keeps rates high → markets suffer.
That’s why the market sometimes RALLIES on a weak jobs report (Non-Farm Payrolls). Traders aren’t celebrating unemployment - they’re celebrating future rate cuts.
4. Bond Yields - the Fear detector
US Treasuries are the “risk-free” asset. And they pay a yield.
Simple logic: why risk money in stocks for 8% a year when the government guarantees 5% for free? When the 10-year Treasury yield rises - money drains out of stocks and crypto. When it falls - risk assets come back to life.
The ticker TVC:US10Y is right there in TradingView. Add it to your watchlist next to BTC and the S&P - you’ll see how often they move in mirror image. This is a very important indicator on which the pricing of many assets (including gold) depends. I also do reviews and analysis of bonds on this channel.
5. Money Supply (M2) — How much water Is in the pool
Picture the market as a swimming pool and money as water. When the Fed “prints” ECONOMICS:USM2 money (QE), the water level rises — and all boats float higher: stocks, real estate. Remember 2020-2021.
When money gets drained (QT) — the water recedes, and you see who was swimming naked. Remember 2022.
The M2 chart explains bull and bear cycles better than any moving average.
How it all Connects:
One chain worth memorizing:
Inflation rises → the Fed hikes rates → bond yields rise → money leaves risk assets → stocks and crypto fall.
And in reverse — when inflation cools, the cycle turns, and a bull market begins.
What to Do Right Now
1. Open the economic calendar and mark the next CPI, NFP, and FOMC dates
2. Add US10Y to your watchlist
3. Before every trade, ask yourself: “What phase of the cycle are we in - is money flowing into the market or out of it?”
4. Read my other articles on economics, investing, and trading, and i bet your trading results will improve.
Technical analysis tells you WHERE to enter. Fundamental analysis tells you whether you should be entering at all.
DAX: Back Above 25,000 After a 1,060-Point DiveDAX just clawed back the round-number floor after wiping out two weeks of gains in a violent slide — respect the speed of both moves.
KEY LEVELS
- First test: 25,000 (round number, immediate battleground)
- Reclaim: 25,200 (Jul 2 breakout shelf — the level that launched the rally to 25,900)
- Make-or-break: 24,840 (Wednesday's crash low) — danger zone 24,840-24,600
- Reference: 25,900 (Tuesday's high, top of the round trip)
TRADE PLAN
- Bullish: 4H close above 25,200 → long, stop below 25,000, targets 25,400 / 25,600
- Bounce: hold above 25,000 on a retest → long, stop below 24,840, target 25,200
- Bearish: 4H close below 24,840 → short, stop above 25,200, targets 24,600 / 24,400
- Between 24,840-25,200: no trade
INVALIDATION
Bullish case dies below 24,840. Bearish case dies above 25,200. No shame either way.
Fast crashes deserve fast confirmation before you trust the bounce. I will update this idea as the levels get tested.
US30: Record Highs, Zero Drama - The Levels Guarding the TrendThe Dow is doing the most boring thing an index can do: quietly making record highs. +19% off the April low at 45,000, and every pullback since has been shallower than the last.
Boring is not a weakness. Boring is what strength looks like on a daily chart.
KEY LEVELS
53,400 - blue-sky line. Above it the index is in price discovery.
52,300 - first test. The July breakout shelf, first support below price.
50,200 - make-or-break. The June swing low. The uptrend structure lives or dies here (danger zone 50,200-49,700).
TRADE PLAN
Continuation: daily close above 53,400 = long, stop below 52,300, targets 54,500 / 55,000.
Dip-buy: touch of 52,300 that closes back above it = long, stop below 50,200, target 53,400.
Bearish: daily close below 50,200 = short, stop above 52,300, targets 49,700 / 48,300.
Between levels with no trigger: no trade.
INVALIDATION
The bullish map is wrong on a daily close below 50,200. No shame in that, it simply means the June low failed.
THE LESSON
Trends rarely end quietly. Record highs with shrinking pullbacks are the market telling you demand is absorbing every dip. Fear the loud reversal, not the quiet grind.
Boring is bullish until a level says otherwise. I will update this idea as the levels get tested.
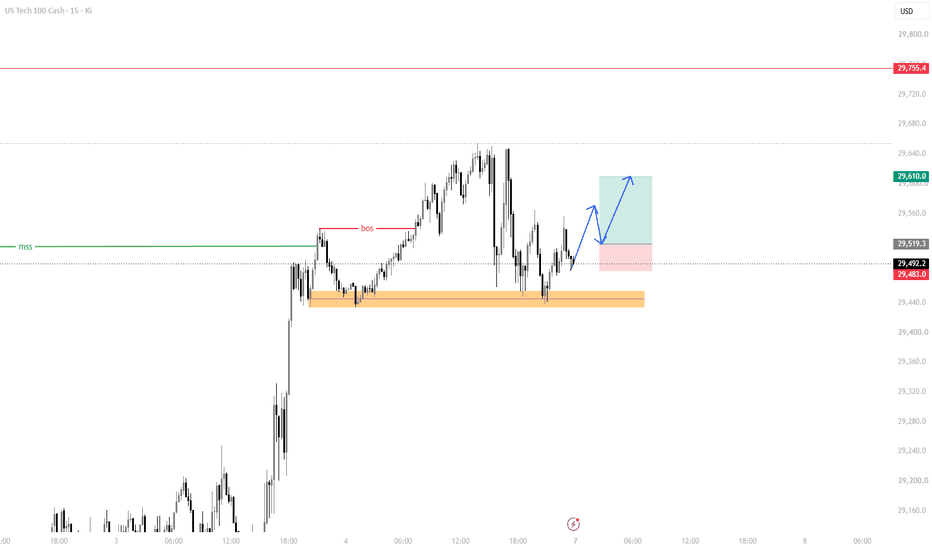
Nasdaq-100 Wave Analysis – 9 July 2026 - Nasdaq-100 reversed from support zone
- Likely to rise to resistance level 30770.00
Nasdaq-100 recently reversed up from the support zone between the pivotal support level 28800.00 (which has been reversing the price from May), 38.2% Fibonacci correction of the upward impulse from April and the lower daily Bollinger Band.
The upward reversal from this support zone stopped the previous short-term ABC correction 2.
Given the clear daily uptrend, Nasdaq-100 can be expected to rise further toward the next resistance level 30770.00 (which stopped earlier waves (3) and 1).
Nikkei 225 index Wave Analysis – 9 July 2026
- Nikkei 225 reversed from support zone
- Likely to rise to resistance level 72575.00
Nikkei 225 index recently reversed up from the support zone between the support level 66000.00, lower daily Bollinger Band and the support trendline of the daily up channel from March.
The upward reversal from this support zone created the daily Japanese candlesticks reversal pattern Lon-Legged Doji.
Given the clear daily uptrend, Nikkei 225 index can be expected to rise further toward the next resistance level 72575.00 (which stopped earlier wave (1)).
Market Breakdown...Day 3!!! Strong day for the NasdaqHey Hey TradingView community! Hope you are all doing amazing!! SO I made a video post today for a day 3 update of the Nasdaq 100 index breakdown. The Nasdaq is seeming to have a strong finish overall today...BUT....don't get TOO excited yet.
In this video I break down
1. Overall strength for the day on the NAsdaq
2. Why the overall bias hasn't changed
3.The importance of structure
4. Response is more important than decision! (at times)
5. Patience PAYS
Ok hope you all enjoy this video breakdown and market recap please boost this post & leave some comments if this provides value for you guys!! Stay tuned for day 4....
Cheers!
S&P500: Testing a strong Resistance Cluster. Reversal possible.S&P500 has marginally turned bullish again on its 1D technical outlook (RSI = 56.810, MACD = 26.430, ADX = 22.594) being on a short term rebound just after crossing under its 1D MA50. The 1D MA50 isn't a Support though anymore as it technically broke and closed under during the June 25th-26th Low formation. This rebound now faces a strong Resistance Cluster, the R1 and LH Zones. If rejected, the first target would be the S1 Zone (TP1 = 7,430). If the index closes under it, the next support levels are the S2 and S3. However with the 1D MA50 gone, the market should technically seek the next demand zone on the 1D MA100. That would be a -5.16% decline from the recent LH, just like the early June. Potential contact with the 1D MA100 could be, TP2 = 7,175.
See how our prior idea has worked out:
## If you like our free content follow our profile to get more daily ideas. ##
## Comments and likes are greatly appreciated. ##
SP500 2026 - MANTER SP500 2026 - MANTER
BOA TENDÊNCIA DE ALTA / MANTER
A technical sock analysis evaluates the product’s material composition, construction parameters, biomechanical performance, thermal regulation, moisture management, durability, and user comfort under defined conditions of use. The analysis typically considers fiber content, yarn structure, knit density, elasticity, compression behavior, abrasion resistance, seam placement, cushioning zones, and dimensional stability after washing.
Bullish momentum to continue?US Dollar Index (DXY) is falling towards the pivot whichis an overlap suport and could bounce towards the pullback resistance.
Pivot: 100.54
1st Support: 100.15
1st Resistance: 101.16
Disclaimer:
The opinions given above constitute general market commentary and do not constitute the opinion or advice of IC Markets or any form of personal or investment advice.
Any opinions, news, research, analyses, prices, other information, or links to third-party sites contained on this website are provided on an "as-is" basis, are intended to be informative only, and are not advice, a recommendation, research, a record of our trading prices, an offer of, or solicitation for, a transaction in any financial instrument and thus should not be treated as such. The information provided does not involve any specific investment objectives, financial situation, or needs of any specific person who may receive it. Please be aware that past performance is not a reliable indicator of future performance and/or results. Past performance or forward-looking scenarios based upon the reasonable beliefs of the third-party provider are not a guarantee of future performance. Actual results may differ materially from those anticipated in forward-looking or past performance statements. IC Markets makes no representation or warranty and assumes no liability as to the accuracy or completeness of the information provided, nor any loss arising from any investment based on a recommendation, forecast, or any information supplied by any third party.
SOX head n shoulder is showing weakness upside target 14100/1440The upside target original work based of % above the 200 day avg as we saw in 2000 was 14100/14400 we saw a high of 14675 . Then we saw what seemed be and ABC decline and I had thought we could see another Blowoff in July BUT the cycles I have were due to peak july 9 to 14th These is still a few days But I have panic cycles due 8/5 to 10/16 and it calls for some rather big declines Best of trades WAVETIMER
Singapore stock market finally about to run!??Whilst the likes of Taiwan and Kospi have made massive run ups Singapore seems massively undervalued and is also being helped by the AI boom.
SLong
Kospi to go up next daysKRX:KOSPI ohh no KOSPI its down 23% from high's enf of world... nooo daily very oversold I see it go back to 9k if not new ath...
same thing asJapan index NIKKEI
Nasdaq should follow with NIKKEI
SPREADEX:NIKKEI CAPITALCOM:NAS100
This is not a daytrade, just swing trading daily only ** come back in a week
Nifty50 view for tomorrow | 10 July 📊 NIFTY 15m – Analysis
CMP: 23,977
🔴 Resistance: 24,050–24,150
🟢 Support: 23,800
SMC View: Price is trading between demand and supply. Until one side is broken, avoid random entries.
🐂 Above 24,150: Bullish momentum can extend towards 24,300–24,500.
🐻 Below 23,800: Weakness can continue towards 23,600–23,400.
🎯 Strategy: Trade only after breakout or breakdown confirmation. Inside the range = No Trade.
SPX500USD Bearish Rejection from Resistance
The S&P 500 is approaching a major resistance zone after a strong bullish rally from the ascending trendline. Price is now testing a key area where sellers may step in. A rejection from this resistance, followed by a break below the trendline support, could trigger a bearish move toward the **7,485** target.
**Key Levels:**
* **Resistance:** 7,555–7,560
* **Trendline Support:** Ascending support zone
* **Bearish Target:** 7,485
**Trading Plan:**
Watch for bearish confirmation at the resistance zone. If price breaks below the ascending trendline and loses support, the downside target around **7,485** becomes the next area of interest. If resistance is broken instead, the bearish setup will be invalidated.