7625: The Durability Test)Hey traders! 🦬🐻🏋🏽
In my last post, I warned you about a possible reversal 🔪🐻 around 7777 on the approach from below:
«Take a look at how many times price has been rejected from the 7777 level since August 5. The resistance here is clearly significant, and there are no guarantees that this attempt will be the one where we finally see a genuine breakout and acceptance above the level.
If price gets rejected once again, the initiative could shift back to the bears, with a high probability of another move toward 7625 — similar to what we saw from August 28 to September 1.»
The reversal did indeed happen around 7777 ✅, and the following scenario played out almost perfectly, with price touching 7625 ✅🎯 during yesterday’s trading session.
What’s happening on the chart right now?
The 7625–7777 range identified in my previous posts remains relevant 📉📈
Additionally, we can now identify a local descending parallel channel, so we’ll also be watching how price reacts to its boundaries.
The scenarios remain unchanged.
🦬🚀Bullish scenario.
A breakout and acceptance above 7777 would open the way toward the previous ATH at 7822, followed by the measured move target at 7950.
🐻🪓Bearish scenario.
If the bears manage to push price below 7625, we could see a drop toward 7555.
And this is where the bears will really have to work, because 7555 is a concrete wall — price has repeatedly slowed down around this level when approaching it from below.
Peace! 🌄
⚠️ Disclaimer:
All information shared on this channel is for educational and informational purposes only and is not investment advice. The author is not responsible for your trading decisions. Always manage your risk and make decisions independently.  Short
Short
France 40 Near ATH — Short-Term Sell SetupFrance 40 is currently trading near its all-time high levels, where the market appears to be facing increased selling pressure after an extended bullish move. At these elevated levels, price is showing signs that a short-term downside move could develop as sellers begin to step in and take control.
The current trade idea is focused on the selling side, with expectations of a temporary decline from the present high-zone area. After reaching such elevated levels, the market can experience profit-taking and a corrective downward movement, particularly if price fails to sustain the current highs and bearish pressure continues to build.
From a technical perspective, the focus remains on identifying a clean selling opportunity around the current high-area rather than chasing the market. A rejection from the upper levels, combined with weakening price action, could provide further confirmation for the downside setup. Traders should closely monitor market structure and price reaction before taking any position.
The overall bias for this setup is bearish in the short term, with the expectation that France 40 may move lower from its current elevated zone. However, because the index is trading close to record levels, volatility can remain significant, so proper position sizing and risk management are essential.
📊 Market: France 40
📉 Bias: Short-Term Bearish
📍 Zone: Near All-Time Highs
🎯 Focus: Downside Movement
⚠️ Trade Type: Selling Opportunity  Short
Short
 Long
Long
Hang Seng Tech nears interesting risk-reward zoneWhatever optimism existed about Hang Seng Tech finally managing to break above a strong resistance zone comprising the October 2025 downtrend and 100-day moving average earlier this year has all but evaporated, and then some.
The index has since sliced back beneath the 100-day moving average, broken the minor uptrend that had been in place from the June low, fallen beneath the 50-day moving average and then slipped back underneath former trend resistance.
That leaves the price within a whisker of some pretty important levels. The first is 4,250, which was the swing low back in April 2025 and where the index bounced strongly in June this year. Beneath that sits an even more important zone around 4,190, which acted as a major swing high in May 2024 before flipping to support in November 2024 and again in January 2025.
Let’s be honest. The price action is completely ugly. It has been a dog for the bulls. The index is trading beneath all its key medium and long-term moving averages, which are now showing signs of rolling over again, while downside momentum continues to build. And while RSI (14) is now oversold, the bears remain utterly in control.
At some point, you have to ask the question: when do the bulls decide to step back in? Because if 4,190 is broken cleanly, there’s not a lot to hang your hat on technically until the psychological 4,000-point level. Beneath that, 3,800 stands out as the next obvious level, having acted as a breakout zone back in September 2024.
That leaves the near-term price action worthy of being on the watch list. To be sure, the downside move has happened. Momentum is with the bears and there’s nothing on the charts to suggest the bearish trend has turned. But with the index pressing towards a known support zone, it creates opportunities for two-way directional setups depending on how the price action evolves.
I would be reluctant to join the selling right now, even though we have seen a clear breakdown through minor support at 4,460 and an accelerated move lower. If 4,190 were to be broken, back-tested and rejected, it would provide a decent entry level for shorts, allowing for positions to be established beneath the level with a tight stop above either it or 4,250 for protection, depending on preferred risk-reward, targeting 4,000 and then, beneath that, 3,800.
If the index were to bounce from the support zone, or deliver a short-term bottoming signal, there are grounds to look for a counter-trend squeeze, although given the prevailing trend, risk management must be paramount. If a setup arrives, the zone can be used for protection, allowing for entry above with a stop beneath, targeting a reversal to either 4,460, 4,660 or the 50-day moving average as potential targets.
In the interim, be patient.
Good luck!
DS S&P 500: Wall Street Says 8,100. The Chart Says Not Yet.
HSBC raised its year-end S&P 500 target to 8,100 this week, up from 7,650. Strategist Nicole Inui is pointing to earnings growth near 40% in the first half of the year and a full-year forecast of $360 per share at a 22.5x multiple.
Here's what makes it interesting: she flagged September seasonal weakness and this week's inflation data as near-term risks in the same note. So even the bullish call expects a rough patch first.
That's exactly what the chart is showing.
Where we are
We closed at 7,636, down 0.48%, after a lower high inside a falling channel — a bull flag, and normal corrective behaviour after the run from the August low at 7,313.
The immediate problem is how tight things are. The 0.382 retracement sits at 7,624.71 and our key line sits at 7,616.41. Price is roughly 20 points above both. There's very little room before this gets decided.
The bull case
The falling channel is corrective — this is the kind of structure that resolves higher inside an uptrend. As long as 7,616 holds on a closing basis or a retest of the 50% happens, the bull flag is intact and the path toward HSBC's number stays open.
The bear case
We printed a lower high, RSI divergence marked that top, and price has lost the EMAs at 7,667 and 7,603 — both now overhead resistance.
A close below 7,616 turns that line into a deviation point.
Total invalidation
Losing the 1–4h support at 7,313–7,360 is where this stops being a pullback. Below that, we're looking at a move back toward the higher-timeframe ascending channel, and the 8,100 conversation goes on hold entirely.
Bottom line
Two things can both be true. The bank case for 8,100 is built on earnings, and earnings haven't changed. The chart is built on structure, and structure has weakened.
PPI lands today at 4:30pm Dubai that's the catalyst that decides which one matters first.
Follow for more.  Short
Short
Bullish bounce at Fib support?DAX40 (DE40) is reacting off the pivot, which is a pullback suport that aligns with the 127.2%, 145% Fibonacci extensions and the 61.8% Fibonacci projection and could bounce towards the 1st resistance, which is an overlap resistance that aligns with the 50% Fibonacci retracement.
Pivot: 25,577.98
1st Support: 25,189.15
1st Resistance: 25,836.21
Disclaimer:
The opinions given above constitute general market commentary and do not constitute the opinion or advice of IC Markets or any form of personal or investment advice.
Any opinions, news, research, analyses, prices, other information, or links to third-party sites contained on this website are provided on an "as-is" basis, are intended to be informative only, and are not advice, a recommendation, research, a record of our trading prices, an offer of, or solicitation for, a transaction in any financial instrument and thus should not be treated as such. The information provided does not involve any specific investment objectives, financial situation, or needs of any specific person who may receive it. Please be aware that past performance is not a reliable indicator of future performance and/or results. Past performance or forward-looking scenarios based upon the reasonable beliefs of the third-party provider are not a guarantee of future performance. Actual results may differ materially from those anticipated in forward-looking or past performance statements. IC Markets makes no representation or warranty and assumes no liability as to the accuracy or completeness of the information provided, nor any loss arising from any investment based on a recommendation, forecast, or any information supplied by any third party.
Long 
Bearish momentum to continue?Dow Jones (US30) is rising towards the pivot, which is an overlap reistance that lines up with the 38.2% Fibonacci retracement and could reverse towards the 1st support, which is a pullback support that aligns with the 145% Fibonacci extension.
Pivot: 52,904.67
1st Support: 52,088.44
1st Resistance: 53,240.30
Disclaimer:
The opinions given above constitute general market commentary and do not constitute the opinion or advice of IC Markets or any form of personal or investment advice.
Any opinions, news, research, analyses, prices, other information, or links to third-party sites contained on this website are provided on an "as-is" basis, are intended to be informative only, and are not advice, a recommendation, research, a record of our trading prices, an offer of, or solicitation for, a transaction in any financial instrument and thus should not be treated as such. The information provided does not involve any specific investment objectives, financial situation, or needs of any specific person who may receive it. Please be aware that past performance is not a reliable indicator of future performance and/or results. Past performance or forward-looking scenarios based upon the reasonable beliefs of the third-party provider are not a guarantee of future performance. Actual results may differ materially from those anticipated in forward-looking or past performance statements. IC Markets makes no representation or warranty and assumes no liability as to the accuracy or completeness of the information provided, nor any loss arising from any investment based on a recommendation, forecast, or any information supplied by any third party.
 Short
Short
Long 
KSE-100 Index — Technical Update (Daily Chart)KSE-100 Index — Technical Update (Daily Chart)
The benchmark KSE-100 closed at 171,943.60, down 698.56 points (-0.40%) on the session, after trading in a range between 171,801.67 and 173,174.19.
Structure
Since bottoming near 148,000 in March 2026, the index has been advancing within a well-defined ascending channel, with each higher high and higher low respecting the channel's upper and lower boundaries. The current price action has now brought the index back down to test the lower boundary of this channel — a zone that also coincides with a horizontal support/resistance shelf around 168,000–172,000, which acted as resistance in October and December 2025 before flipping into support territory once broken to the upside in February 2026.
This confluence — trendline support meeting horizontal support — makes the current zone a decision point for the next directional move.
Key Levels
Immediate support: 169,600–169,402 (channel base / horizontal shelf)
Resistance on recovery: prior swing highs near 184,000–188,000
Scenarios
Bullish case: If the index holds the current support confluence, a rebound back toward the mid-channel and eventually the upper boundary would confirm the uptrend remains intact, keeping the broader bullish structure in play.
Bearish case: A confirmed break below the channel and the 171,800 shelf would open the door to a deeper pullback toward 169,600–169,402, where buyers would need to step back in to defend the broader trend.
Bias: Neutral-to-bullish while support holds; a decisive close below the channel would shift the near-term bias to corrective.  Long
Long
 Short
Short
 Short
Short

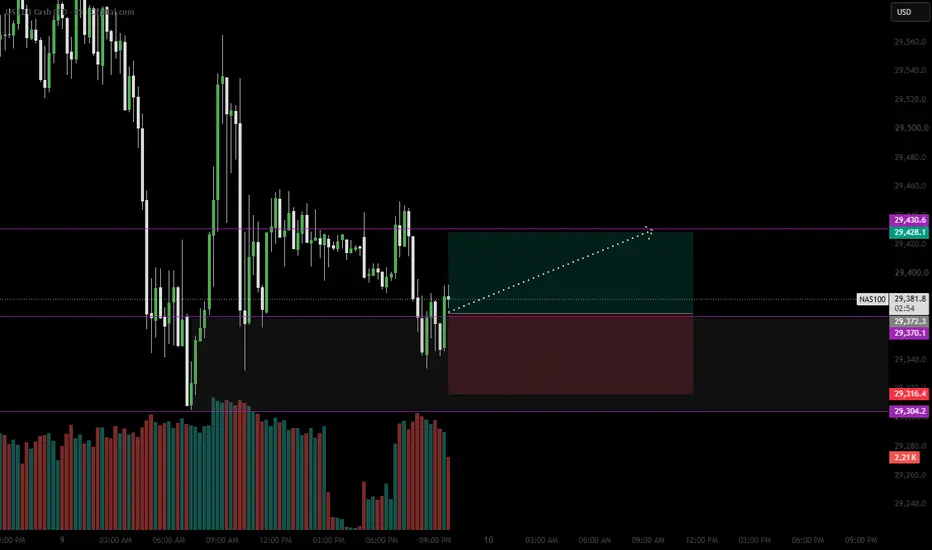
NASDAQ Chart Review: Short Setup, Alerts, and DXY Correlation Action Items
- Set an alert for price crossing back up into the range — the 50% zone, where the one-day high sits exactly at 50%
- On that alert, place a sell stop order with stop loss and target at the one-day level — the planned short entry
- Cancel the sell stop order if price breaks the 29,736 swing high — a bullish invalidation that costs zero
- If the bullish break happens, look for the mirror setup — correction, continuation, entry back above the level, targeting daily highs and possibly all-time highs
Context & Disclaimer
Just to be clear upfront — I don't sell courses or signals, and I'm not a guru. My trading income comes entirely from trading. This is my personal trade journal, and I started sharing it because friends and family kept asking how I do this. I figured if I'm going to explain it anyway, I might as well post it publicly in case it helps others with their own trading education. Nothing here is investment advice — trading is risky and you can lose money. Follow along if you find it useful, and I genuinely hope it does.
Chart Setup & Key Levels
- Equal highs on the daily read as bearishness — a stalemate with lower lows, though lower highs would be the stronger signal
- Green levels are already touched; black levels are untouched — the green one-day swing high is the key level to watch
- Huge gap marked at 29,088.5 — gaps typically get filled, and price currently looks like it is coming down to test it
- July 30, 2026 low marked as a likely revisit; the area has been tested twice this year and held both times
- All-time high marked, with stacked levels and bodies labeled by the timeframe they appeared on
NAS100 Short Setup
- Bias: Bearish — bear swing on the 4-hour with sellers penetrating the level buyers were holding, bodies closing below it
- Entry logic: Wait for the correction back into the area, then trade the continuation once bodies close below the green level
- Reward: Roughly 3.7:1 from the green level down to the gap, with a possible hold for the gap fill
- Status: Sitting on hands — the indicator is in place, but the correction has not happened yet
Bullish Alternative
- Invalidation level: 29,736 swing high — a break there means the 4-hour has made a higher high and the daily is already slightly higher
- Price could simply be pulling back to make a higher high before continuing the uptrend
- If invalidated, look for the mirror setup: correction, continuation, entry back above the level, targeting daily highs and possibly all-time highs
DXY Correlation & Market Sentiment
- DXY has been going down; if it continues to the next anticipated level of 97.907, NAS100 is expected to rise
- NVIDIA announcing AGI and congratulating OpenAI has no hard proof yet and no clear explanation
- NAS100 skepticism is expected to persist — something overwhelmingly evident is needed for the index to rise
Chart Notes
- Centered the chart so the video thumbnail frames correctly — a recurring struggle lately Short

 Short
Short
Australian banks break lower as RBA risk buildsThe technical picture for Australian financials has deteriorated noticeably, with the ASX 200 Financials index breaking beneath the rising trendline that has accompanied the bull move since late 2023. As things stand, the weekly candle is also shaping as a bearish engulfing pattern, while RSI (14) and MACD both favour short setups over long.
But I’m not ready to chase it lower just yet.
The thing that makes me cautious is what’s happened beneath 9,000 over the past year. There’s been a litany of failed downside breaks from bears, stretching down to the low set in early December at 8,867. That makes the weekly close this Friday really important, along with the price action that follows.
If we get a close beneath the rising trendline, especially if we see a sustained push beneath 8,867, that would strengthen the merits of shorts considerably. You could look to initiate positions beneath the level with a tight stop above for protection, targeting 8,460 initially, which acted as both support and resistance through late 2024 and early 2025.
Beneath that, the 200-week moving average sits just above 8,000, which is also a level the price has done ample work either side of over recent years. Those would be the two logical downside targets initially.
However, if we were to see another failure to sustain a push beneath 9,000, the option is still there to look at longs. The first target for bulls would be the 100-week moving average at 9,200, with 9,400 and the 50-week moving average at 9,451 alternative options after that, depending on desired risk-reward.
Fundamentally, it’s not hard to see why the sector is under pressure. The big four banks dominate the index, housing makes up a huge share of the assets sitting on their books, and the market is now firmly pricing the threat of a couple of RBA hikes before the end of the year.
The Aussie banks also continue to trade with extremely rich valuations, particularly from a global perspective. But I’ve learned on too many occasions in the past that fair valuations and Australian banks don’t always marry up particularly well when it comes to price action. So for me, the bearish bias needs the price action to confirm it.
That’s why the next couple of sessions matter. We get some major economic data out in the States that could heavily influence the local market. So I’d rather see the weekly candle actually close before considering going short.
Good luck!
DS  Short
Short
Elliott Wave Outlook: DAX in Larger Degree CorrectionThe short‑term Elliott Wave view in DAX shows the cycle from the March 23, 2026 low has ended in wave (1) at 26,614.27. This advance formed a clear impulse structure. With wave (1) complete, the Index has entered a larger degree correction in wave (2). The internal subdivision of this correction is unfolding as a double three WXY pattern. Wave W is progressing as a zigzag.
From the peak of wave (1), wave ((a)) declined to 25,727.93. A counter‑trend rally in wave ((b)) followed and ended at 26,167.93. The Index has since resumed lower in wave ((c)). This leg targets the 100%–161.8% Fibonacci extension of wave ((a)). The projected area lies between 24,737 and 25,283. Within this zone, wave W of the double three may complete.
Once wave W finishes, a rally in wave X should develop. This rally will correct the cycle from the August 28, 2026 high before the broader decline resumes. The corrective structure highlights the maturity of the cycle and sets expectations for further weakness after wave X.  Short
Short

**My View on NIFTY 50 — Daily Chart****1. Key Observation**
NIFTY is forming a lower-high structure below the major volume zone around **24,000–24,500**. The current blue-line structure looks similar to the previous corrective pattern, but a full repeat is not confirmed yet.
**2. My View**
Bias remains bearish while NIFTY stays below the recent swing-high zone. However, I would not treat **20,000** as confirmed immediately. First, NIFTY needs to break the **22,000–22,200** support zone with strong selling confirmation.
**3. Invalidation**
The bearish study becomes weak if NIFTY reclaims **24,800–25,000** and sustains above it with volume.
**4. Risk-Reward**
The downside setup offers favorable risk-reward if short entries come near resistance or after confirmed breakdown, with risk defined above the recent swing high.
**5. Target Point / Range**
TG1: **22,000–22,200**
TG2: **20,600–20,000**
Extended support: **18,778**
**6. Why It’s Good for Short**
Lower highs are forming, recovery attempts are struggling near the high-volume resistance zone, and a break below 22K can open the path for a larger correction.
**7. Time Period**
This is a **medium-term bearish view** for the next few months.
Key sequence: **23.4K → 22K → confirmation → 20.6K / 20K**
#NIFTY #NIFTY50 #PriceAction #VolumeProfile #BearishSetup #MarketCorrection #SwingTrading #OptionsTrading #IndianStockMarket
Long

Short