Lower High Puts S&P Breakout Under PressureThe S&P 500 is approaching an important technical test after Friday’s rejection created the first credible lower high since the early-August breakout.
The broader uptrend remains intact, but with a well-defined layer of support sitting beneath current prices and a busy week for US economic data ahead, there is now a much clearer framework for judging whether recent weakness is simply consolidation or the beginning of a deeper pullback.
Why the lower high matters
Friday’s bearish pin-bar is more useful in context than it is as a standalone reversal signal. It appeared below the August high after the market had already lost some momentum, while Monday’s negative close provided the first indication that the rejection was attracting follow-through.
That does not make the broader trend bearish. Price remains above a rising 50-day moving average and, importantly, above the resistance broken at the beginning of August. What it does is create a potential change in short-term structure, with the market now needing to defend support if the breakout is to remain intact.
S&P 500 Daily Candle Chart
Past performance is not a reliable indicator of future results
This distinction is important because lower highs only really gain significance when they are followed by lower lows. Until support gives way, Friday’s rejection could prove to be little more than another pause within the existing trend.
A clear line in the sand
The four-hour chart gives us a cleaner way of judging what happens next. Price has spent the past couple of weeks building a relatively well-defined floor just above the former breakout area, creating a useful layer of support beneath the market.
A decisive break through that zone would change the character of the recent price action. Instead of simply consolidating above the breakout, the S&P would have formed a lower high and then lost the support beneath it. That combination would give the developing lower high considerably more weight and bring the possibility of a deeper retracement into play.
The other side of the setup is equally important. If support continues to attract buyers, the lower high remains provisional and the recent weakness can still be viewed within the context of the broader uptrend.
S&P 500 Four-Hour Candle Chart
Past performance is not a reliable indicator of future results
The timing adds another layer. US job openings and the Fed’s Beige Book arrive on Wednesday, followed by non-farm payrolls on Friday, giving the market several opportunities to reassess the balance between a weakening labour market and still-elevated inflation.
Trying to second-guess those releases is unlikely to add much. Having the technical framework in place beforehand is far more useful because it allows us to judge the market’s response rather than the numbers themselves.
Disclaimer: This is for information and learning purposes only. The information provided does not constitute investment advice nor take into account the individual financial circumstances or objectives of any investor. Any information that may be provided relating to past performance is not a reliable indicator of future results or performance. Social media channels are not relevant for UK residents.
Spread bets and CFDs are complex instruments and come with a high risk of losing money rapidly due to leverage. 89% of retail investor accounts lose money when trading spread bets and CFDs with this provider. You should consider whether you understand how spread bets and CFDs work and whether you can afford to take the high risk of losing your money.
Wall Street's Benchmark Pulls Back — The Setup Is Now Live 🔥💰 US30 / DJIA — "THE DOW JONES INDUSTRIAL AVERAGE" 💰🔥
📈 Index CFD Market — Day Trade / Swing Trade Setup 📈
🟢 BULLISH HEIST PLAN — THE VAULT IS IN SIGHT, THIEVES! 🟢
━━━━━━━━━━━━━━━━━━━━━━━━━━━━━━━━━━━━━━━━━━━━━━━━━━━━
🕵️ My Analysis 🕵️
The Dow Jones Industrial Average — the OG of all indices, the original 30-stock street gang of Wall Street — is currently under the spotlight as we enter September 2026. Known by traders worldwide as US30 or the DJIA, this blue-chip titan has printed a jaw-dropping all-time high of 54,728 back on August 5, 2026, before the bears decided to crash the party. As of the London session on September 2, 2026, the index is trading in the 52,600–52,800 range after two consecutive sessions of selling pressure, with the prior close landing at approximately 52,768. The 52-week range is locked between 44,948 and 54,744, giving us a wide hunting ground for our heist operation.
Price structure shows the Dow pulled back sharply from its all-time high territory into a retracement zone — exactly the kind of dip-and-rip setup that Thief OG's live for. The 51,500–52,000 zone is acting as a dynamic support cluster, while the 53,500 and 54,000 levels stand tall as the police force — strong resistance zones where institutional sellers previously showed their hand. The current macro-driven selloff (rising yields + oil spike) has created an aggressive entry landscape for patient bulls who understand market structure.
Price is respecting the broader multi-month ascending channel, and the momentum structure on the higher timeframes still leans bullish as long as price holds above the 51,000–51,500 demand block. The RSI is cooling from overbought on the weekly — a healthy reset, not a reversal. Volume structure shows dip-buyers stepping in at current levels. The Thief Squad is watching closely. 🔍
━━━━━━━━━━━━━━━━━━━━━━━━━━━━━━━━━━━━━━━━━━━
🧭 My Market Bias 🧭
🟢 BIAS : BULLISH — THE HEIST IS ON
The Thief's market read on the US30 is BULLISH for this setup. The current price dip from the ATH zone is being treated as a reloading opportunity, not a structural breakdown. Price has successfully defended the 52,480 support zone on multiple closes. Our heist plan targets the vault — the 53,500 intermediate checkpoint followed by our grand final target at 54,000. The police force (resistance) is heavy up there, so we plan to grab the loot, activate the escape hatch, and ride clean.
⚡ Entry Style : Flexible — The Thief enters at ANY price level
⚡ The beauty of this setup is the zone-based approach — you're not chasing one candle. Whether you're catching this on the London open, New York open, or a pullback re-entry — the trade structure remains intact as long as price holds above the Thief SL at 51,500.
━━━━━━━━━━━━━━━━━━━━━━━━━━━━━━━━━━━━━━━━━━━━━━━━━━━━
🎯 Possible Scenario 🎯
📌 Entry : ANY PRICE LEVEL — Zone-based flexible entry (no fixed entry needed)
🎯 Target 1 : 53,500 — First heist checkpoint (intermediate resistance / partial profit zone)
🏆 Main Target : 54,000 — THE VAULT — Final target where police force (overbought resistance + trap zone + potential reversal cluster) gets thick
🚪 Thief SL : 51,500 — The Escape Hatch (structural invalidation level below demand)
📌 Note: Dear Ladies & Gentleman (Thief OG's) i'am not recommended to set only my TP. its your own choice you can make money then take money at your own risk.
📌 Note: Dear Ladies & Gentleman (Thief OG's) i'am not recommended to set only my SL. its your own choice you can make money then take money at your own risk.
⚠️ Transparency Flag : Target at 54,000 is within striking distance of the August 2026 ATH at 54,728. Price has already visited this territory — it is a proven high-traffic zone with institutional memory. Heavy resistance and profit-taking pressure should be expected in the 53,500–54,000 band. Escape with profits smartly, Thieves — don't get greedy and end up in handcuffs. 🚔
━━━━━━━━━━━━━━━━━━━━━━━━━━━━━━━━━━━━━━━━━━━━━━━━━━━━
👀 Areas I Am Watching 👀
🔴 Resistance Zones (Police Force HQ) :
— 53,170 : Near-term pivot resistance (recent swing high post-dip)
— 53,500 : Intermediate target / partial profit zone
— 54,000 : THE VAULT — main heist target
— 54,728 : All-time high — maximum police force zone ⚠️
🟢 Support Zones (Thief Safe Houses) :
— 52,480 : Key short-term support — must hold for bullish structure
— 51,500 : Thief SL / Escape Hatch — structural base
— 50,800 : Deep support / demand block
📐 Technical Confluence Points :
— RSI cooling from overbought on weekly — healthy correction in progress
— Price trading below declining 20-period MA on the 4H — watch for reclaim
— 1H chart showing potential descending channel breakout setup forming
— Prior ATH demand-turned-supply at 54,728 still dominant overhead
━━━━━━━━━━━━━━━━━━━━━━━━━━━━━━━━━━━━━━━━━━━━━━━━━━━━
🌐 Correlated Pairs & Markets to Watch 🌐
Watching these correlated markets gives the Thief an edge — when the pack moves together, the heist has more power. When they diverge, stay sharp and size down. 🎯
📊 NAS100 (Nasdaq 100 CFD) — ~29,185 (down ~1.11%)
Positive correlation with US30. Both are US equity indices — when NAS100 dips, US30 typically follows, and vice versa. NAS100 is currently under heavier selling pressure due to the tech sector rout (chip stocks hit hardest). A recovery in NAS100 is a green light for US30 bulls. Watch this one like a hawk. 🦅
📊 SPX500 (S&P 500 CFD) — ~7,635–7,686 range
Positive correlation with US30. The SPX500 offers the broadest US market read. It dropped 0.3% on Monday and is tracking lower into the Tuesday close. SPX500 holding above 7,600 is key for maintaining the broader bull structure across US equities including the Dow.
📊 GER40 (DAX 40, Germany Index CFD) — ~6,440–6,449 area
Moderate positive correlation. European indices often track US sentiment during overlapping sessions. A weaker GER40 / EU50 print can front-run weakness in US30 at the New York open. Currently under mild pressure alongside global equity selling.
📊 UK100 (FTSE 100 CFD) — Monitoring for divergence
The UK100 has a looser correlation to US30 due to its heavy energy and commodity weighting. With WTI crude climbing sharply (US-Iran tensions), the UK100's energy sector actually provides a partial hedge. Divergence here is notable — if UK100 holds or rallies while US30 dips, it signals a commodity-driven rather than risk-off selloff.
📊 XAU/USD (Gold Spot) — ~4,600–4,646 area
Inverse / Flight-to-safety correlation. Gold is surging as yields spike and geopolitical risk escalates. A gold rally above 4,650 signals heightened fear and could delay the US30 recovery. Watch gold as a risk barometer. If gold starts to retreat, risk appetite may return to equities.
📊 WTI Crude Oil — ~$85.20 area (up sharply)
Negative correlation under current macro regime. Surging oil (US-Iran strikes in Strait of Hormuz) is fuelling inflation fears, which is driving yields higher, which pressures equities. WTI cooling below $83 would be a bullish relief signal for US30. Energy sector (Chevron, etc.) benefits, but broad market digests oil spike poorly.
📊 US Dollar Index (DXY) — ~104 area (slightly firmer)
Inverse correlation with risk indices. A stronger DXY typically weighs on US equities in the short term. Monitor DXY reaction around upcoming NFP and CPI — a DXY pullback post-data would be supportive for US30 bulls.
━━━━━━━━━━━━━━━━━━━━━━━━━━━━━━━━━━━━━━━━━━━━━━━━━━━━
📰 Educational Breakdown 📰
🏛️ Fundamental & Economic Factors — NEUTRAL MARKET REALITY
(What the market is actually saying — not biased toward any trade direction)
--- BULLISH FACTORS FOR US30 ---
✅ Q3 2026 quarterly performance remains positive — The Dow, S&P 500, and Nasdaq are all tracking for their fourth consecutive annual gain. Historical momentum of this kind is a powerful structural tailwind.
✅ Corporate earnings resilience — Blue-chip Dow components have broadly delivered strong results. Consumer staples, healthcare (Merck, J&J), financials, and energy (Chevron) have led with solid earnings beats.
✅ AI and technology capital expenditure boom — AI-driven spending across the broader economy is supporting productivity metrics and earnings expectations for 2026, with S&P 500 earnings growth consensus near 15% for the calendar year.
✅ Strait of Hormuz diplomatic signals — Reports of potential Iran-Oman monitoring protocols and Washington pausing fresh strikes have introduced de-escalation hope, which could rapidly reverse the oil spike and yield surge if confirmed.
✅ Bitcoin and crypto sector gains — Crypto-related stocks (Coinbase, Robinhood) surged recently, signalling a broader risk-appetite pocket within the market that has spillover into financials.
✅ Treasury buyback programme — The US Treasury's expanded bond buyback programme for 10–30 year debt was introduced to stabilise the market, reducing some of the dislocation-driven yield pressure.
--- BEARISH FACTORS FOR US30 ---
❌ US 10-Year Treasury yield at 4.78–4.80% — The highest since January 2025. Rising yields increase the discount rate for equity valuations, directly pressuring high-P/E stocks and creating competition for capital vs equities.
❌ US 30-Year Treasury yield at 5.31% — Highest since June 2007. Elevated long-end yields signal persistent inflation concerns and government borrowing demand, compressing equity multiples.
❌ WTI Crude Oil surging — US-Iran military exchanges in the Strait of Hormuz have sent crude prices sharply higher. Elevated energy prices reignite inflation fears and could force the Federal Reserve into a more aggressive stance.
❌ Fed rate hike probability rising — Markets are now pricing approximately 65–68% probability of a 25 bps rate hike at the September 15-16 FOMC meeting, up sharply from ~36-40% before Fed Chair Warsh's hawkish Jackson Hole remarks. Current Fed funds target range: 3.50%–3.75%.
❌ Fed Chair Kevin Warsh hawkish tone — At the Jackson Hole Symposium, Chair Warsh stated the Fed will "have work to do" if inflation does not convincingly move toward the 2% target. Fed Governor Barr echoed that rates should rise if inflation stays elevated.
❌ Global bond yield surge — Not just the US. Japan's 10-year bond touched 3.00% (highest since 1996). UK Gilt 10-year hit 5.25% (highest since 2008). German Bund yields also rising. This is a global bond market stress event that historically creates equity headwinds.
❌ Sector weakness in tech and industrials — Alphabet, Nvidia, Caterpillar, Amazon all fell sharply. The industrials sector is the weakest in Q3 so far, down 7.1%. Tech heavyweights dragging on the NAS100 component adds spillover pressure to broader indices.
❌ Geopolitical overhang — US-Iran tensions remain fluid. Any fresh escalation in Strait of Hormuz attacks could immediately spike oil and risk-off sentiment, hitting equities hard.
━━━━━━━━━━━━━━━━━━━━━━━━━━━━━━━━━━━━━━━━━━━━━━━━━━━━
📅 Upcoming High-Impact Economic Events Calendar 📅
(London Time — All times GMT+1 unless otherwise noted)
⚠️ CAUTION — Multiple tier-1 events incoming before our target resolution window. Thief OG's: consider position sizing and timing carefully around these dates!
🔴 Friday, September 5, 2026 — US Nonfarm Payrolls (NFP) Report @ 13:30 London Time
↳ One of the single most market-moving events of the month. A strong jobs print supports the Fed hike narrative (negative for equities). A weak print reduces hike pressure (positive for equities). Dow futures are already edging lower ahead of this release. Thief OG's with open positions — BEWARE NFP Friday!
🔴 Friday, September 11, 2026 — US CPI Inflation Report (August) @ 13:30 London Time
↳ The next major inflation reading. Coming just 5 days before the FOMC decision, this print will almost certainly tip the balance on whether the Fed hikes 25 bps or holds. A hot CPI = higher hike odds = bearish for US30. Cool CPI = relief rally potential.
🔴 Tuesday–Wednesday, September 15–16, 2026 — FOMC Interest Rate Decision
↳ The big one. Decision announced Wednesday September 16 at 19:00 London Time. Current target range: 3.50%–3.75%. Markets pricing ~68% chance of a 25 bps hike. A surprise hold = bullish pop. Confirmed hike = initial selloff likely before markets reassess. This is a Summary of Economic Projections (SEP) meeting — dot plot and economic forecasts also released. Press conference at 19:30 London Time.
🟡 This Week — US ISM Manufacturing & Services Data, JOLTS Job Openings
↳ Medium-to-high impact on near-term sentiment and yield direction.
━━━━━━━━━━━━━━━━━━━━━━━━━━━━━━━━━━━━━━━━━━━━━━━━━━━━
💎 Thief Trader Wishes & Motivation 💎
"The best trades are not the ones chased — they are the ones patiently waited for.
In this market, information is the vault, patience is the key, and discipline is your escape route.
Even the greatest Thief doesn't rush the heist — they study the guards, time the alarm,
and strike when the moment is undeniable.
September will test your nerves. Let it.
Every red candle is just the market hiding its loot before handing it to those who stayed calm.
The Vault is at 54,000 — stay the course, manage your risk, and let the heist play out.
We trade smarter, not harder. 🎯🔥"
— Thief Trader
━━━━━━━━━━━━━━━━━━━━━━━━━━━━━━━━━━━━━━━━━━━━━━━━━━━━
🤝 Support the Heist Crew — Community Call to Action 🤝
If this US30 breakdown added value to your trading day and sharpened your edge on the Dow Jones —
👍 SMASH that BOOST button — it keeps the heist alive on TradingView!
❤️ DROP a LIKE if the analysis resonated with you!
🔔 HIT FOLLOW so you never miss the next Thief setup!
💬 DROP A COMMENT below — tell us where you entered, your thoughts on the Dow, or just say hey! The Thief OG community is built on shared knowledge and good vibes. 🙌
Every boost, like, and follow helps this idea reach more traders globally — let's grow the crew! S&P 500 — Healthy Correction or Trend Reversal?Market Structure
The S&P 500 remains within a broader bullish trend despite the recent pullback from its record highs. Price continues to trade above previous breakout levels, suggesting that the current decline is more likely a corrective retracement than a confirmed reversal. Buyers still hold the broader structural advantage as long as key support remains intact.
Market Sentiment - Moderately Bullish
Short-term momentum has weakened following the recent rejection near the highs, but overall market sentiment remains cautiously constructive. The broader uptrend continues to favor buyers while price stays above major support.
Bullish Scenario
If buyers defend the current support area and reclaim 7,680, bullish momentum could strengthen again. A sustained move above 7,740 would increase the probability of another attempt toward the recent record highs around 7,800.
Bearish Scenario
If sellers break decisively below 7,600, the current correction could extend toward the next support zone near 7,500. Losing that level would increase the likelihood of a deeper pullback within the broader uptrend.
────────────────────
Market Outlook
The recent decline appears to be a normal retracement following a strong rally rather than the start of a major bearish reversal. Buyers are testing an important demand zone, and the next directional move will likely depend on whether price can establish another higher low before challenging resistance again.
────────────────────
Key Levels
First Resistance 7,680
Second Resistance 7,740
First Support 7,600
Second Support 7,500
────────────────────
Future Scenarios
A sustained recovery above 7,680 would indicate that buyers are regaining control and could drive price back toward 7,740 and potentially retest the recent highs near 7,800.
However, if price fails to hold above 7,600, selling pressure may accelerate toward 7,500, increasing the probability of a broader corrective phase before the primary uptrend resumes.
────────────────────
Event Risk
The S&P 500 remains highly sensitive to both macroeconomic data and Federal Reserve expectations.
Investors continue to monitor inflation trends, labor market data, Treasury yields, corporate earnings, and developments surrounding artificial intelligence spending across major technology companies. Changes in risk appetite and bond market expectations are likely to remain key drivers of short-term price action.
The next confirmed major macro event is the Federal Reserve meeting on September 15–16, 2026. Any adjustment in interest-rate expectations could influence equity valuations, investor sentiment, and overall market volatility.
Ultimately, price reaction matters more than the headlines. If positive news cannot push the S&P 500 back above 7,680–7,740, upside momentum may continue to fade. Conversely, if negative news fails to break 7,600–7,500, buyers could be preparing for another advance within the broader uptrend.
────────────────────
Please share your view below:
Do you expect the S&P 500 to resume its primary uptrend from current support, or is a deeper correction becoming more likely?
More market structure and key level updates will be shared regularly. DAX Pulls Back Into Support — Will Buyers Step In Again?Market Structure
DAX remains within a broader bullish structure despite the latest pullback. The recent decline appears to be a corrective move after failing to sustain a breakout above the recent highs. Price is now approaching an important support zone where buyers may attempt to regain control. Unless this support breaks decisively, the primary uptrend remains technically intact.
Market Sentiment - Moderately Bullish
Although short-term momentum has weakened following the recent rejection, the broader market structure continues to favor buyers. Market sentiment remains cautiously optimistic while price holds above major support.
Bullish Scenario
If buyers successfully defend the current support area and reclaim 26,150, bullish momentum could gradually return. A move above 26,350 would confirm renewed buying interest and expose the recent swing high near 26,600.
Bearish Scenario
If sellers continue pushing below 25,900, the correction may extend toward the next demand zone around 25,700. A decisive break beneath that level would weaken the broader bullish structure and increase the probability of a deeper retracement.
────────────────────
Market Outlook
The recent decline looks more like profit-taking than a confirmed trend reversal. Buyers are now testing a key demand area, and the next directional move will likely depend on whether this support can generate another higher low. A recovery above nearby resistance would reinforce the broader bullish trend.
────────────────────
Key Levels
First Resistance 26,150
Second Resistance 26,350
First Support 25,900
Second Support 25,700
────────────────────
Future Scenarios
A sustained move above 26,150 would indicate that buyers are regaining control and could drive price back toward 26,350 and potentially 26,600.
However, if price fails to hold above 25,900, selling pressure could accelerate toward 25,700, increasing the risk of a deeper corrective phase before the broader uptrend resumes.
────────────────────
Event Risk
DAX continues to react to both European and global macroeconomic developments.
Traders remain focused on European Central Bank policy expectations, Germany's economic outlook, Eurozone inflation data, corporate earnings, and movements in U.S. equity markets. Broader risk sentiment and bond yields are also likely to influence short-term price action.
The next confirmed major macro event is the Federal Reserve meeting on September 15–16, 2026. Any change in interest-rate expectations could affect global equity markets, including European indices, through shifts in risk appetite and capital flows.
Ultimately, price reaction is more important than the headlines. If positive news cannot lift DAX back above 26,150–26,350, sellers may retain near-term control. Conversely, if negative news fails to break 25,900–25,700, buyers may be preparing for another recovery.
────────────────────
Please share your view below:
Do you expect DAX to rebound from the current support area, or is this correction likely to extend before buyers return?
More market structure and key level updates will be shared regularly. Japan 225 Breaks Support — Is Another Leg Lower Beginning?Market Structure
Japan 225 remains in a short-term bearish structure after failing to establish a sustained recovery. The recent rebound stalled below previous swing highs, and sellers have regained control by pushing price below the recent consolidation range. The sequence of lower highs and lower lows suggests bearish momentum remains dominant unless buyers reclaim key resistance.
Market Sentiment - Moderately Bearish
Market sentiment has weakened as repeated selling pressure continues to limit upside attempts. Buyers are beginning to defend nearby support, but stronger confirmation is still required before a meaningful recovery can develop.
────────────────────
Market Outlook
The broader trend has shifted into a corrective phase following the sharp decline from the August highs. Price is now testing an important demand area where buyers may attempt to stabilize the market. Whether this becomes a temporary bounce or the beginning of a larger recovery will depend on price behavior around nearby resistance.
────────────────────
Key Levels
First Resistance 64,900
Second Resistance 65,600
First Support 64,200
Second Support 63,500
────────────────────
Future Scenarios
Bullish Scenario
If buyers successfully defend 64,200 and reclaim 64,900, bullish momentum could gradually improve and open the way toward 65,600, suggesting that the recent selloff was only a corrective move.
Bearish Scenario
If sellers break below 64,200, downside pressure may accelerate toward 63,500. A decisive break below that level would reinforce the current bearish structure and increase the probability of another leg lower.
────────────────────
Event Risk
Japan 225 remains highly sensitive to both domestic and global macroeconomic developments.
Investors continue to monitor Bank of Japan policy expectations, the U.S. Federal Reserve interest-rate outlook, Treasury yields, USD/JPY movements, global technology stocks, and overall risk sentiment. As many major Japanese exporters benefit from currency weakness, fluctuations in the Japanese yen remain an important driver of index performance.
The next confirmed major macro event is the Federal Reserve meeting on September 15–16, 2026. Any shift in interest-rate expectations could influence global equity markets and Japanese stocks through changes in risk appetite and currency movements.
Ultimately, price reaction matters more than the headlines. If positive news cannot lift Japan 225 back above 64,900–65,600, sellers are likely to remain in control. Conversely, if negative news fails to break 64,200–63,500, the market may begin forming a stronger base for recovery.
────────────────────
Please share your view below:
Do you expect Japan 225 to recover above 64,900 and regain bullish momentum, or will sellers extend the correction toward lower support?
More market structure and key level updates will be shared regularly. Nasdaq 100 — Can Buyers Prevent a Deeper Pullback?Market Structure
The Nasdaq 100 remains in a broad consolidation after failing to sustain its recent recovery. Price continues to trade below the major swing high and is forming lower highs in the short term, indicating that bullish momentum has weakened. However, the index is approaching an important demand zone where buyers may attempt to stabilize the market before another directional move develops.
Market Sentiment - Neutral to Slightly Bearish
Market sentiment has become more cautious as buyers lose momentum near resistance. Sellers currently have a slight short-term advantage, although no confirmed medium-term bearish trend has emerged yet.
Bullish Scenario
If buyers successfully defend the first support and reclaim the first resistance, the current pullback could develop into a higher low, opening the way toward the second resistance and restoring bullish momentum.
Bearish Scenario
If price breaks below the first support, selling pressure may accelerate toward the second support. A decisive breakdown would increase the probability of a broader corrective phase.
────────────────────
Market Outlook
The Nasdaq 100 is currently correcting within a broader range rather than establishing a confirmed downtrend. The next meaningful move will likely depend on whether buyers can defend support and regain control above nearby resistance.
────────────────────
Key Levels
First Resistance 29,500
Second Resistance 30,350
First Support 29,000
Second Support 28,500
────────────────────
Future Scenarios
A sustained break above 29,500 would suggest buyers are regaining control and could trigger a move toward 30,350, reinforcing the broader recovery structure.
However, if price falls below 29,000, downside momentum may strengthen toward 28,500, increasing the likelihood of a deeper correction.
────────────────────
Event Risk
The Nasdaq 100 remains highly sensitive to macroeconomic data and Federal Reserve policy expectations.
Investors continue to monitor inflation reports, labor-market data, Treasury yields, corporate earnings, AI-related investment trends, and guidance from major technology companies. Because the index has a heavy concentration of large-cap technology stocks, earnings and forward guidance from leading AI companies remain important market catalysts.
The next confirmed major macro event is the Federal Reserve meeting on September 15–16, 2026. Any change in interest-rate expectations could significantly affect equity valuations and overall risk sentiment.
Ultimately, market reaction matters more than the headlines themselves. If positive news cannot push the Nasdaq 100 above 29,500–30,350, bullish expectations may already be priced in. Conversely, if negative news fails to break 29,000–28,500, buyers may continue defending the broader consolidation structure.
────────────────────
Please share your view below:
Do you expect the Nasdaq 100 to reclaim 30,350 and resume its broader recovery, or will sellers extend the current correction toward lower support?
More market structure and key level updates will be shared regularly.  Short
Short
 Long
Long
 Short
Short
 Long
Long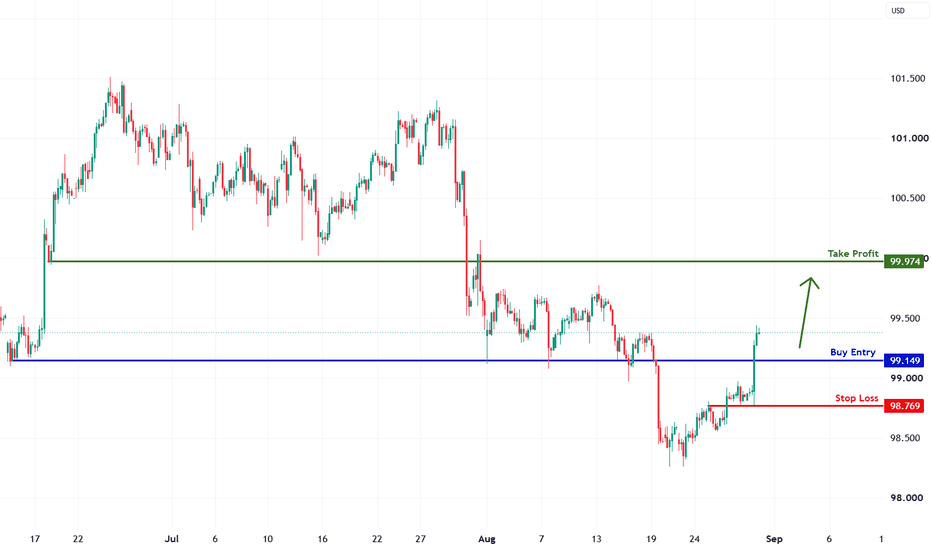
Short 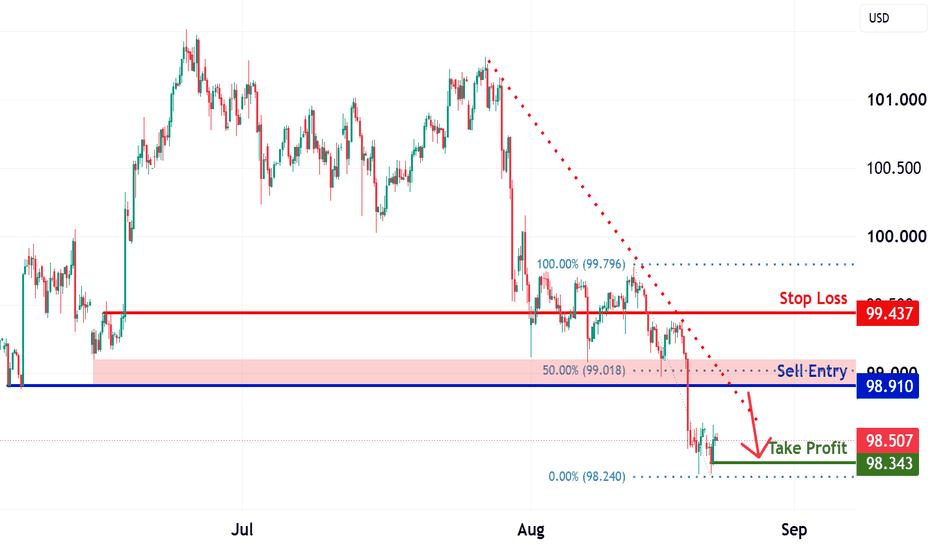
Bearish drop off?S&P500 (US500) is reacting off the pivot and could reverse towards the 1st support, which has been identified as a pullback suport.
Pivot: 7,644.68
1st Support: 7,575.55
1st Resistance: 7,727.80
Disclaimer:
The opinions given above constitute general market commentary and do not constitute the opinion or advice of IC Markets or any form of personal or investment advice.
Any opinions, news, research, analyses, prices, other information, or links to third-party sites contained on this website are provided on an "as-is" basis, are intended to be informative only, and are not advice, a recommendation, research, a record of our trading prices, an offer of, or solicitation for, a transaction in any financial instrument and thus should not be treated as such. The information provided does not involve any specific investment objectives, financial situation, or needs of any specific person who may receive it. Please be aware that past performance is not a reliable indicator of future performance and/or results. Past performance or forward-looking scenarios based upon the reasonable beliefs of the third-party provider are not a guarantee of future performance. Actual results may differ materially from those anticipated in forward-looking or past performance statements. IC Markets makes no representation or warranty and assumes no liability as to the accuracy or completeness of the information provided, nor any loss arising from any investment based on a recommendation, forecast, or any information supplied by any third party.  Short
Short
Bullish bounce in play?US Dollar Index (DXY) has bounced off the pivot and could potentially rise towards the 1st resistance, which is an overlap resistance that aligns with the 78.6% Fibonacci projection.
Pivot: 99.44
1st Support: 99.10
1st Resistance: 100.22
Disclaimer:
The opinions given above constitute general market commentary and do not constitute the opinion or advice of IC Markets or any form of personal or investment advice.
Any opinions, news, research, analyses, prices, other information, or links to third-party sites contained on this website are provided on an "as-is" basis, are intended to be informative only, and are not advice, a recommendation, research, a record of our trading prices, an offer of, or solicitation for, a transaction in any financial instrument and thus should not be treated as such. The information provided does not involve any specific investment objectives, financial situation, or needs of any specific person who may receive it. Please be aware that past performance is not a reliable indicator of future performance and/or results. Past performance or forward-looking scenarios based upon the reasonable beliefs of the third-party provider are not a guarantee of future performance. Actual results may differ materially from those anticipated in forward-looking or past performance statements. IC Markets makes no representation or warranty and assumes no liability as to the accuracy or completeness of the information provided, nor any loss arising from any investment based on a recommendation, forecast, or any information supplied by any third party. Long 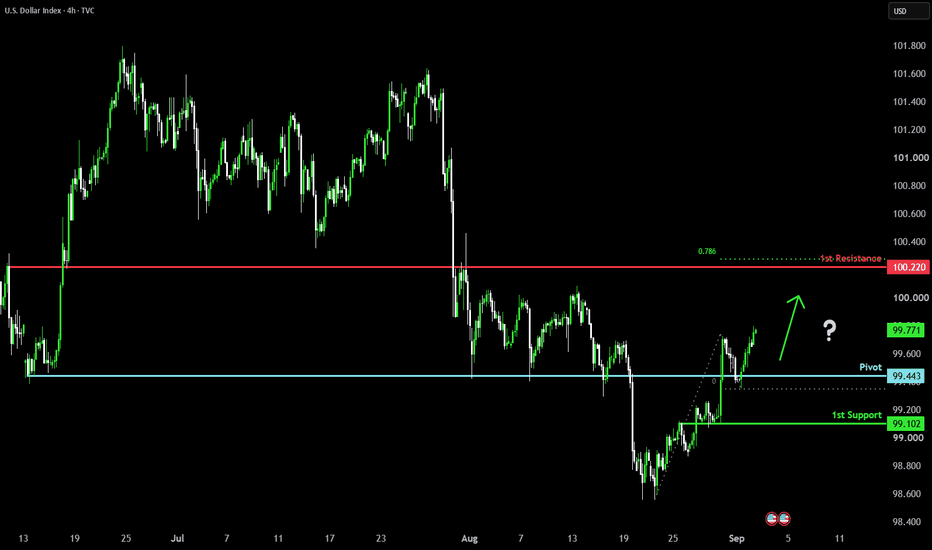
Long 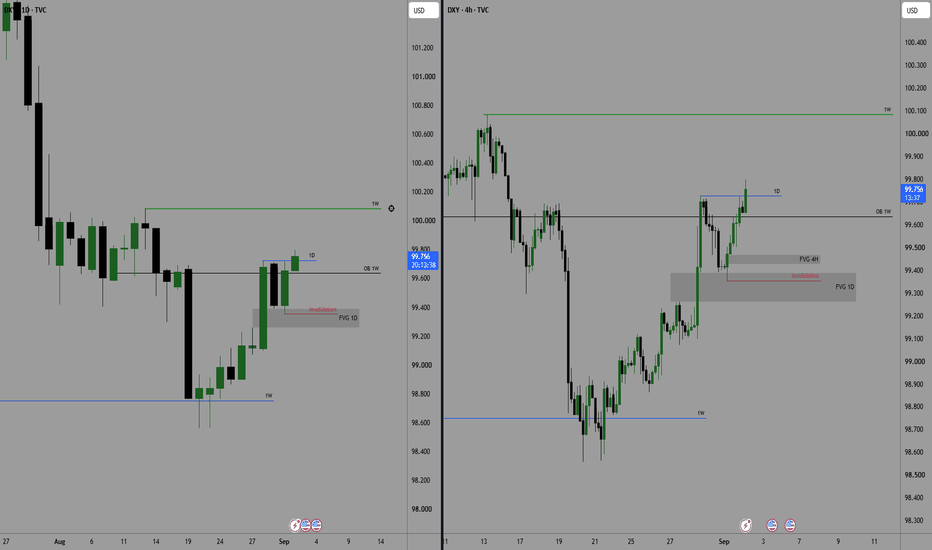
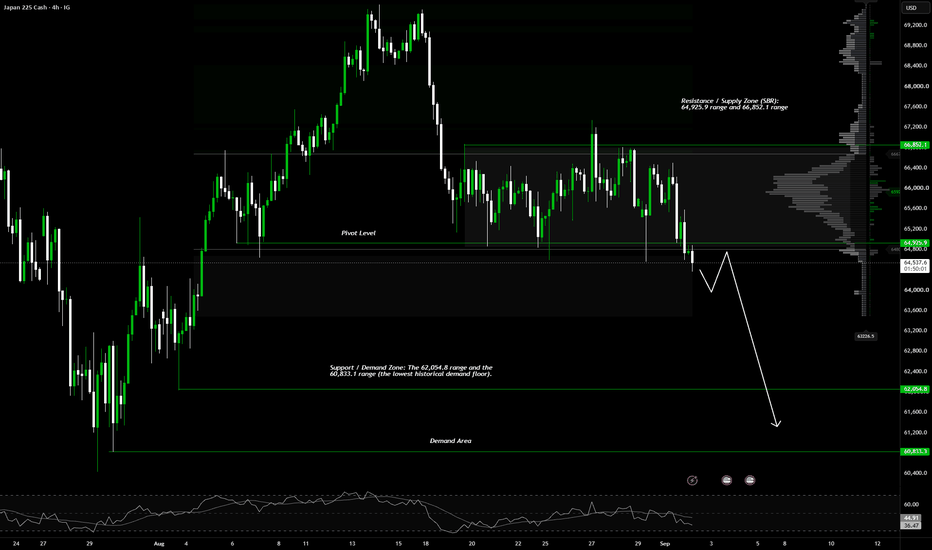
Japanese Stocks Fall Amid Rising Bond Yields and Oil PricesIG:NIKKEI
The benchmark Nikkei 225 index tumbled 2.5%, dropping below the 64,600 mark (hitting a four-week low), while the broader Topix index fell 1.6% to 4,115. This snapped a period of gains as the market faced two major headwinds: a surge in domestic and global bond yields and escalating oil prices.
Japanese Bond Yields (10-Yr JGB) Hit 3.0% & BOJ Rate Hike Expectations
The primary catalyst driving the equity valuation adjustment originated in Tokyo's debt market:
- ⚡Bond Market Milestone: The yield on the 10-year Japanese Government Bond (10-Yr JGB) officially hit 3.0%—its highest level since 1996—after investors acknowledged the Bank of Japan's (BOJ) move toward monetary policy normalization.
- ⚡BOJ Rate Hike Expectations: Speculation regarding a BOJ rate hike this September triggered a massive de-risking move away from high-multiple equities (such as high P/E tech stocks), as the discount rate applied to future cash flow valuations surged.
---------------------------------------------------------------------------------------------------------------
✅ Crude Oil Rallies for 3 Consecutive Sessions Following US-Iran Conflict in Hormuz
- Escalating Energy Conflict: Air and naval clashes between the US and Iran in the Persian Gulf kept Brent crude prices firmly above $96 per barrel, driving the energy risk premium to its highest level of the third quarter of 2026.
- Import-Driven Inflationary Pressure: For net energy-importing nations like Japan, a surge in crude oil prices—coupled with rising bond yields—creates a "double squeeze" on the net profit margins of the manufacturing sector.
---------------------------------------------------------------------------------------------------------------
✅ Price Action Analysis (H4 Timeframe)
The H4 structure confirms the continuation of the Bearish Expansion phase. After stalling within a consolidation range (indicated by the middle gray box), the latest H4 candle decisively dropped, executing a Break of Structure (BOS) by breaching the green Pivot Level line at 64,925.9.
At the 64,647.2 price level, the H4 candle movement demonstrates total dominance by the sellers (bearish momentum).
The candle has closed below the 64,925.9 SBR horizontal line and is beginning to penetrate the lower gray box (historical Demand Zone). There are currently no signs of valid bullish rejection on the active candle.
---------------------------------------------------------------------------------------------------------------
✅ Key Zones:
- ⚡Resistance / Supply Zone (SBR): The 64,925.9 range (the green horizontal line that has now officially become the primary Support-Become-Resistance/SBR level) and the 66,852.1 range (the upper boundary of the previous consolidation resistance).
- ⚡Support / Demand Zone: The 62,054.8 range (the next green Major Demand Zone line) and the 60,833.1 range (the lowest historical Demand floor).  Short
Short