Short
Short
 Short
Short
FTATPU , Asia Technology Cycle Structure IdeaFTATPU tracks a concentrated basket of major Asian technology companies across China, Hong Kong, Taiwan, Japan, Singapore and South Korea.
Its composition makes it more than just another regional index. It provides exposure to several interconnected parts of the global technology supply chain: semiconductors, memory, semiconductor equipment, electronics, hardware and digital platforms.
That creates several potential cross-market transmission mechanisms.
A sustained expansion in FTATPU can transmit through the semiconductor complex first. Strength in Taiwan and South Korea can feed into foundries, memory manufacturers and semiconductor equipment companies in Japan and elsewhere in Asia.
From there, the transmission can move into global technology indices through companies with shared supply chains, overlapping capital flows and similar risk characteristics.
The second mechanism is capital rotation. If investors increase exposure to Asian technology, the effect does not necessarily remain inside FTATPU. Capital can rotate into US semiconductor and AI infrastructure names, European technology suppliers and other high-beta segments of the global equity market.
The third is risk appetite. FTATPU contains a substantial amount of cyclical and high-beta technology exposure. A sustained breakdown can therefore become an early indication of weakening risk appetite across growth equities, while a successful cycle expansion can reinforce broader risk-on positioning.
The fourth mechanism is the semiconductor cycle itself.
Taiwan and South Korea sit at critical points in global chip production and memory. Japan provides important equipment and technology inputs. China adds enormous downstream electronics and technology demand. A synchronized cycle across these markets can therefore have consequences well beyond the index.
This is why I am watching the current structure closely.
The chart currently offers four possible paths. Each represents a different sequence of retracement, liquidity collection and cycle expansion.
The 3,400–4,000 area is the key structural zone.
A successful recovery would keep the expansion scenario alive and potentially open the way toward 4,700–5,000.
A failure of the structure could instead trigger a deeper liquidity search toward the 2,400–2,500 area.
The important question is therefore not simply where FTATPU goes.
It is whether the move confirms or contradicts the broader technology and risk cycle across the markets connected to it.
Four paths are mapped.
The cycle will decide which one survives.
Follow, Boost, Join, Thank You!
Financial Disclaimer: This post is not financial advice. I am not your financial advisor, your life coach, or your legally responsible adult. Always do your own research and never trade based solely on internet content. Long 
DOW JONES 100 years of tech expansions. Investing's Holy Grail.This is not the first time we've drawn this century-long analysis on Dow Jones (DJIA). In fact most recently (4 months ago, May 05, see chart below) we applied it on the S&P500 (SPX) by making the distinct addition of the different technological eras that were the driving forces behind each market Cycle, something that even caught the attention of legendary trader Peter Brandt who posted it on his X:
This time we make the addition of the 0.236 Fibonacci retracement, where the 2000s Bear Cycle bottomed, and close to the 1966 - 1974. At the same time, we pinpoint where the market currently may be (orange ellipse pattern) relative to the previous two Bull Cycles, which is within the 0.618 - 0.786 Time Fibonacci levels, i.e. close to entering the final third of the Cycle.
Everything else is virtually the same. Refreshing our memory doesn't hurt:
** The 100-year Blueprint **
The bigger picture is that for the past 100 years, the stock market has been repeating the same macro Cycles. This is the 'blueprint' that proves it. Starting from 1930 and the Great Depression, DJI has experienced three Bear Cycles and three subsequent Bull Cycles. We are currently on the 3rd Bull Cycle.
** The Bear Cycles **
The distinct characteristic of the Bear Cycles have been a Two Top and Two Bottom pattern. The Great Depression (1930-1941) was far more volatile, aggressive and on great width but the two that followed (1966-1974 and 2000-2009) where far more structured. They were both roughly 9-years long and both bottomed on the 1M MA300 (red trend-line) and kickstarted their respective Bull Cycles. The Great Depression was roughly 12 years long.
** The Bull Cycles **
The Bull Cycles, the first two in particular which are completed and not ongoing like the current one, have been 24 and 25 years respectively and their distinct characteristic has been that once they recovered their 1M MA100 (green trend-line) during their early stages, it never broke until well within the next Bear Cycle. The 1W MA100 (blue trend-line) on the other hand, was used 'often' as the Cycle's first (and most frequent) Support, providing the most optimal buy opportunities every time the price tested it. The 1M MA100 acted as the 2nd and last level.
** The Technological Eras **
As mentioned, the technological eras on each Bull Cycle is what drove the economy forward and made stock markets rise that aggressively, especially in their second parts. Eventually the Bubbles popped and the subsequent Bear Cycles came as corrections to the overvaluations and hysteria but that doesn't mean that the underlying cause of the Booms was gone. They were established in the economy, amplified it or even created a new, even richer parallel one. The strongest example of which has been the Internet Boom, which even though it ended abruptly and with force (it had too as post 1995 mania was out of control), it was established as the backbone of the new economy that gave way to the E-commerce Boom with smartphones and social media of the current Bull Cycle we are in.
** The A.I. Boom **
So that brings us to the 2nd part of the current Bull Cycle, which is being guided by the A.I. Boom. Just like the previous eras, the way for the A.I. Boom was paved by the technological breakthroughs before it that we mentioned. And just like the Internet Boom, the Bubble is expected to burst around 2034, correcting the massive overvaluations that are currently being built but during that next Bear Cycle it will create the backbone of the new economy centered around A.I. agents etc.
As you realize these past 100 years have been a chain of technological breakthroughs and advancements that each forms the basis for the next and serve as boost mechanisms to push the inflationary stock market higher and higher to overvaluations. That is the essence of it. Nothing more. And the Bear Cycles simply serve as the neutralizer that brings the hype back to 'normal', resetting the stage for new capital and inflows towards the next technology.
** So what now? **
What does all this mean for the market now, today? As mentioned, we are between the 0.618 - 0.786 Time Fibonacci levels (orange ellipse) about to enter the final 1/3 of the current Bull Cycle. If it follows the exact pattern of the previous Bull Cycle, then a +2335 total rise from the 2009 bottom would target 150000. High and crazy as it may seem, that's the technical Target based on this 100-year Model. Even the first Bull Cycle was of similar % rise (+2530%).
That doesn't mean however that there won't be technical corrections until then. As mentioned, the index frequently corrects back to the 1W MA100. The last time it touched it was on the April 2025 bottom of the U.S. - China Trade War. Even the post 1995 hysteria of the Dotcom Bubble saw multiple correction towards it. As a result, every correction on the 1W MA100 or even better the 1M MA100 (much less likely a this stage), is a 'must' buy opportunity.
To conclude this, take a look at the 1M RSI. Every time it turns oversold (at or below 30.00), it gives a generational buy opportunity. In the past 100 years that has happened only 6 times. And those align perfectly with the Bear Cycles Lows.
---
** Please LIKE 👍, FOLLOW ✅, SHARE 🙌 and COMMENT ✍ if you enjoy this idea! Also share your ideas and charts in the comments section below! This is best way to keep it relevant, support us, keep the content here free and allow the idea to reach as many people as possible. **
---
💸💸💸💸💸💸
👇 👇 👇 👇 👇 👇 Short 
 Short
Short
DXY short and EURUSD UpdatesAction Items
- Hold the EURUSD long until market structure breaks; if it breaks, wait for a correction and look for shorts
- Watch Thursday's and Friday's Euro and USD news as the catalyst that's ultimately going to determine the direction
Context & Disclaimer
Just to be clear upfront — I don't sell courses or signals, and I'm not a guru. My trading income comes entirely from trading. This is my personal trade journal, and I started sharing it because friends and family kept asking how I do this. I figured if I'm going to explain it anyway, I might as well post it publicly in case it helps others with their own trading education. Nothing here is investment advice — trading is risky and you can lose money. Follow along if you find it useful, and I genuinely hope it does.
Journaling Context
- First journal entry since before Labor Day — worked the whole weekend and leading up to it
- Method: I leave notes whenever I can to capture what's being done
DXY Downtrend Analysis
- Downtrend call: Posted August 31 — buyers held a level three times, then the break showed sellers stepping in and the downtrend continuing
- Entry: Waited for the pullback into the prior accumulation zone, marked a one-day bearish continuation, and waited for the continuation
- Targeting: Targets are areas price has already demonstrated — sellers showed they can come down to 98.539
- DXY's role: I don't trade DXY (CFD only) — I use it to make decisions on other assets
- Current state: Downtrend still in play; the market is moving really, really slow while waiting on news
EURUSD Trade & Decoupling
- Position: Exited Friday at breakeven, re-entered yesterday, and the trade is now positive
- Why out: DXY moved while EURUSD didn't — the correlation decoupled, and I didn't want a Sunday gap-down while working
- Why in: The daily uptrend is intact — price returned to the accumulation level and is looking to attack the next seller level
- Correlation rule: DXY short → long EURUSD; DXY long → short EURUSD — not one-to-one, but a correlation
- Stop-loss rule: The stop always sits behind the higher-timeframe market structure break
- Self-debate: The case to hold was right there — just look at the one day, just hold on to that and let this thing ride out
- Verdict: Exited because Labor Day work left no time to monitor; saving my capital was the right call
Trend Anatomy — Trends Tend to Die Slowly
- An uptrend from May 8 started dying June 25 — a full month of decline before the low
- First bear sign: Failure to make a higher high; the lower low that followed it was huge
- Swing rule: I require three or more daily candles for a swing — two-candle highs aren't trusted
- Sequence: Swing high/low pairs, a correction that respected the high, then structure broke and the move continued  Long
Long

Long 
 Long
Long
US Labor Day|10800 10787 support | 10859 10895 10920 resistanceIt's been a patchy start to the week with tech leading Asian shares higher, while European and Wall Street futures barely budge. Semiconductor makers' stocks drove the Nikkei up 2% or so, while South Korea's Kospi climbed around 3% to 6,900.
We start the week with a mixed but increasingly inflation-sensitive backdrop. Friday's US payroll report was considerably stronger than expected. That pushed Treasury yields higher, increased expectations of a September Fed hike and knocked the S&P 500 down 0.38%, with the Nasdaq losing 0.29%.
But equities aren't collapsing. Asian technology shares are actually rallying this morning because investors are also interpreting the strong jobs report as evidence that the US economy remains healthy. The next major test is now US inflation data later this week, which could decide whether the Fed actually raises rates.
The bigger immediate concern is oil. Brent has climbed to around $97.07 after further US-Iran attacks on vessels in and around the Strait of Hormuz. On the flip side the higher price helps the FTSE100 owing to BP and Shell....
Initially we have a bullish 2h chart with the 10800 looking like it may hold any initial test, with the Hull MA here along with the 30m 200ema. The price is just below the 10823 daily pivot (and in fact the key level from last week) so the bulls will be keen to get the price price back above that if they can.
If the bears were to break 10800 today then 10780 is the green 2h coral, but the daily support level at 10689 does come back into play as well. Might be a big ask to slide that low given oil's strength so 10787 S1 and possibly 10751 S2 are more likely to hold any tests.
I am thinking that we will get an attempt at a bull Monday, at least initially, and then profit taking and a dip later on - with the US closed today for Labor day then the FTSE100 may well be more subdued anyway,
If the bulls do fight back then a rise towards to 10860 R1 level looks likely, and a possible test of the 10922 daily level - if 10895 R2 were to break. These 3 levels are the main ones I am looking at for resistance and shorts. A rise and dip would play out well today and fit the charts well. Short 
NASDAQ 100 ($NDX) 4H: Price Action CompressesNASDAQ 100 ( NASDAQ:NDX ) 4H: Price Action Compresses Near 29.7k Range Highs Supported by Dynamic 200-EMA Anchor
### 🇺🇸 US Tech 100 Cash ( NASDAQ:NDX / NASDAQ 100) 4-Hour (4H) Technical Matrix (Ref: NASDAQ_2026-09-09_09-05-33.png)
We are issuing an intraday 4-Hour (4H) structural update for the US Tech 100 Index ( NASDAQ:NDX ). Price action continues to navigate within a well-defined multi-week horizontal consolidation channel (purple range box), currently compressing near the upper boundary while holding firm acceptance above core exponential moving average anchors.
The index is trading slightly higher at **29,581.3 (+0.09%)**, positioning above both fast and institutional trend guides on low tick volume (**8.82K**).
---
### 🔍 Technical Architecture & Range Parameters:
Our quantitative 4H framework maps out the core horizontal bounds and dynamic guides governing this neutral-to-bullish accumulation phase:
1. **Horizontal Consolidation Range Bounds (Purple Box):**
* **Range Resistance Ceiling:** **29,751.3** — Primary overhead boundary under immediate test.
* **Range Demand Floor:** **28,912.6** — Major swing low floor defining the bottom of the structure.
2. **Dynamic Moving Average Support Anchors:**
* **17-Period 4H EMA (Red Line):** **29,534.7** — Fast trailing dynamic support guiding the current leg higher.
* **200-Period 4H EMA (Purple Line):** **29,351.2** — Institutional baseline functioning as the inner dynamic pivot floor.
3. **Macro Overhead Expansion Ceiling:**
* **Major Structural Target:** **30,227.9** — Primary macro horizontal resistance ceiling sitting right along the upper descending channel boundary.
---
### 🛡️ Strategic Operational Scenarios:
* **Scenario A — Range Breakout Expansion Above 29,751:** A decisive 4H candle close above **29,751.3** breaks the purple consolidation structure, unlocking rapid momentum expansion toward the **30,227.9** macro ceiling.
* **Scenario B — Intra-Range Rotation & Retest:** Failure to clear **29,751.3** keeps price action bound within the range, with pullbacks expected to find initial bid support at **29,534.7 (17-EMA)** and **29,351.2 (200-EMA)** before any potential retest of the **28,912.6** floor.
### 📊 Tactical Parameters Summary:
* **Current Bias:** Neutral Consolidation / Testing Range Resistance
* **Horizontal Range Resistance:** 29,751.3
* **Macro Expansion Ceiling:** 30,227.9
* **Dynamic Support Guides (17-EMA / 200-EMA):** 29,534.7 / 29,351.2
* **Horizontal Range Floor:** 28,912.6
---
📊 **ChartPro Data**
*US Tech Intraday Architecture, Range Boundaries & Systematic Risk Management.*
⚠️ **Disclaimer:** For educational and informational purposes only. This active market study represents a personal trading framework and does not constitute financial or investment advice. NAS100 - Intraday OutlookNAS100 — Intraday Outlook
NAS100 remains bullish on the higher timeframes, with H4, H1 and M15 still supporting the upside.
At the moment, price is trading between clear liquidity zones, so I’m not interested in chasing longs from the middle of the range. The cleaner scenario would be a move lower toward PDL / yesterday’s low around 29,390–29,400, taking sell-side liquidity into the H1/M30 demand area.
What I want to see is a liquidity sweep below PDL followed by a quick reclaim, then bullish M5/M15 structure confirmation and displacement.
If buyers confirm from that area, the first upside objective is the 29,600 area, followed by PDH / 29,690–29,730.
No confirmation = no trade.
I’m waiting for price to come to the location instead of chasing it.
NAS100 #Trading SMC #ICT #PriceAction #DayTrading #Liquidity #TranquilaSMC
NAS100 — Intraday pregled
NAS100 i dalje ima bullish HTF kontekst, jer H4, H1 i M15 trenutno podržavaju nastavak kretanja naviše.
Cena se sada nalazi između jasnih zona likvidnosti i ne želim da jurim long iz sredine range-a. Čistiji scenario bi bio spuštanje prema PDL-u / jučerašnjem low-u oko 29.390–29.400, uz skidanje sell-side likvidnosti unutar H1/M30 demand zone.
Ono što želim da vidim jeste sweep ispod PDL-a i brz povratak iznad njega, a zatim bullish M5/M15 potvrdu strukture i displacement.
Ako kupci potvrde reakciju iz te zone, prvi target area je oko 29.600, a zatim PDH / 29.690–29.730.
Bez potvrde nema trejda.
Čekamo da cena dođe nama, ne jurimo cenu. Long 
Long 
Long 
SPX: The Index Is Calm. The Market Underneath Is Not.SPX is still consolidating near record highs, but the market’s internal strength has weakened sharply.
Breadth has fallen toward 42%: fewer than half of S&P 500 stocks are trading above their 50-day moving average. The crowd sees a stable index and assumes the whole market is strong. But a cap-weighted index can stay afloat while many individual stocks quietly lose momentum.
That does not make the rally fake. It makes it narrower — and less forgiving.
🌊 What Stirred the Pond?
September gives traders an easy story: weakness now, then a strong fourth quarter and an election-related rally.
There is historical support for a weaker second half of September, while post-midterm periods have often been more constructive. But history is context, not confirmation.
The psychological risk is that too many traders now expect the same path:
September dip → policy support → election rally → strong Q4.
When everyone expects the same outcome, they start buying the narrative before price confirms it. That is how a bullish idea becomes a crowded FOMO trade.
Trump’s confidence in higher stock prices may lift sentiment. But confidence does not repair breadth. Only participation does.
📉 Footprints on the Chart
SPX trades near 7,673, below both short-term averages around 7,684–7,692. MACD has turned negative and is still falling, which confirms that short-term momentum is weakening.
Price is still above 7,640, so this is not a confirmed breakdown yet. But buyers now need to respond quickly.
🧭 Risk Map
Bullish confirmation:
SPX must reclaim 7,684–7,692 and hold above it. That would show sellers failed to turn the pullback into a broader decline. The next upside area is 7,816.
Bearish scenario:
A sustained loss of 7,640 would confirm the short-term breakdown and expose 7,611 first. If breadth keeps deteriorating, a deeper correction becomes more likely.
The crowd sees consolidation near highs.
Momentum is asking whether buyers still have control.
⚠️ Risk
The emotional mistake is to short SPX simply because September is historically weak.
The opposite mistake is buying every dip because a strong Q4 or a “pre-election pump” feels inevitable.
Both are crowded narratives.
The crowd watches the headline index.
The tape shows who is actually carrying it.
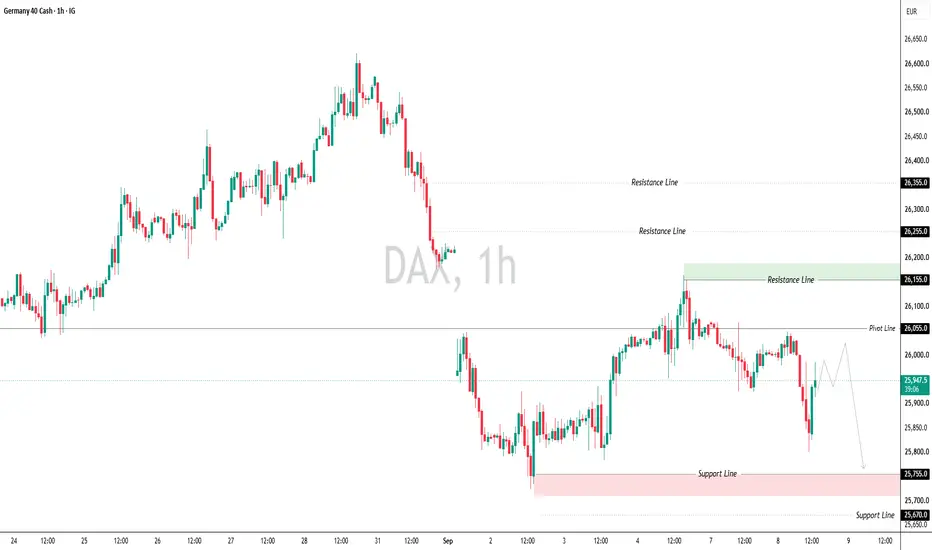
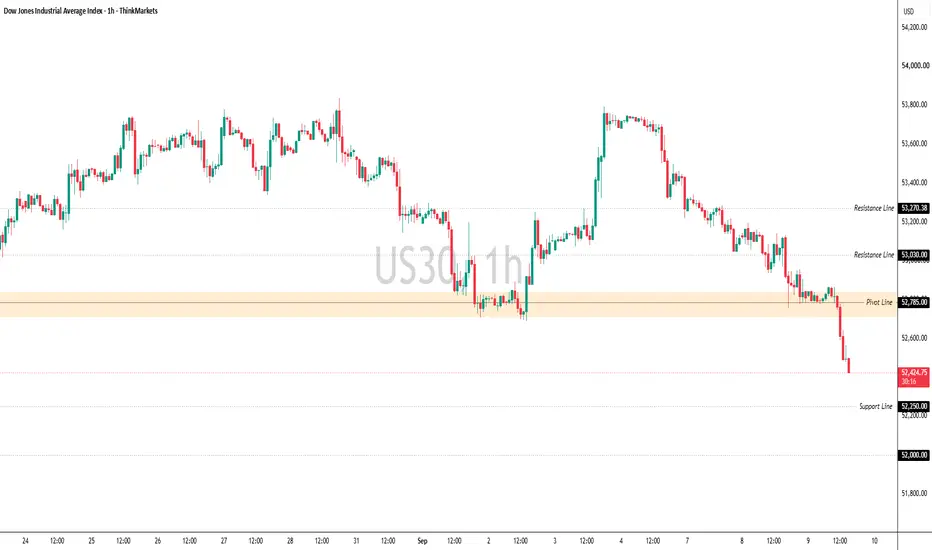
Personal market commentary, not financial advice. DAX W37 — weakness is here, confirmation is notThe DAX has started to show something that was largely absent during the previous advance: repeated selling into strength. The Dow is showing a similar behaviour, while the Nasdaq continues to hold up remarkably well.
That divergence is the main reason why I am not treating the current move as a confirmed broad risk-off event yet. There is clear weakness in parts of the market, but the strongest US growth segment has not joined the move in a meaningful way.
The bearish case does not require an immediate crash from here. A controlled grind lower would be enough. The more important question is whether the current weakness remains concentrated in DAX and Dow, or whether the parts of the market that are still absorbing almost every dip eventually begin to participate.
THE STRUCTURE
The important change in DAX is not simply that price moved lower. What matters more is the response whenever buyers attempt to push it back up.
Dips are still finding demand, sometimes aggressively. So far, however, higher prices continue to attract supply. As long as those rebounds fail below previous highs and the market continues to produce lower lows, the result can be a substantial correction without ever producing the type of vertical selling normally associated with a crash.
This is why I am separating a simple break of support from actual acceptance below support. A short-lived move through a previous low can simply be a liquidity sweep. Stops are triggered, late sellers enter and price immediately reclaims the level. That is very different from a break where the subsequent rebound fails, price begins spending time below the old support and another lower low follows.
The Volume Profile and VWAP references in the chart are useful for exactly this reason. I am less interested in an isolated wick through a reference than in whether the market starts building value below it. If that happens, the evidence for a genuine repricing becomes considerably stronger.
THE PATH BELOW
My first area of interest remains around 25,500. A move into that region would not require a crash or even a particularly unusual market environment. It would simply represent continuation of the correction that is already developing.
Below that, the area around 24,500 becomes much more interesting. This also lines up with the broader retracement idea from the war-driven recovery and would represent a meaningful correction of that move. Even there, however, I would still distinguish between a large correction and a genuine bear market.
If weakness broadens across indices, the 23,000–24,000 region becomes a reasonable next area to evaluate. By that stage I would expect considerably more confirmation from US equities and the credit market than we currently have.
In other words, 25,500 and roughly 24,500 do not require a systemic event. The deeper the market moves beyond those areas, the more important it becomes that the weakness is confirmed outside DAX itself.
THE DOW IS ALREADY CONFIRMING
The Dow currently provides the cleaner confirmation of what is happening in DAX. It has shown substantially more downside pressure than US technology, and attempts to recover continue to attract sellers.
What makes the structure interesting is that dip buyers have not disappeared. Quite the opposite: some of the intraday sell-offs are still bought aggressively. The problem for buyers is that the resulting rallies are then met by even stronger selling.
That creates a market which can look resilient intraday while still migrating lower over several sessions. A sequence of lower lows, aggressive rebounds and subsequent lower highs can be much more persistent than a single panic session.
For the bearish interpretation to remain intact, sellers ultimately need to continue producing downside progress. If repeated attempts to make new lows begin failing, while rebounds start reclaiming levels that previously acted as resistance, the interpretation changes. At that point the market may be absorbing supply rather than simply pausing before another leg lower.
THE MISSING CONFIRMATION
Nasdaq remains the most important problem with the broader bearish thesis.
While DAX and Dow have weakened, NQ has spent much of the recent period inside a relatively tight structure and continues to attract aggressive buyers whenever price is pushed lower. That relative strength is especially notable considering the combination of elevated Treasury yields, high oil prices and the broader geopolitical backdrop.
There are two reasonable ways to interpret this divergence. The first is genuine relative strength: AI and semiconductor leadership remains fundamentally strong enough to absorb the macro pressure, and eventually that strength could help pull the broader market higher again.
The second possibility is that this is simply where capital is hiding while weaker parts of the market are already being distributed. In that case, the broader bearish move would only become visible once the strongest segment finally stops absorbing every dip.
I do not think it is necessary to predict which interpretation is correct. The price action should eventually answer it.
A clean break of the current NQ structure would become much more meaningful if the first rebound then fails, the broken area cannot be reclaimed and price starts accepting below the range. If NQ begins behaving the way DAX and Dow already are, the character of the entire correction changes.
Until that happens, Nasdaq strength remains a legitimate warning against extrapolating weakness in DAX and Dow into a market-wide liquidation event.
THE OIL PROBLEM
Brent is once again trading around the psychologically important $100 region, which creates a particularly uncomfortable backdrop for European equities.
For Europe, persistently expensive energy is not simply an inflation story. It can simultaneously increase input costs, pressure corporate margins, weaken consumer purchasing power and make the path toward easier monetary policy more difficult. The DAX therefore has a more direct sensitivity to this particular macro mix than a technology-heavy US index.
But once again, I think the reaction matters more than the headline itself.
If Brent continues higher and DAX eventually stops responding with new lows, that would tell us that the market is beginning to absorb increasingly negative information. Conversely, if Brent retreats and removes some of the immediate inflation pressure but DAX still cannot produce a sustainable rally, that would be a much stronger indication of underlying weakness.
A market falling on bad news is expected. A market continuing to fall when the news becomes less bad is much more informative.
THE YIELD PROBLEM
The US 10-year yield remains around the 4.8% area, putting the 5% region back into focus.
I do not view 5% as some automatic breaking point for equities. What matters is whether high risk-free yields remain an isolated valuation problem or begin feeding into broader financing stress.
Higher Treasury yields raise discount rates, increase the hurdle rate for investment and provide investors with an increasingly attractive alternative to equities. Companies can still function in that environment, particularly those with strong balance sheets and substantial cash generation.
The situation becomes more problematic if high Treasury yields are accompanied by widening corporate credit spreads. In that case, the risk-free financing base is becoming more expensive at the same time that investors demand additional compensation for corporate risk.
That is why the combination I am watching is not simply 10Y at 5%. It is high Treasury yields, widening credit spreads and a loss of relative strength in Nasdaq. If those three begin occurring together, what currently looks like a valuation and macro problem could start developing into a financing and deleveraging problem.
We are not there yet.
WHAT WOULD CONFIRM THE BEAR CASE
For the current correction to develop into something materially larger, I want to see several markets gradually begin telling the same story.
DAX and Dow would need to continue accepting lower prices rather than merely sweeping lows and reclaiming them. Nasdaq would need to lose the relative strength that has protected the broader US market. Credit spreads would need to begin widening enough to indicate that investors are demanding a materially larger risk premium, while elevated oil prices and Treasury yields continue to constrain the macro backdrop.
The reaction to incoming information will be just as important.
If negative economic or geopolitical news arrives and equities refuse to fall, that would be evidence that a substantial amount of bearish information has already been discounted. If, on the other hand, neutral or even supportive developments fail to generate sustainable rallies, the underlying weakness would become much harder to dismiss.
That distinction matters more to me than trying to forecast the next headline.
WHAT WOULD INVALIDATE IT
The bearish thesis does not fail because of one large green candle, just as it is not confirmed by one large red candle.
What would concern me is a persistent inability to accept lower prices. If DAX or Dow break another low, immediately reclaim it, establish a higher low and then recover the areas from which previous rallies were sold, the market structure would be changing.
The same principle applies to overnight sessions. An Asian market taking out a US low is not automatically confirmation of further downside. Some of the strongest reversals begin with exactly that sequence: the previous low is swept, stops are triggered, sellers fail to generate continuation and price aggressively reclaims the level.
For that reason I am focused less on whether a level trades once and more on what happens after it trades. Acceptance below support confirms weakness. Failure to accept below it can become a bullish signal.
THE LIMITS
There is still not enough evidence to call the current environment a systemic risk event.
Nasdaq remains relatively resilient, AI and semiconductor leadership continues to attract capital, and the credit market has not yet provided the type of confirmation I would expect during genuine deleveraging. Elevated oil prices and Treasury yields create a difficult backdrop, but neither is sufficient on its own to establish a bear-market thesis.
That leaves the current setup in an interesting middle ground.
DAX and Dow are already showing that sellers are willing to defend higher prices. Nasdaq is still showing that buyers are willing to defend lower prices.
Eventually one side of that divergence should fail.
If DAX and Dow begin recovering toward the stronger US indices, the current correction may simply have done its job. If Nasdaq instead loses its ability to absorb dips and starts accepting lower prices alongside DAX and Dow, the downside scenario becomes considerably more interesting.
Until then, I am not trying to predict a crash.
I am watching which side loses control first: the dip buyers or the rally sellers.
Not financial advice. This is my own market analysis and risk framework. Short 
Bullish bounce at key support?USTEC is falling towards the pivot which has been identified as an overlap support and could bounce towards the pullback resistance.
Pivot: 29,170.74
1st Support: 28,610.39
1st Resistance: 29,924.16
Disclaimer:
The opinions given above constitute general market commentary and do not constitute the opinion or advice of IC Markets or any form of personal or investment advice.
Any opinions, news, research, analyses, prices, other information, or links to third-party sites contained on this website are provided on an "as-is" basis, are intended to be informative only, and are not advice, a recommendation, research, a record of our trading prices, an offer of, or solicitation for, a transaction in any financial instrument and thus should not be treated as such. The information provided does not involve any specific investment objectives, financial situation, or needs of any specific person who may receive it. Please be aware that past performance is not a reliable indicator of future performance and/or results. Past performance or forward-looking scenarios based upon the reasonable beliefs of the third-party provider are not a guarantee of future performance. Actual results may differ materially from those anticipated in forward-looking or past performance statements. IC Markets makes no representation or warranty and assumes no liability as to the accuracy or completeness of the information provided, nor any loss arising from any investment based on a recommendation, forecast, or any information supplied by any third party. Long