The SPX500 And Its Final Push HigherLet’s take a look at the current S&P 500 structure from an Elliott Wave perspective.
On the highest degree of our count, we are currently in the final Wave (V) to the upside (shown in blue). This Wave (V) started at the beginning of October 2022, and since then, the S&P 500 has gained more than 100%.
The orange count shows the internal structure of this Wave (V). Here, we can see that we are also in the final Wave V to the upside.
Going one degree lower , the purple subwaves show the internal structure of this final Wave V. A Wave (4) correction has just come to an end, suggesting that the final impulsive move higher may now be developing.
What makes the current structure particularly interesting is how the different wave degrees align with each other.
As long as this structure remains intact, the final move higher could potentially take the S&P 500 towards a new ATH, with a maximum target around 8,624.
However, once this final Wave (V) is completed, the larger structure could change significantly and open the door for a major correction.
For now, the focus remains on the structure in front of us. As long as the count remains valid, there can still be opportunities on the long side.
Let me know what you think  Long
Long
 Long
Long
USNAS100 | Bulls Target 29465 as Yields & Oil Retreat
USNAS100 is showing bullish momentum today, supported not only by the technical structure but also by an improvement in the short-term fundamental backdrop.
Following yesterday’s Fed rate hike, Nasdaq futures are rebounding strongly as long-term Treasury yields ease and oil prices continue to retreat. Nasdaq 100 futures were up roughly 1% in early U.S. trading, outperforming the other major indices. Lower long-term yields are particularly supportive for technology and growth stocks because they reduce some of the valuation pressure created by higher borrowing costs.
Technically
The price is currently consolidating inside the 29280–29465 range, while momentum remains bullish as long as the market holds above the 29280 pivot.
The first upside target remains 29465.
A confirmed 1H candle close above 29465 would strengthen the bullish structure and support an extension toward 29680.
On the downside, the bullish setup would begin to weaken if the market loses 29280. A confirmed 4H candle close below 29280 would shift momentum bearish and open the way toward 29040, followed by 28850 if selling pressure continues.
Fundamental Structure
The immediate environment is currently supportive for Nasdaq: oil is falling, the 10-year Treasury yield is easing, and technology shares are leading today’s recovery.
However, the broader macro risk has not disappeared. The Fed raised rates by 25 bps yesterday to 3.75%–4.00%, and policymakers indicated that further tightening could be necessary. Markets are currently pricing roughly a 51% probability of another hike in October, up from around 44% before the decision.
Pivot Line: 29280
Resistance: 29465 – 29680
Support: 29040 – 28850
Long 
Short 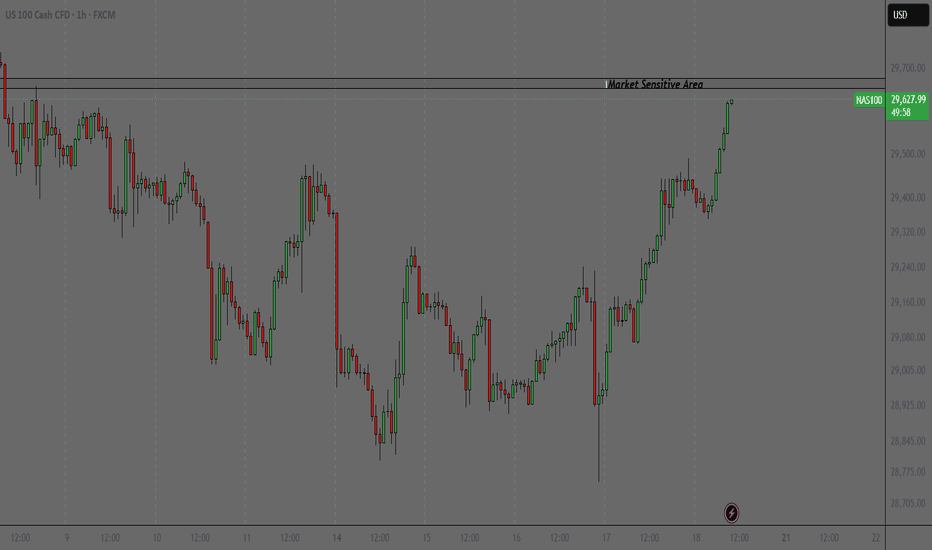
CVNA / SPX / NDX Review — Sept 18, 2026CVNA / SPX / NDX Review — Sept 18, 2026
SPX (Weekly):
Nadir in March 2026, rallied into May Sideways May–August, , then an August pump. Price now inside a descending tertiary channel with a polarity line formed during the sideways phase.
During FOMC volatility, price tagged the polarity line and bounced back into the channel. Volume running below its moving average. No conviction behind the move, so expecting the range/downtrend to continue for now.
NDX (Weekly):
Sharper decline than SPX from June–August (AI-driven downturn), rallied back toward 30,000, now in its own descending channel on declining volume.
Key polarity/support level ~28,800 — price has bounced off this level before; treating it as strong support.
CVNA (Weekly): Peaked earlier than SPX (April), declined into a June–August sideways range, August pump took it to ~$75, until being rejected by down trending S/R Polarity line (Green).
You also see the descending S/R trendline pressing into horizontal support (~$57–65) — forming a descending triangle.
Thesis: range-bound in the near term, eventually resolves lower as the triangle compresses.
MFI: Watching MFI for a touch of the lower trendline as a possible bounce signal.
Noted a secondary zone ~$73.90–76.10 as a short/resistance area.
Position: Long CVNA puts on the breakdown thesis.
Key risks to track:
Time decay if the range persists longer than the contract's duration.
Invalidation if price reclaims back above the $75–76 bounce highs rather than continuing to compress. Short

NASDAQ / US TECH 100 — 2H TECHNICAL ANALYSIS📊 NASDAQ / US TECH 100 — 2H TECHNICAL ANALYSIS
🧭 Market Structure • Liquidity • FVG • Order Block • Key Levels
Instrument: US Tech 100 Cash
Timeframe: 2H
Chart price: ~29,279
Chart date: 17 Sep 2026
🏗️ 1. MARKET STRUCTURE
The chart shows a significant recovery from the 28,750–28,800 support region.
🔹 A CHoCH (Change of Character) is marked around 29,000–29,050, indicating a shift from the prior bearish structure.
🔹 Price subsequently created higher lows and pushed back toward 29,300, suggesting improving short-term structure.
🔹 However, price is still approaching the descending trendline, so the larger 2H bearish structure has not been completely invalidated yet.
Key structural point:
A sustained break and 2H close above the descending trendline would provide stronger confirmation of continuation toward the upper resistance zone.
🟢 2. ORDER BLOCK + FVG
The most important near-term demand area on your chart is:
🟩 Order Block
≈ 29,100 – 29,170
🟦 Fair Value Gap
≈ 29,050 – 29,100
This creates a relatively compact 29,050–29,170 reaction zone.
If price retraces into this area and buyers defend it, the structure remains constructive.
📌 Important: A clean 2H breakdown through this zone would weaken the bullish scenario and increase the probability of a deeper retracement.
📈 3. BULLISH CONTINUATION SCENARIO
Your projected path on the chart is technically consistent with a retracement → demand reaction → continuation structure:
29,279
⬇️
🟩 29,170–29,100 OB
⬇️
🟦 29,100–29,050 FVG
⬆️
📈 reclaim 29,250–29,300
⬆️
🚀 break descending trendline
⬆️
🎯 29,600–29,750 resistance
The important confirmation is not simply touching the OB/FVG. Ideally, price should show rejection + structural recovery from that zone.
🔴 4. MAJOR RESISTANCE
🟥 Resistance Zone: 29,600 – 29,750
This is the major supply area highlighted on your chart.
It contains the previous swing-high region and represents the next significant upside obstacle.
Within this area:
29,600 → lower boundary
29,700 → major previous high area
29,750 → upper boundary
A move into this zone should therefore be treated as a major reaction area, rather than assuming automatic continuation.
⚠️ 5. BEARISH INVALIDATION / RISK AREAS
The immediate warning level is the 29,050–29,100 demand region.
If price:
🔻 loses the FVG
🔻 breaks the Order Block
🔻 fails to reclaim the area
then the bullish recovery structure becomes weaker.
The next major downside reference on your chart is:
🟥 28,753.6 — Major Support
This is the clearly marked horizontal support and sits near the recent swing-low structure.
A sustained break below this region would materially change the chart structure.
🧩 KEY LEVEL MAP
Zone Level Role
🔴 Major Resistance 29,600–29,750 Supply
⚠️ Trendline / Pivot ~29,300 Breakout confirmation area
🟢 Current Price ~29,279 Decision area
🟩 Order Block 29,100–29,170 Demand
🟦 FVG ~29,050–29,100 Imbalance
🟠 Structure ~29,000 CHoCH region
🔴 Major Support 28,753.6 Structural support
🎯 PROFESSIONAL SCENARIO MAP
🟢 Scenario A — Bullish Continuation
29,050–29,170 holds
➡️ rejection from demand
➡️ reclaim 29,250–29,300
➡️ break descending trendline
➡️ continuation toward 29,600–29,750
Confirmation: preferably a decisive 2H close above the relevant trendline/resistance.
🔴 Scenario B — Deeper Correction
29,050–29,100 fails
➡️ FVG gets invalidated
➡️ Order Block loses support
➡️ lower levels become relevant
➡️ 28,753.6 becomes the major structural reference
🟡 Scenario C — Range / Choppy Conditions
If price remains between approximately:
29,100 ↔ 29,300
then the market is effectively operating inside a short-term decision range.
In that situation, waiting for a confirmed breakout or breakdown provides clearer structural information than interpreting every intraday wick as a trend change.
🧠 FINAL TECHNICAL READ
The 2H chart is at a decision point.
The recovery from 28,753.6 and the marked CHoCH indicate improving structure, while the 29,100–29,170 OB/FVG zone provides the key demand reference.
At the same time, the descending trendline and 29,600–29,750 resistance zone mean the broader reversal still requires confirmation.
🔑 Levels to watch
29,300 → trendline/breakout confirmation
29,170–29,050 → demand / OB + FVG
29,600–29,750 → major resistance
28,753.6 → major support
📌 conclusion:
🟢 Bullish continuation remains structurally possible while the marked demand zone is defended, but confirmation comes from reclaiming the ~29,300 area and breaking the descending trendline. A loss of the 29,050–29,100 zone shifts attention back toward lower support, with 28,753.6 as the major reference.
⚠️ Educational technical analysis only — use position sizing and risk management appropriate to your strategy.
Long 
Short 
DAX 40 Update: DAX Index Falls on FridayPEPPERSTONE:GER40
Frankfurt's DAX 40 index fell approximately 0.7% to the 25,500 level on Friday, reversing course after two consecutive sessions of gains and moving in line with broader European market trends.
A cautious sentiment returned to European markets following a week dominated by central bank decisions, even as oil prices resumed their decline.
----------------------------------------------------------------------------------------------------------------
✅ Price Action Analysis (H4 Timeframe)
The macro H4 structure reflects a Bearish Structure / Relief Retest Phase. After a gradual decline from the record high near the 26,624.5 green line, the GER40 index slid downward, establishing a temporary bottom via a liquidity sweep (a "wick" penetration below the level) at the floor of the Major Demand Zone (25,197.0 – 25,307.0).
At the 25,441.2 price level, the most recent H4 candle shows a minor downward correction after bouncing off the 25,197.0 low and stalling at the 25,828.3 green line resistance.
The current candle is holding above the local Higher Low (HL) area—specifically above the 25,307.0 floor—indicating an attempt to build a defensive base prior to the next potential recovery push.
----------------------------------------------------------------------------------------------------------------
✅ Key Zones:
- ⚡Resistance / Supply Zone (SBR): The 25,828.3 green line range (SBR area & nearest local resistance), the 26,174 green line, and the 26,624.5 green line (peak of the Major Supply Zone).
- ⚡Support / Demand Zone: The 25,307.0 – 25,400.0 green line range and the 25,197.0 green line (the absolute floor of the Major Demand Zone).
----------------------------------------------------------------------------------------------------------------
✅ Forward Outlook
- ⚡The sharp decline from the peak of 26,624.5 to the low of 25,197.0 is calculated as the completion of Sub-Wave A (or Wave 1). The upward rebound touching the green line at 25,828.3 is identified as the formation of Sub-Wave B (a micro zigzag correction).
- ⚡The mild decline from 25,828.3 to 25,441.2 is currently identified as the formation of a micro sub-wave 2/B within a relief rally structure.
- ⚡Price action is projected to complete consolidation above the 25,307.0 demand level before launching an impulsive upward push (relief wave) to break the 25,828 resistance, aiming to test the Supply Zone barrier near the green line at 26,174.  Long
Long
 Short
Short
Short 
Short 
Short 
A Rate Hike Could be the Better Outcome This Time AroundWith the September 16th Fed meeting approaching, we want to share a view that cuts against the conventional narrative.
Markets are conditioned to fear rate hikes. But in the current environment, sticky persistent inflation, elevated oil prices, and broader macroeconomic uncertainty, a pause may actually be the worse outcome. A pause could spark a brief relief rally, but long-term yields would likely begin rising almost immediately as markets price in prolonged rate uncertainty. That re-rating of the long end of the curve is a headwind for valuations that tends to do more damage than the initial relief rally is worth.
A 25bp hike, counterintuitively, could be the cleaner outcome. It signals Fed confidence in tackling inflation decisively, historically a more constructive backdrop for equities than the alternative of watching inflation expectations drift higher unchecked. Long-term inflation expectations stabilise, Treasury yields find a clearer path, valuation uncertainty compresses, and equities can trade on fundamentals again rather than on rate speculation.
We are not calling the outcome. We are flagging the framework.
Two data points between now and September 16th will largely determine which path the Fed takes:
US Jobs Report - September 4th
CPI Inflation - September 11th
The Fed has been explicit about being data-driven. These two releases are the most important inputs to their decision. We will have a much clearer picture of the likely outcome by mid-September. Watch the data. Bullish bounce at pullback support?USTEC is falling towards the pivot, which has been identified as a pullback support and could bounce towards the 1st resistance.
Pivot: 29,260.21
1st Support: 28,610.39
1st Resistance: 29,295.16
Disclaimer:
The opinions given above constitute general market commentary and do not constitute the opinion or advice of IC Markets or any form of personal or investment advice.
Any opinions, news, research, analyses, prices, other information, or links to third-party sites contained on this website are provided on an "as-is" basis, are intended to be informative only, and are not advice, a recommendation, research, a record of our trading prices, an offer of, or solicitation for, a transaction in any financial instrument and thus should not be treated as such. The information provided does not involve any specific investment objectives, financial situation, or needs of any specific person who may receive it. Please be aware that past performance is not a reliable indicator of future performance and/or results. Past performance or forward-looking scenarios based upon the reasonable beliefs of the third-party provider are not a guarantee of future performance. Actual results may differ materially from those anticipated in forward-looking or past performance statements. IC Markets makes no representation or warranty and assumes no liability as to the accuracy or completeness of the information provided, nor any loss arising from any investment based on a recommendation, forecast, or any information supplied by any third party. Long 

 Long
Long
Nifty September 4th Week Analysis ( Detailed Analysis )Nifty’s weekly close at 23,346 is not very optimistic for the bulls. It is the 7th consecutive red bar on the Nifty weekly chart, which is not very common. Global uncertainties are making the bull case weak. If we get any positive news flow in the upcoming week, we can expect a possible rebound from the 23,300–23,000 zone.
The important level for bears is last week’s low at 23,117. If bears are able to grip this level, we can expect further retracement up to 22,928–22,840.
If Nifty bulls activate and manage to cross and sustain above the base level of 23,400–23,460, we can expect positive momentum.
All levels are marked in the chart posted.
Banknifty September 4th Week Analysis.Bank Nifty is looking neutral for the upcoming week. Currently, bears have a better grip over the bulls, but in the past two weeks, they could not hold the 55,950–55,724 zone. This indicates that if bulls manage to claim the 56,535–56,700 zone, the uptrend can continue further up to 57,394+. If bears succeed in gripping the 55,950–55,724 zone, further retracement is possible.
All levels are marked in the chart posted.


