The De-Dollarization Plumbing Nobody is Talking About $DXYWhile social media debates whether the dollar crashes overnight or dominates forever, a fundamental structural rewiring is quietly occurring. Sovereign nations are actively refinancing dollar denominated loans directly into Chinese yuan.
This is not a sudden crash of the greenback, but a gradual bypass of the Western financial architecture.
Who Is Doing This?
The blueprint crystallized when Kenya finalized the conversion of its Chinese Standard Gauge Railway (SGR) loans converting roughly $3.5b to $5b from USD to RMB.
Kenya shifted from floating Western benchmark rates (SOFR) to China’s Loan Prime Rate (LPR), slicing interest rates nearly in half and saving an estimated $215M to $250M annually.
Following Kenya’s execution, Ethiopia entered bilateral agreements with the People’s Bank of China (PBOC) to restructure debt treatment, set up RMB trade settlements, and integrate its banks into CIPS (China's Cross-Border Interbank Payment System). Other debt distressed borrowers holding heavy Chinese bilateral loans including Zambia, Mozambique, and Sri Lanka are exploring or initiating similar bilateral currency swaps and redenomination models.
How Does This Actually Affect the U.S.?
These nations aren't dumping existing dollar balances. However, they are eliminating future demand for them.
The Closed-Loop Financial Rail:
When a country owes AMEX:USD , it must clear payments through New York correspondent banks and SWIFT. Redenominating debt into RMB cuts Western rails out entirely. The borrower sells raw commodities directly to China, earns RMB, and uses that RMB to service Chinese infrastructure debt via CIPS. The transaction never touches a U.S. bank or Wall Street clearinghouse.
Blunting Sanctions Leverage:
The primary enforcement mechanism of U.S. foreign policy has long been the threat of cutting off access to the dollar clearing system. As developing nations establish parallel, non-dollar debt and payment circuits, the coercive leverage of secondary financial sanctions weakens.
Erosion of Passive Dollar Demand:
Foreign central banks historically held massive foreign exchange cushions in U.S. Treasuries because global debt had to be paid in dollars. Redenominating external sovereign liabilities reduces the structural necessity to hoard dollar reserves over the coming decades.
Hard Data to Track (Beyond Central Bank Gold Accumulation)
While foreign central banks hoarding physical gold at multi decade records remains a visible sign of reserve diversification, the real operational plumbing shows up in institutional data.
SAFE Cross Border RMB Share:
Tracks the proportion of China’s own external trade and cross-border payments settled in yuan versus dollars. It has crossed 52%, with H1 cross-border trade settlements in RMB up over 31% year-over-year. A decade ago, this was near zero.
U.S. Treasury TIC Data (Official vs. Private Divergence):
Recent Treasury International Capital (TIC) releases show a clear structural split. Foreign private investors (hedge funds and asset managers capturing high nominal yields) continue buying, while foreign official accounts (central banks) frequently register net monthly outflows. Foreign states are no longer passively absorbing U.S. deficit issuance at historical rates.
CIPS Network Trajectory:
Clearing volume on China’s alternative to SWIFT has accelerated past an annualized $25T+ equivalent, connecting nearly 1,800 participating institutions across over 100 countries.
Panda Bond Issuance:
Foreign sovereign and supranational issuers tapping China's domestic bond market to borrow directly in RMB have pushed cumulative outstanding volume beyond RMB 500 billion, locking in 2 to 3% yields rather than issuing dollar debt.
What Could Cause This to Speed Up?
Aggressive Secondary Sanctions Overreach
The primary accelerator of de-dollarization is the weaponization of the dollar itself. If the U.S. imposes broad secondary sanctions on major non-aligned nations (e.g., sanctioning Indian, Turkish, or Emirati banks for trading with China or Russia), it forces neutral countries to preemptively construct non-dollar settlement rails to protect their own trade flows.
"Higher for Longer" U.S. Interest Rates
The math behind Kenya and Ethiopia’s debt conversion was straightforward: paying 7.5% on floating USD loans versus 3% on Chinese RMB loans. If stubborn U.S. inflation or surging deficit supply forces U.S. yields back up, dollar debt service becomes unsustainable for emerging markets. Borrowers will actively demand debt conversion into lower-yielding currencies simply to avoid default.
Official Pricing of Key Commodities Outside USD
The petrodollar is the bedrock of non-discretionary dollar demand. If major energy or commodity exporters (such as Saudi Arabia, the UAE, or Brazil) move from settling bilateral volumes in local currencies to officially invoicing and benchmarking raw materials in yuan or multi currency baskets, global buyers will no longer need to hold massive structural dollar cushions.
TGtg!  Short
Short
 Long
Long
NASDAQ 100: Three Forces Driving Tech Right NowNASDAQ 100 is trading near 29,268 after bouncing from the 28,920 support area. The move is not just technical — three forces are pulling the market in different directions.
First, AI sentiment is under pressure. Reuters reports that global AI-linked stocks fell after major AI leaders called for slowing development because of safety risks. This hit chip and AI infrastructure names, including Nvidia, AMD, SoftBank and ASML. For NASDAQ, this matters because AI optimism has been one of the main drivers behind tech valuations.
Second, valuation pressure remains a risk. When bond yields stay elevated, expensive growth and semiconductor stocks become more vulnerable to profit-taking.
Third, the chart is trying to stabilize. NASDAQ defended 28,920 and reclaimed EMA 9 and SMA 50, while RSI improved and MACD turned positive. However, the index still needs to break the 29,308–29,350 resistance zone to confirm a stronger recovery.
Scenario: above 29,350, buyers may target 29,750. If price rejects from this zone, 29,150, 29,000 and 28,920 return to focus.
Key idea: AI headlines are negative, but the chart has not broken down. NASDAQ is caught between weaker AI sentiment and a technical rebound from support.
⚠️ Not financial advice.
Bullish rebound in play?UK100 has bounced off the pivot, which has been identified as an overlap support, and could potentially rise towards the pullback resistance.
Pivot: 10,589.16
1st Support: 10,452.55
1st Resistance: 10,710.25
Disclaimer:
The opinions given above constitute general market commentary and do not constitute the opinion or advice of IC Markets or any form of personal or investment advice.
Any opinions, news, research, analyses, prices, other information, or links to third-party sites contained on this website are provided on an "as-is" basis, are intended to be informative only, and are not advice, a recommendation, research, a record of our trading prices, an offer of, or solicitation for, a transaction in any financial instrument and thus should not be treated as such. The information provided does not involve any specific investment objectives, financial situation, or needs of any specific person who may receive it. Please be aware that past performance is not a reliable indicator of future performance and/or results. Past performance or forward-looking scenarios based upon the reasonable beliefs of the third-party provider are not a guarantee of future performance. Actual results may differ materially from those anticipated in forward-looking or past performance statements. IC Markets makes no representation or warranty and assumes no liability as to the accuracy or completeness of the information provided, nor any loss arising from any investment based on a recommendation, forecast, or any information supplied by any third party.
 Long
Long
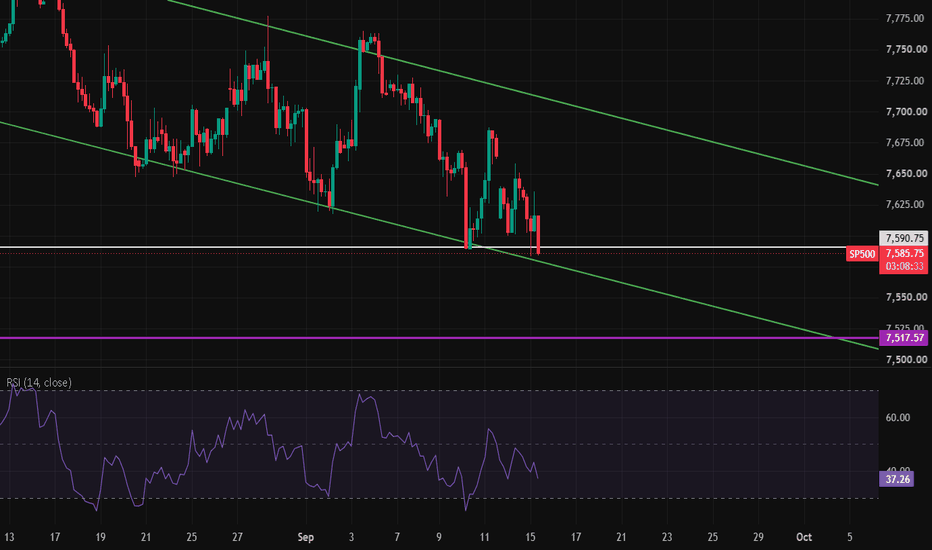
Stocks Limp into the FedThe S&P 500 has been trying to hold its June high, and some traders may think it will break support.
The first pattern on today’s chart is the price zone between 7,563 and 7,618. It matches the trading range on June 1, an outside reversal day at record highs. The index stayed under that area in June and July, followed by a breakout in August.
SPX bounced near the zone in August and earlier this month. However, there was little follow-through and prices have returned to the range. Is support finally breaking?
Second, the current price action is happening at the 50-day simple moving average. That could reflect a weakening intermediate-term trend.
Third, the 8-day exponential moving average (EMA) is below the 21-day EMA. MACD is also falling. Those signals are potentially consistent with short-term bearishness.
Finally, 7,273 was the high on May 5 before a bullish gap. SPX bounced near that level in June and again in late July. That could make traders expect probing toward the same area, especially with energy prices and yields rising.
TradeStation has, for decades, advanced the trading industry, providing access to stocks, options and futures. If you're born to trade, we could be for you. Learn more here about TradingView’s Broker of the Year!
Past performance, whether actual or indicated by historical tests of strategies, is no guarantee of future performance or success. There is a possibility that you may sustain a loss equal to or greater than your entire investment regardless of which asset class you trade (equities, options or futures); therefore, you should not invest or risk money that you cannot afford to lose. Online trading is not suitable for all investors. View the document titled Characteristics and Risks of Standardized Options at www.TradeStation.com . Before trading any asset class, customers must read the relevant risk disclosure statements on www.TradeStation.com . System access and trade placement and execution may be delayed or fail due to market volatility and volume, quote delays, system and software errors, Internet traffic, outages and other factors.
Securities and futures trading is offered to self-directed customers by TradeStation Securities, Inc., a broker-dealer registered with the Securities and Exchange Commission and a futures commission merchant licensed with the Commodity Futures Trading Commission). TradeStation Securities is a member of the Financial Industry Regulatory Authority, the National Futures Association, and a number of exchanges.
TradeStation Securities, Inc. and TradeStation Technologies, Inc. are each wholly owned subsidiaries of TradeStation Group, Inc., both operating, and providing products and services, under the TradeStation brand and trademark. When applying for, or purchasing, accounts, subscriptions, products and services, it is important that you know which company you will be dealing with. Visit www.TradeStation.com for further important information explaining what this means. Short 
Could a Support Breakdown Trigger a Deeper Correction?FTSE 100 | Could a Support Breakdown Trigger a Deeper Correction? 📉⚠️
Hello everyone and welcome back to all my TradingView followers! 👋📊
I hope you're all doing well and, as always, trading with discipline and proper risk management.
Today I’m looking at the FTSE 100 on the Daily timeframe, where price is currently approaching a very important technical decision point amid increasing global macroeconomic and geopolitical risks.
🌍 Fundamental View | Global Markets Under Pressure
Global markets have recently shifted back toward a more Risk-Off environment.
Higher oil prices, renewed geopolitical tensions, rising bond yields and growing inflation concerns are creating a challenging backdrop for global equities.
The FTSE 100 also came under pressure today, falling around 0.6% toward 10,634, as higher oil prices increased inflation concerns and pushed bond yields higher.
🛢️ Strait of Hormuz Risk
One of the biggest risks for global markets right now is the potential escalation of military tensions around the Strait of Hormuz.
According to today's reports, commercial shipping through Hormuz has fallen dramatically, with only four commodity vessels transiting the waterway on Monday versus an estimated pre-war average of around 125 daily transits. Traffic through Bab el-Mandeb has also declined.
If military tensions escalate again and shipping disruptions intensify, the market could face the following chain reaction:
Geopolitical Escalation → Higher Oil → Higher Inflation → Higher Yields → Lower Risk Appetite 📉
That could create additional pressure on global equities.
The FTSE 100 does have relatively high exposure to energy and commodity companies, which can provide some protection when oil prices rise. However, if higher energy prices translate into persistent inflation and tighter monetary policy, that support could become less effective.
📊 Technical Analysis | FTSE 100 Daily
Technically, the current structure is very interesting. 👀
Price is currently trading around 10,650, right near the key support area.
🟡 First Support:
10,574
This level is currently very important.
Below it, the next major support zone is:
🟡 10,166 – 10,002
This area could become the next potential downside target if the current support fails.
🐻 Bearish Scenario
Price has already weakened below the rising trendline that supported the previous bullish structure.
If:
10,574 → breaks
and the daily candle confirms the breakdown below this level, the probability of a deeper correction increases significantly. 📉
The next potential targets would be:
🎯 10,166
followed by:
🎯 10,002
So the potential bearish path would be:
10,574 → 10,166 → 10,002
If geopolitical tensions intensify further and global risk appetite deteriorates, even lower support levels could eventually become relevant.
🐂 Bullish Scenario
The bullish scenario is not invalidated yet.
The major resistance on the chart is around:
🔴 10,887
If buyers defend the current support, reclaim the rising trendline and eventually break above 10,887, the current bearish structure could be invalidated.
In that case:
Breakout → Retest → Confirmation
would provide a much stronger setup for bullish continuation. 🟢📈
For now, I would rather wait for confirmation than try to predict the next major move.
🧠 Final View
In my opinion, the FTSE 100 is currently sitting at a very important decision point.
The market is dealing with:
🛢️ Higher oil prices
⚔️ Renewed Middle East military risks
🚢 Disruption around strategic shipping routes
📈 Higher bond yields
🔥 Inflation concerns
📉 Lower global risk appetite
Recent reports also show that escalating regional tensions and disruptions to energy routes are weighing on investor sentiment.
At the same time, the FTSE 100 has not yet confirmed a decisive breakdown below 10,574.
Therefore, this is the key level I am watching:
🔴 Break and daily confirmation below 10,574 → Higher probability of a correction toward 10,166 and 10,002.
🟢 Support holds → Potential recovery toward 10,887.
If geopolitical risks intensify and oil prices surge again, the probability of a deeper correction should not be underestimated. ⚠️
For now, I consider the support breakdown more important than trying to predict the direction in advance.
🗳️ What is your view?
Where do you think the FTSE 100 is heading next? 🤔
🟢 Bullish: Support holds and price moves back toward 10,887.
🔴 Bearish: 10,574 breaks and the index moves toward 10,166–10,002.
🟡 Neutral: More consolidation before the next major move.
What's your view? Share it in the comments! 👇💬
⚠️ Disclaimer |
This analysis is for educational and informational purposes only and does not constitute financial or investment advice. Financial markets involve significant risk. Always conduct your own research and use proper risk management before making any investment decision.
🏷️ Tags
#FTSE100 #UK100 #UKStocks #FTSE #LondonStockExchange #UKMarkets #GlobalMarkets #StockMarket #Equities #RiskOff #Geopolitics #MiddleEast #Hormuz #Oil #CrudeOil #Brent #Inflation #InterestRates #BondYields #BoE #FederalReserve #TechnicalAnalysis #FundamentalAnalysis #TradingView #MarketAnalysis #RiskManagement #Bearish #Bullish Education

 Short
Short
 Long
Long
Short 
Long 
 Short
Short
NIFTY 50 | 4H MARKET ANALYSIS | SEP 15, 2026📊 NIFTY 50 | 4H MARKET ANALYSIS
🔴 Bullish or Bearish? The Key Level Matters.
NIFTY 50 is trading around 23,118.60.
The 4H chart highlights a critical decision zone near 23,171.20.
📈 BULLISH SCENARIO
If NIFTY reclaims and sustains above 23,171.20, watch for potential upside toward:
🎯 24,000–24,242
🎯 24,843.90
📉 BEARISH SCENARIO
If price fails to reclaim the pivot and selling pressure continues, watch:
⚠️ 22,000–21,881.15
⚠️ 20,536.40
🔍 KEY OBSERVATION
The market is at a decision zone. A breakout needs confirmation. A breakdown needs follow-through.
Don't trade just because a level looks attractive.
Plan your entry. Define your stop-loss. Respect the trend.
💡 Trade with a plan, not emotions.
━━━━━━━━━━━━━━
🚀 TechieMyil
Trading | Tech | AI | Life
📌 Save this chart for your next market analysis.
Educational content only. Not financial advice. Short 
Short 
Long 
DXY | When Structure Reveals the Dollar’s Next Path⏱️ Estimated Reading Time: About 2 Minutes
In this update, our focus is on the current DXY structure on the daily chart, where the market is still revealing the pattern following the recent decline.
From the higher-degree perspective, we continue to monitor two scenarios.
🟢 Bullish Scenario
If the current structure completes as a corrective pattern and the market then develops a valid motive structure, the probability of further DXY strength will increase.
A break of the marked levels could provide additional confirmation for the bullish scenario and potentially open the path toward higher levels.
⚫ Bearish Scenario
On the other hand, if the current movement fails to maintain a corrective character and the market develops another valid bearish structure, the probability of a deeper correction will increase.
In that case, DXY could continue developing a more complex corrective structure, such as a Double Zigzag or another higher-degree combination.
🔎 What Matters Right Now?
We do not want to label the structure before the market reveals it.
For now, the key is price action around the marked levels and the internal structure of the next move.
If the next upside move develops as a motive structure, the bullish scenario gains strength. If price turns lower again and builds a valid bearish structure, the deeper corrective scenario remains on the table.
So for now, we have one main question:
What pattern is DXY actually building?
The market will provide the answer through structure.
Structure First. Scenario Second.
Patterns whisper. I listen.
— Mr. Nobody 🎧📊
Chart Note: The chart is set to “Lock Price to Bar.” For a closer look at the current structure, simply zoom in on the most recent price action and the marked levels.
Dollar Index
Jun 7
DXY Structural Analysis: Navigating the Diagonal
U.S. Dollar Currency Index
Jun 5
The DXY Time Paradox: Monday Engineering & Elliott Wave Dissecti
Long 


