Bearish drop off?S&P500 (US500) is reacting off the pivot and could reverse towards the 1st support, which has been identified as a pullback suport.
Pivot: 7,644.68
1st Support: 7,575.55
1st Resistance: 7,727.80
Disclaimer:
The opinions given above constitute general market commentary and do not constitute the opinion or advice of IC Markets or any form of personal or investment advice.
Any opinions, news, research, analyses, prices, other information, or links to third-party sites contained on this website are provided on an "as-is" basis, are intended to be informative only, and are not advice, a recommendation, research, a record of our trading prices, an offer of, or solicitation for, a transaction in any financial instrument and thus should not be treated as such. The information provided does not involve any specific investment objectives, financial situation, or needs of any specific person who may receive it. Please be aware that past performance is not a reliable indicator of future performance and/or results. Past performance or forward-looking scenarios based upon the reasonable beliefs of the third-party provider are not a guarantee of future performance. Actual results may differ materially from those anticipated in forward-looking or past performance statements. IC Markets makes no representation or warranty and assumes no liability as to the accuracy or completeness of the information provided, nor any loss arising from any investment based on a recommendation, forecast, or any information supplied by any third party.  Short
Short
Bullish bounce in play?US Dollar Index (DXY) has bounced off the pivot and could potentially rise towards the 1st resistance, which is an overlap resistance that aligns with the 78.6% Fibonacci projection.
Pivot: 99.44
1st Support: 99.10
1st Resistance: 100.22
Disclaimer:
The opinions given above constitute general market commentary and do not constitute the opinion or advice of IC Markets or any form of personal or investment advice.
Any opinions, news, research, analyses, prices, other information, or links to third-party sites contained on this website are provided on an "as-is" basis, are intended to be informative only, and are not advice, a recommendation, research, a record of our trading prices, an offer of, or solicitation for, a transaction in any financial instrument and thus should not be treated as such. The information provided does not involve any specific investment objectives, financial situation, or needs of any specific person who may receive it. Please be aware that past performance is not a reliable indicator of future performance and/or results. Past performance or forward-looking scenarios based upon the reasonable beliefs of the third-party provider are not a guarantee of future performance. Actual results may differ materially from those anticipated in forward-looking or past performance statements. IC Markets makes no representation or warranty and assumes no liability as to the accuracy or completeness of the information provided, nor any loss arising from any investment based on a recommendation, forecast, or any information supplied by any third party.  Long
Long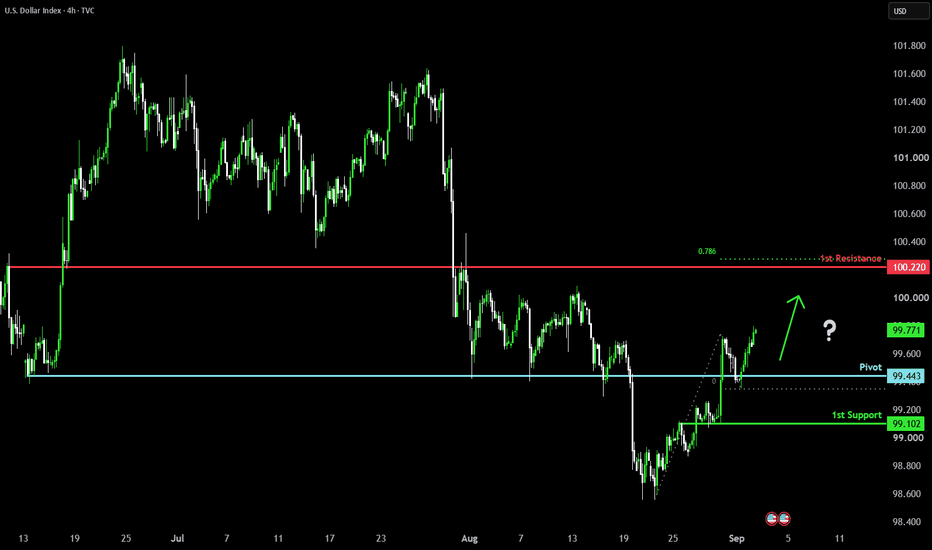
Long 
Japanese Stocks Fall Amid Rising Bond Yields and Oil PricesIG:NIKKEI
The benchmark Nikkei 225 index tumbled 2.5%, dropping below the 64,600 mark (hitting a four-week low), while the broader Topix index fell 1.6% to 4,115. This snapped a period of gains as the market faced two major headwinds: a surge in domestic and global bond yields and escalating oil prices.
Japanese Bond Yields (10-Yr JGB) Hit 3.0% & BOJ Rate Hike Expectations
The primary catalyst driving the equity valuation adjustment originated in Tokyo's debt market:
- ⚡Bond Market Milestone: The yield on the 10-year Japanese Government Bond (10-Yr JGB) officially hit 3.0%—its highest level since 1996—after investors acknowledged the Bank of Japan's (BOJ) move toward monetary policy normalization.
- ⚡BOJ Rate Hike Expectations: Speculation regarding a BOJ rate hike this September triggered a massive de-risking move away from high-multiple equities (such as high P/E tech stocks), as the discount rate applied to future cash flow valuations surged.
---------------------------------------------------------------------------------------------------------------
✅ Crude Oil Rallies for 3 Consecutive Sessions Following US-Iran Conflict in Hormuz
- Escalating Energy Conflict: Air and naval clashes between the US and Iran in the Persian Gulf kept Brent crude prices firmly above $96 per barrel, driving the energy risk premium to its highest level of the third quarter of 2026.
- Import-Driven Inflationary Pressure: For net energy-importing nations like Japan, a surge in crude oil prices—coupled with rising bond yields—creates a "double squeeze" on the net profit margins of the manufacturing sector.
---------------------------------------------------------------------------------------------------------------
✅ Price Action Analysis (H4 Timeframe)
The H4 structure confirms the continuation of the Bearish Expansion phase. After stalling within a consolidation range (indicated by the middle gray box), the latest H4 candle decisively dropped, executing a Break of Structure (BOS) by breaching the green Pivot Level line at 64,925.9.
At the 64,647.2 price level, the H4 candle movement demonstrates total dominance by the sellers (bearish momentum).
The candle has closed below the 64,925.9 SBR horizontal line and is beginning to penetrate the lower gray box (historical Demand Zone). There are currently no signs of valid bullish rejection on the active candle.
---------------------------------------------------------------------------------------------------------------
✅ Key Zones:
- ⚡Resistance / Supply Zone (SBR): The 64,925.9 range (the green horizontal line that has now officially become the primary Support-Become-Resistance/SBR level) and the 66,852.1 range (the upper boundary of the previous consolidation resistance).
- ⚡Support / Demand Zone: The 62,054.8 range (the next green Major Demand Zone line) and the 60,833.1 range (the lowest historical Demand floor).  Short
Short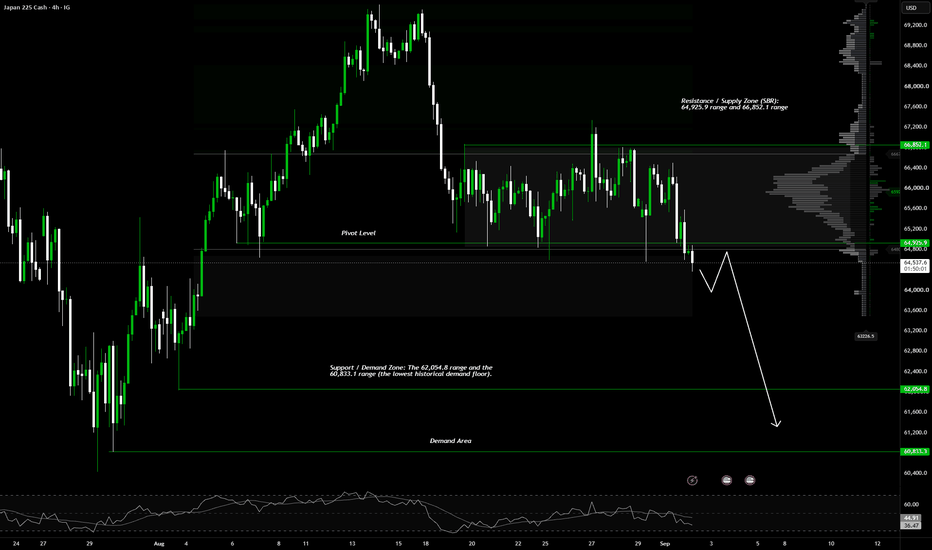
US100 Price Update – Clean & Clear ExplanationUS100 is currently showing a bullish recovery structure on the 1-hour chart, with price holding above the 29,200–29,300 support area and attempting to build upward momentum. The recent reaction from the lower support zone suggests buyers are defending this region, while price is gradually pushing back toward the 29,460 resistance area.
The recent price action shows a recovery from the 29,210 area, followed by higher lows and renewed buying pressure. As long as US100 continues to respect the 29,200–29,300 demand/support zone, the bullish structure remains valid and buyers may attempt to reclaim the nearby resistance levels.
Technically, a sustained move above 29,460 could strengthen the bullish scenario and open the way toward 29,550. A clean breakout and successful retest of 29,550 may further increase upside momentum, with the next major objective around 29,800.
For the bullish setup, 29,200–29,210 is an important support and invalidation area. A strong breakdown and sustained 1H close below this zone could weaken the bullish structure and shift attention toward lower support around 29,100–29,030.
Overall bias: Bullish above 29,200–29,300. Buyers have the advantage while price maintains this support zone. A break above 29,460 → 29,550 could confirm further upside toward 29,800.
your support means a lot! If you found this analysis useful, leave a Like and tell me your thoughts in the comments. Best of luck with your trading journey! 🚀  Long
Long
US100 Consolidation 30K Rejection, Bears Target 29,006 / 28,501US100 is showing repeated rejection from the 29,800–30,000 resistance/supply zone, with price struggling to establish a sustained breakout above the upper boundary of the current trading range.
Tecnically current weakness is also being supported by the macro environment. U.S. Treasury yields have surged, with the 10-year yield reaching around 4.78%, while rising oil prices and renewed geopolitical tensions are increasing inflation concerns. Higher yields can pressure growth and technology stocks because they increase the opportunity cost of holding equities and raise concerns about tighter monetary policy.
Markets are also watching upcoming U.S. economic data, particularly jobs and inflation figures, for clues about the Federal Reserve's next move. This is creating a more cautious environment for high-valuation technology stocks.
Resistance level ; 29,800 / 30,230
Support level ; 29,100 / 28,500
As long key downside levels on the chart are 29,006 first, followed by 28,501. A decisive break and close below 29,006 would strengthen the bearish continuation setup and could open the way toward the lower liquidity zone
Hope you found this analysis helpful. 👍
Like, Comment & Follow for more updates. Trade safe. Short 
Long 
Short 
 Long
Long
Short 
S&P 500 Back Below Resistance: Is a Deeper Correction Starting?After Warsh’s remarks pushed the U.S. Dollar Index(DXY) and the U.S. 10-Year Treasury Yield higher, the S&P 500 ( FOREXCOM:SPX500 ) moved back below the key $7,720 trading level.
The index is now trading below the Resistance Zone, while macro and geopolitical risks continue to build.
Can the S&P 500 reclaim $7,722, or is a deeper correction toward the Support Zone beginning?
Macro Outlook
Warsh’s hawkish remarks strengthened the U.S. dollar and pushed Treasury yields higher, creating additional pressure on U.S. equities.
At the same time, renewed military tensions in the Middle East remain an important risk factor. Any escalation could put further pressure on the S&P 500 and broader risk assets.
Technical Analysis
From an Elliott Wave perspective, the S&P 500 appears to have completed its corrective waves inside a Rising Wedge Pattern, suggesting that the next bearish waves could now begin.
💡 Educational Note: A Rising Wedge often signals weakening bullish momentum. A confirmed breakdown can increase the probability of a deeper corrective move.
I expect the S&P 500 to continue its bearish trend and decline toward the Support Zone and the $7,634 level.
Trade Setup
First Take Profit(TP): $7,643
Second Take Profit(TP): $7,634
Stop Loss(SL): $7,723
Key Trading Levels: $7,670 _ $7,722
Which level do you think the S&P 500 will reach first?
🔴 $7,634
🟢 $7,723
📌 S&P 500 Analysis(SPX), 2-hour time frame.
🛑 Always use proper risk management and set a Stop Loss(SL) for every position.
🚀 If this analysis helps your trading plan, a BOOST would help more traders discover it. Short 
Short 
Short 
Short 
S&P500 corrects every time to this level in last 17 years.The S&P500 index (SPX) has been trading within a Channel Up since the March 2009 U.S. Housing Crisis bottom. Within this pattern, the market has periodically peaked and then pulled-back to test at least the 1W MA200 (orange trend-line).
The first line of Support has been the 1W MA100 (green trend-line), which covered the three more recent and shorter corrections of 2024, 2025 and now early 2026. However, the last time the index made contact with its 1W MA200 was on the October 2022 bottom.
In addition, it is currently on the 2nd longest streak without having the 1M RSI touch the 16-year Buy Zone, which was 228 weeks (1596 days). In May 17 2027 we will again complete 228 weeks since the last RSI Buy Zone test.
Technically, the market has a strong 'need' for another 1W MA200 test and even though it is currently around 5600, history has shown that sharp corrections do take place, like Feb-March 2020, Oct-Dec 2018, May-Oct 2011.
Also, with the exception of 2015 (which hit the 0.236 Fib), the other three 1W MA200 corrections have all tested (at least) the 0.382 Fibonacci retracement level from the previous bottom.
As a result, even though S&P500 could go a little higher to test the Top of the historic Channel Up, it appears very likely to pull-back and break below the 1W MA100, targeting at least the 0.236 Fib at 6500. By the end of the year/ beginning of next, this price level would also be close to the 1W MA200. If fundamentals (Fed hikes, geopolitics) get even worse, a 1W MA200 test by late Q1 2027 could take place near 6100 coinciding with a 1M RSI touch on its 16-year Buy Zone, but that's a less likely scenario.
Needless to say, if a 1M RSI test on that Zone takes place before any of those Targets, then the S&P500 would turn into a multi-year buy opportunity for us regardless of the price.
As a side-note, notice also how since 2008, the Time Cycles (Sine Waves) have fairly accurately caught the start of every of those major technical corrections. Based on the current Sine Wave, one should have started last year (August 2025), so technically such a Bearish Leg correction seems long overdue.
---
** Please LIKE 👍, FOLLOW ✅, SHARE 🙌 and COMMENT ✍ if you enjoy this idea! Also share your ideas and charts in the comments section below! This is best way to keep it relevant, support us, keep the content here free and allow the idea to reach as many people as possible. **
---
💸💸💸💸💸💸
👇 👇 👇 👇 👇 👇 Short 
SP500 30M — BEARISH BREAKDOWN: SELLERS TARGET 7,640SP500 30M — Bearish Analysis 🔴
Current bias: Bearish. Price rejected strongly from the 7,760–7,780 supply zone after taking liquidity above the prior high.
Structure: The bullish sequence has shifted into a bearish structure, with a CHOCH followed by a structure break.
Key resistance: 7,720–7,730. This is the main pullback/sell area.
Current price: Around 7,683, so chasing the sell here carries more risk.
TP1: 7,660
TP2: 7,640
Major demand: 7,640–7,660
Invalidation: A sustained move back above 7,730 weakens the immediate bearish setup; a break/reclaim of 7,760–7,780 would invalidate the bearish idea more strongly.
Best setup: Wait for a pullback toward 7,720–7,730, then look for bearish confirmation before entering.
Overall bias: SELL 🔴 | Target: 7,660 → 7,640 Short 
US100 / Nasdaq 100 shortMarket Structure
The broader structure has shifted bearish. Price first built a bullish structure from the 29,250–29,300 area, then formed liquidity around 29,480–29,500. That liquidity was taken before a sharp bearish displacement.
The key structural event is the break below the previous support/BOS area around 29,240–29,250. This acts as a bearish CHoCH, signaling that the prior bullish structure has been disrupted. The subsequent impulsive move below 29,200 strengthens the bearish continuation case. Unless price can reclaim the broken structure, the current structure favors lower prices.
Supply & Demand
The upper supply around 29,380–29,400 is strong because price previously reacted sharply downward from this region. The higher 29,480–29,500 area is even more significant because liquidity was formed there and then swept before the large selloff. Below, the 29,000–29,030 demand zone is the nearest major demand area; this is where buyers could potentially step in after the aggressive decline.
Marked Price Action
Price is currently around 29,110, after a very strong bearish impulse. The small consolidation around 29,150–29,200 looks corrective rather than a confirmed reversal. Your marked path suggests a retracement toward approximately 29,180–29,200, followed by another bearish leg.
The key scenario is therefore pullback → rejection → continuation lower, with the 29,000–29,030 demand zone as the primary downside objective. A clean break through that demand would expose lower levels.
Trade bias: Bearish.
Expected direction: Down after a possible short-term pullback.
Key invalidation: sustained reclaim above ~29,200–29,250, particularly if price begins holding above the broken structure. That would weaken the immediate bearish continuation setup.
Momentum
Momentum strongly favors sellers. The large consecutive bearish candles and displacement through multiple support levels show aggressive selling pressure. The current small candles indicate a temporary pause/correction rather than strong buyer control. A rejection candle around 29,180–29,200 would provide additional confirmation for the bearish continuation.
News / Macro Catalyst
There is a major macro catalyst supporting the bearish setup today. U.S. equity futures are under pressure as oil rises above $92, Treasury yields move higher, and renewed U.S.–Iran tensions increase inflation and risk-aversion concerns. Reuters reported Nasdaq futures leading the decline, down roughly 0.9%, while rising yields and oil were weighing particularly heavily on technology stocks.
Today's calendar also includes U.S. manufacturing PMI/ISM data, JOLTS job openings and construction spending, while the market is already looking ahead to Friday's employment report. These releases can increase volatility around the technical levels.
Overall: The technical structure and current macro environment are aligned bearishly. The cleaner setup is to watch for a corrective retracement into 29,180–29,200 rather than chase the current selloff, then look for evidence of rejection and continuation toward 29,000–29,030. Short