SMC Masterclass Pt 1: The IPDA Algorithm & London Judas Swing Tr🏛️ INSTITUTIONAL MASTERCLASS • PART 1 OF 15 📌 SMC Masterclass Pt 1: The IPDA Algorithm & London Judas Swing Trap
When I first started studying market microstructure over a decade ago, I was taught the standard retail textbook line: that price moves through chaotic crowd psychology , retail support/resistance , and random auction noise.
It was only when I began examining Level 2 and Level 3 Limit Order Book (LOB) data that reality clicked: Tier-1 liquidity providers, institutional treasury desks, and central bank execution programs do not trade like retail speculators. An institution handling $200M in foreign exchange cannot simply click 'market buy' without paying enormous slippage. They need counter-party volume—specifically, the dense clusters of resting retail stop-loss orders.
This algorithmic delivery follows a repeatable 3-phase cycle known as the Power of 3 or Accumulation, Manipulation, Distribution (AMD), governed by the Interbank Price Delivery Algorithm (IPDA):
1. Accumulation (The Asian Range Baseline): During the Asian session (00:00–04:00 UTC), volatility compresses. The algorithm programmatically builds an inventory consolidation box. Retail breakout traders place buy-stops just above the Asian High and sell-stops just below the Asian Low. This engineers Buy-Side Liquidity (BSL) and Sell-Side Liquidity (SSL) on both sides of the market. The True Daily Open (TDO) anchored at 00:00 EST acts as our baseline anchor.
2. Manipulation (The London Judas Swing): At 07:00 UTC (London Open Killzone), European institutional volume floods into the interbank market. If the true higher-timeframe daily bias is Bullish, the algorithm does not just take off upward. It first initiates a sudden, violent downward stab—the Judas Swing—plunging 15 to 30 pips below the Asian Low. Why? Because retail breakout traders panic and go short, while retail swing buyers have their stop-losses triggered (which are market sell orders). Smart money steps in and absorbs all those retail market sell orders as limit buy orders at deep discount prices.
3. Distribution (London & New York Expansion): Once institutional long positions are filled at discount prices below the True Daily Open, the algorithm snaps back and expands aggressively in the true trend direction, distributing inventory into the resting buy-stops above the Asian High and previous daily highs.
📊 Real-Time Tape Study (Look at the Attached EURUSD 15M Chart): Notice how cleanly this unfolds on the chart: Asian session built an accumulation box between 1.0772 and 1.0795 with the Midnight Open anchored at 1.0782. At 07:15 UTC (London Open), price aggressively plunged down to 1.0754, sweeping the Asian low by 18 pips. Right at 1.0754, price tapped directly into an unmitigated 4H Discount Bullish Order Block and formed a 15M displacement candle with a BISI Fair Value Gap. From that exact manipulation low, EUR/USD accelerated on a relentless +66 pip expansion straight into the 1.0820 distribution target.
🎯 Execution Rules on My Desk: Mark your 00:00 EST Midnight Open (TDO) on every intraday chart. On bullish days, look to buy strictly BELOW midnight open during the manipulation wick. Never chase the initial breakout of the Asian session high or low during the first 30 minutes of London. Wait for the purge. Invalidation: Place your protective stop 1–2 ticks below the manipulation wick extreme. If price accepts below that wick with a candle body close, the setup is invalidated.
Before closing out Part 1, I want to express my deepest gratitude to the TradingView team and this wonderful community. There is simply no other charting platform on earth with the visual fidelity, sub-second latency, and precision drawing tools of TradingView. Tools like Bar Replay and session break markers make studying these institutional delivery cycles an absolute joy. A huge thank you to the TradingView team and community moderators for maintaining the cleanest, highest-standard financial education repository anywhere in the world.
💡 Key Institutional Takeaway: Patiently waiting for the manipulation sweep below the True Daily Open eliminates the trap of chasing false breakouts. Master this timing rule before executing in the London session.
⚖️ Educational Disclaimer: This tutorial is published strictly for technical analysis and educational purposes. It does not constitute financial, investment, or trading advice. Always manage your risk responsibly. Smart Money Concepts (SMC) Institutional Masterclass🚀 SERIES LAUNCH & MASTER ROADMAP 📌 SMC Masterclass: The 15-Part Institutional Blueprint & Series Launch Plot
Fellow traders and technical craftsmen across the globe,
If you have spent any time navigating modern financial trading feeds, you are already familiar with the endless noise: retail traders caught in a frustrating loop of buying 'support' only to be stopped out by 2 pips before the market rockets higher, or aspiring analysts misled by 60-second social media clips drawing arbitrary colorful boxes on 1-minute charts and claiming that every single candle is an 'institutional order block.'
After spending over a decade studying market microstructure, Limit Order Book (LOB) depth, and the algorithmic delivery programs that govern modern electronic markets, one foundational truth becomes undeniable:
Price delivery is NOT random, and it is NOT driven by retail chart patterns .
Interbank algorithms, central bank dealer desks, and Tier-1 liquidity providers do not trade off retail trendlines. They operate through programmatic mandates designed around two core objectives: Liquidity Engineering: Repricing toward resting stop-loss pools (counter-party volume) to fill institutional-sized inventory without incurring catastrophic slippage. Time-Anchored Delivery Cycles: Executing orders inside specific liquidity windows governed by the Interbank Price Delivery Algorithm (IPDA).
Today, I am proud to officially launch the Smart Money Concepts (SMC) Institutional Masterclass Series right here on TradingView.
This series is not a high-level overview. It is a comprehensive, 15-part, step-by-step masterclass engineered to bridge the gap between retail technical analysis and true institutional order flow mechanics. We will roll out each episode sequentially, providing concrete, real-market tick studies across Forex (EURUSD, GBPUSD), CME Futures (ES, NQ, Gold), Equities (NIFTY, BANKNIFTY), and Crypto (BTCUSDT).
100% free. 100% educational. Zero paid courses. Zero external links. Strictly pure market craftsmanship.
🙏 A Sincere Tribute to the TradingView Community & Team
Before we unveil the 15-part master roadmap, I want to take a moment to express my deepest gratitude to the people who make this journey possible:
1. To the Global TradingView Community: Thank you for making this platform the world’s most intellectually vibrant trading forum. The chart analyses, insightful breakdowns, and rigorous technical debates shared here every day challenge all of us to continually refine our analytical edge. Trading is often a solitary discipline, but this community transforms it into a collective pursuit of technical mastery.
2. To the TradingView Core Engineering & Development Team: I want to extend the highest possible praise and respect to the TradingView engineering team. You have built what is, without question, the undisputed gold standard in global charting technology. As someone who analyzes order books and tick data across multiple asset classes daily, the tools you have built are indispensable to institutional analysis: You do not merely provide charts; you provide the institutional canvas upon which modern market theory is crafted. Hats off to the entire TradingView engineering team for setting the global standard. Sub-second multi-broker websocket delivery that renders millisecond volume displacement with zero lag. The Bar Replay Engine — a monumental innovation that fundamentally revolutionized how serious traders backtest algorithmic delivery, allowing us to reconstruct historical session price action tick-by-tick without hindsight bias. Pine Script v6 — the fastest, most ergonomic charting scripting language ever created, enabling traders to mathematically map order blocks, fair value gaps, and dealing ranges with programmatic precision. Native Session Breaks and multi-chart synchronized layouts, allowing us to separate Asian, London, and New York Killzones with surgical sub-pip accuracy.
3. To the TradingView Moderation & Editorial Team: A special and sincere salute to the TradingView moderation team. In an online financial landscape overrun by spam, get-rich-quick scams, and low-effort marketing, your uncompromising enforcement of House Rules and educational integrity is what protects this platform. Your tireless work ensures that TradingView remains a trusted sanctuary of high-signal, professional market wisdom. We honor and fully uphold your standards.
🗺️ The Master Plot: The 15-Part Curriculum Roadmap
(Take a close look at the attached roadmap diagram above — it illustrates the complete algorithmic cycle from Asian consolidation through the London Judas sweep, structural shift, imbalance mitigation, and final liquidity pool distribution).
Here is the exact step-by-step curriculum of what we will master across the 15 upcoming episodes:
⚡ Phase 1: Algorithmic Delivery & Core Market Geometry (Parts 1 to 4)
Part 1: The IPDA Algorithm & London Judas Swing Trap Unpacking the 3-phase Power of 3 (Accumulation, Manipulation, Distribution) cycle, how the Asian range builds resting buy/sell liquidity, and why buying strictly below the True Daily Open (00:00 EST) during the London open manipulation wick yields institutional pricing. Part 2: Strong vs Weak Swings & The Algorithmic Draw on Liquidity (DOL) Why price moves toward resting liquidity pools. How to classify swing points into protected structural anchors versus vulnerable retail targets, and identifying Internal vs External Range Liquidity. Part 3: Internal Structure (iBOS) vs Macro BOS Trend Traps How minor sub-structure pullbacks trick retail traders into taking premature counter-trend positions right before the higher-timeframe algorithm resumes its primary delivery vector. Part 4: Trend Continuation (BOS) vs True Reversals (CHoCH / MSS) How to distinguish superficial wick purges (Turtle Soups / SFPs) from genuine institutional trend reversals confirmed by displacement candle body closes.
⚡ Phase 2: Liquidity Engineering & Institutional Imbalances (Parts 5 to 8)
Part 5: Liquidity Engineering — Equal Highs/Lows (EQH/EQL) & Inducement (IDM) Bait How market makers intentionally engineer visible retail 'double tops' and 'support lines' to stockpile retail liquidity, and how to spot the inducement traps set just before true Points of Interest (POIs). Part 6: Order Block Anatomy, Mean Threshold (MT) & Rejection Blocks Moving beyond basic candlestick coloring: the exact mathematical anatomy of institutional volume injection, the 50% body midpoint (Mean Threshold MT), long-wick Rejection Blocks, and structural invalidation rules. Part 7: Imbalance Dynamics — Fair Value Gaps (FVG), Balanced Price Ranges (BPR) & Inversion IFVGs Quantifying single-sided market delivery (BISI and SIBI), measuring 50% Consequent Encroachment (CE), the institutional significance of Balanced Price Ranges (BPR), and trading polarity flips through Inversion Fair Value Gaps (IFVGs). Part 8: Dealing Range Equilibrium & The 70.5% OTE Centroid Why executing long positions in Premium (>50%) is mathematical suicide. How institutions define macro dealing ranges, calculate True Equilibrium, and exploit the mathematical centroid of the 70.5% Optimal Trade Entry (OTE) zone.
⚡ Phase 3: Precision Execution & Advanced Microstructure Models (Parts 9 to 12)
Part 9: Breaker Blocks, Mitigation Flips & Propulsion Launchpads Trading failed order blocks: the anatomy of high-probability Breaker Blocks formed after liquidity sweeps, mitigation polarity flips, and propulsion blocks that serve as rapid-acceleration launchpads. Part 10: Micro-Zone Refinement — Slashing Stop-Loss Size by 75% The multi-timeframe refinement funnel: taking a 40-pip Daily/4H supply zone and cascading down to 15M and 1M micro-POIs to slash risk from 35 pips to 7 pips without decreasing your profit target expectancy. Part 11: Time Precedes Price — Killzones, 20-Minute Macros & CBDR Bands Why price without time is meaningless: mapping the Asian, London Open, New York Open, and London Close Killzones, exploiting hourly algorithmic 20-minute macro delivery windows, and utilizing Central Bank Dealers Range (CBDR) standard deviation projection bands (1σ–4σ). Part 12: Inter-Market SMT Cracks, Silver Bullet & Market Maker Models (MMBM/MMSM) Exploiting non-confirmation cracks across correlated asset pairs (EURUSD vs GBPUSD, ES vs NQ), mastering the mechanical 60-minute ICT Silver Bullet protocol, and understanding the complete curve mechanics of Market Maker Buy and Sell Models.
⚡ Phase 4: Quantitative Execution, Risk Geometry & Retail Trap Avoidance (Parts 13 to 15)
Part 13: The Quantitative 6-Step Multi-Timeframe Execution Funnel A disciplined, rule-based desk playbook uniting macro monthly/weekly narrative, daily dealing ranges, 4H structural bias, 15M POI identification, and 1M execution triggers into a repeatable routine. Part 14: Asymmetric Trade Geometry, Expected Value (EV) & Half-Kelly Sizing The mathematics of trading survival: why a 40% win-rate system with 1:3.5 R:R exponentially outperforms a 90% retail scalping system, and how to apply fractional Kelly Criterion capital allocation to eliminate the risk of ruin. Part 15: The Anatomy of Retail SMC Traps — Premium Buying & False POIs A forensic autopsy of why retail SMC traders fail: buying in premium without displacement, entering inside internal dealing range no-man’s-land, and mistaking inducement liquidity for valid institutional order blocks.
🧭 How to Follow This Series & Study Protocol
To derive the absolute maximum value from this masterclass, I recommend three simple study rules: Treat this as an institutional training curriculum, not entertainment. Take detailed notes, save the attached chart diagrams, and review each episode thoroughly before moving to the next. Verify everything on your own TradingView charts. Use TradingView’s Bar Replay tool to test every concept on historical session data across your preferred asset class. Master risk management first. No analytical framework eliminates market uncertainty; professional edge lies in asymmetric risk-to-reward geometry and emotional discipline.
🗺️ Final Takeaway & Study Roadmap
Mastering institutional price action requires disciplined chart observation, patience, and rigorous execution. Use this syllabus as your structural blueprint, study each phase sequentially, verify every concept on your charts using Bar Replay, and always prioritize risk management above all else.
Let’s elevate our technical craft together. 🙏📊
⚖️ Educational Disclaimer: This tutorial is published strictly for technical analysis and educational purposes. It does not constitute financial, investment, or trading advice. Always manage your risk responsibly.  Education
 Short
Short
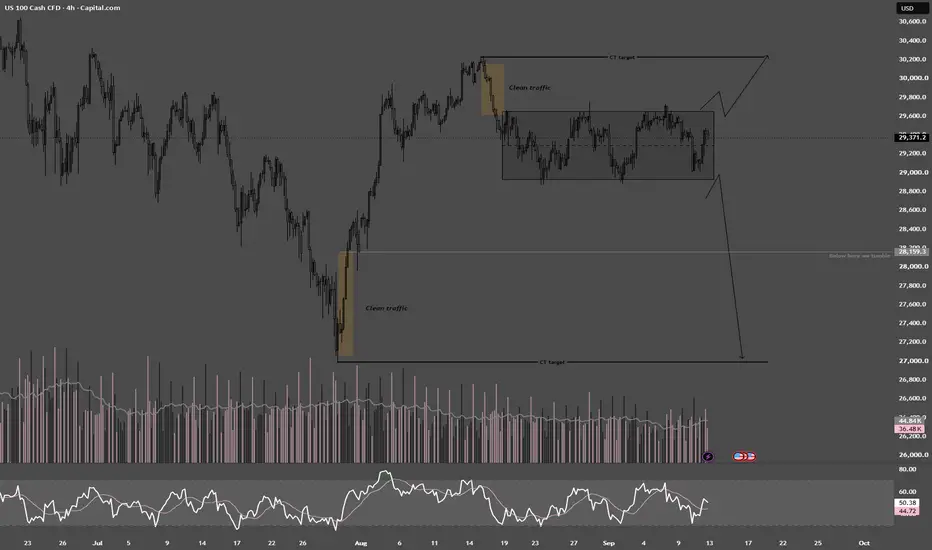
NAS Range Break?NQ is still trading within a range, and I’m expecting a strong move once we get a confirmed breakout.
On the upside, I’m watching 30,250 as the target.
On the downside, 28,200 is the first major level I’m watching. If that fails to hold, I’d be looking toward 27,000 next.
The interesting part is the clean traffic both above and below the current range. Once price breaks out, there isn’t much structure in the way, which could allow the move to accelerate pretty quickly.
What do you think? Like, comment, and follow! S&P 500 | Wave III: More Upside or a Major Pause?Reading time: about 2 minutes
This chart analyzes the long-term behavior of the S&P 500 through the lens of the Elliott Wave Principle.
In this count, the larger market advance from the 2009 low is viewed as an impulsive structure. The 2020 correction is labeled as Wave II, followed by the development of Wave III — a wave that often represents the strongest part of an impulsive sequence.
Bullish Scenario
In the bullish scenario, Wave III may not be complete yet, and its internal structure could continue developing toward Wave 5.
There is also a possibility of an Expanded Fifth Wave. As long as the bullish channel and the key confirmation levels on the chart remain intact, this scenario remains valid, with the potential for higher Fibonacci-based targets.
Conservative Scenario
The alternative scenario is that the market may need a corrective or sideways phase before continuing the larger trend.
This is where the Principle of Alternation becomes important. If the previous correction was sharp and deep, such as a Zigzag, the next correction may develop differently and take a more sideways form, such as a Flat, Triangle, Double Three, or Triple Three.
Therefore, a potential correction would not necessarily mean that the larger bullish trend has ended. The market may simply lose more time than price while completing its structure before the next major move.
In Elliott Wave analysis, the goal is not to predict the future with certainty. We follow the structure, define the scenarios, and let the market confirm which scenario is valid.
Analysis Name:
Mr. Nobody | Structure in Motion
Signature:
Patterns whisper… I listen.
S&P 500 Index
Jul 28
S&P 500: Third-Wave Expansion or a Deeper Correction?
 Long
Long
S&P 500: Key Support Zones Could Define the Next ReboundThe S&P 500 is still trading within a corrective structure, and the current 4-hour chart suggests that price may need to test lower support before a stronger recovery setup develops.
The first area I’m watching is around 7,599–7,583. This zone has already attracted a reaction and could become relevant again if price returns to it.
If that area fails to hold, attention shifts toward 7,560 and then the broader lower support zone around 7,520–7,498. The 7,498 level is especially important on this chart, as a stronger reaction from that area could create a more meaningful recovery structure.
On the upside, 7,725 is the first important resistance. Above that, the next major level is 7,763, while 7,823 remains the broader resistance ceiling.
Key Levels
Resistance: 7,725
Major Resistance: 7,763
Upper Resistance: 7,823
First Support: 7,599–7,583
Deeper Support: 7,560
Major Lower Support: 7,520–7,498
Scenario to Watch
A reaction from 7,599–7,583 could support a short-term rebound, but if price moves through that area without a convincing response, the deeper 7,560–7,498 zone becomes more important.
For now, I would avoid treating the current price as a confirmed reversal point. The cleaner setup may come only after price reaches one of these stronger support zones and shows clear evidence of demand.
Bias: Neutral to Bearish in the short term, with rebound potential from lower support. Short 
NASDAQ - Both ScenariosThe Nasdaq has created some very clean market structure on the daily timeframe. I have outlined the key lines to pay attention to, and I will lay out the price targets for both the bullish and bearish scenario.
Understanding the Chart
The first thing to note is the solid black lines. These represent the wick highs and the primary lows established throughout the current trend.
The dotted black lines are more focused on candle closes and represent more of a symmetrical triangle pattern, aside from the brief breakdown seen in late July.
The Bullish Scenario
For the upside scenario, I am watching for a breakout and confirmation candle above both the upper dotted black line and the upper solid black line. This would give a measured move breakout target of around $32,700.
The Bearish Scenario
For the breakdown scenario, I am watching for a daily candle close and confirmation below the lower dotted black trendline. If this plays out, I would be looking for a breakdown target around the 0.618 of the current trend, which would put price around $25,800.
What makes this particularly interesting is that the golden ratio target would align with the lower solid black trendline right around October 9, 2026, giving a double confluence of support at that level.
Since I also spend a lot of time on crypto analysis, it is worth noting that this date lines up closely with when Bitcoin's four year cycle bottom is projected to occur, around October 5, 2026.
So if some sort of black swan event or unexpected catalyst were to trigger a broader market selloff over the next couple of weeks, it would align remarkably well with a time-based liquidity bottom across multiple markets. I wanted to flag that connection as well.
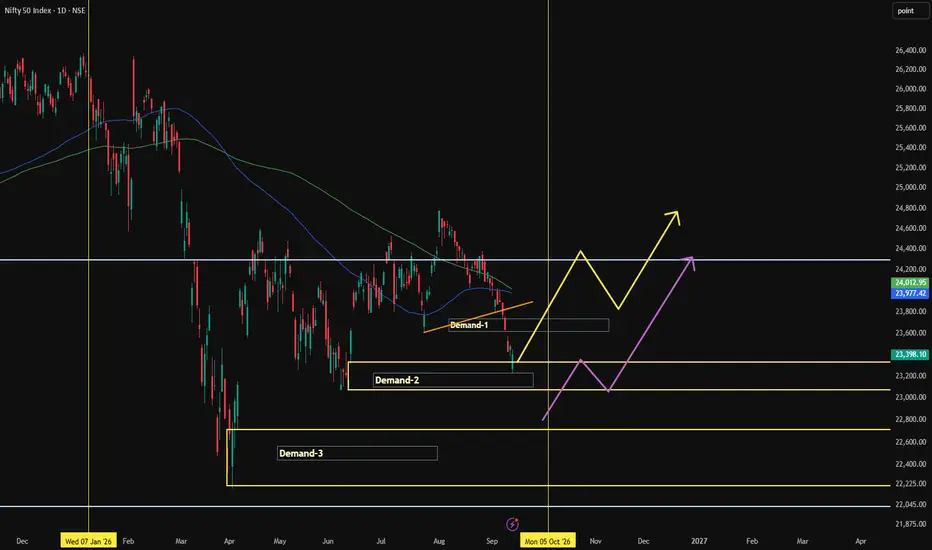
Either way, these dotted black trendlines are nearing the apex so a large move will occur very soon. WEEKLY MARKET OUTLOOK – THE BOUNCE OR BREAKDOWN? NIFTY 50 — 6th RED WEEK. NOW THE NEXT CANDLE MATTERS.
Wishing everyone a very happy Ganesh Chaturthi & Teej. Have a good one.
Nifty closed at 23,398, down nearly 500 points from the previous week's close.
Weekly High:23,890
Weekly Low: 23,231
Last week I had highlighted that the market was weak, but the weekly timeframe was still not aligned with the already-negative monthly & daily timeframes.
This week, that alignment has clearly moved closer.
My Range vs Actual Move
Last week's projected range: 24,300 – 23,400
Actual low: 23,231
The downside of my projected range was breached this week.
After many consecutive weeks of Nifty respecting the projected range, this is the first week where the range has been breached. That itself is an important change in market behaviour.
Now comes an interesting observation
This is the 6th consecutive week where Nifty has closed RED.
Historically, whenever such a sequence has occurred, the following week has often produced a green weekly candle.
That does NOT mean a green candle is guaranteed.
But if a green candle does appear next week, its High and Low become extremely important reference levels.
The setup
If a green candle forms:
🔻 Break of that candle's LOW
→ Pullback failure
→ Shorting opportunity can emerge
→ Next important support: 22,370–22,380
🔺 Break of that candle's HIGH
→ Short covering can accelerate
→ Market can move higher quickly
This is particularly important because traders who missed the initial decline may wait for a pullback before initiating shorts.
So rather than trying to guess the direction, I would let the pullback candle define the battlefield.
Personally, I'm also waiting for a green candle before initiating a trade.
Let's see if the market gives us one.
Nifty Levels
Expected Range: 23,800 – 22,900/23,000
Below pullback low: 22,370–22,380 becomes the next important support zone.
BANK NIFTY — SUPPORT UNDER PRESSURE
Bank Nifty closed at 56,606, down 763 points from the previous week.
It also breached my projected range of 58,400–56,300, making a low of 55,699 before recovering to close at 56,606.
55,850 is now important
As long as 55,850 holds, some stability can still emerge.
But a decisive move below 55,850 can open the gates towards:
**54,514 → 53,473 → 52,928 → 51,000**
For next week:
Expected Range:57,700 – 55,500
Bank Nifty remains the index I would watch closely for confirmation of any larger Nifty move.
S&P 500 — SUPPORT STILL HOLDING
S&P 500 closed at 7,656, down 62 points from the previous week's close.
The important positive point:
It once again took support around 7,580.
So, for now, the structure remains intact.
🔻 Downside
A weekly close below 7,580 can intensify selling pressure and bring:
7,394 → 7,208 → 6,954
🔺 Upside
For a stronger recovery, S&P 500 needs to sustain above 7,800.
Above that, the next levels are:
7,885 → 8,000 → 8,124
8,124 remains an important level to watch.
FINAL VIEW
The market has now entered an interesting zone.
Nifty has completed 6 consecutive red weekly candles, my projected range has finally been breached, and the higher-timeframe structure is becoming increasingly aligned on the bearish side.
But after such an extended sequence, a pullback/green candle cannot be ignored either.
Therefore, next week I don't want to predict the outcome.
I want to see which side of the next important candle breaks first.
Green candle low breaks → weakness continues.
Green candle high breaks → short covering can accelerate.
For now:
Wait for the market to show its hand.
Trade the levels, not the noise.
The market doesn't need to be predicted. It needs to be read.
DXY: Can Buyers Turn 98.55 Into a Dollar Rebound?Market Bias: A Bullish Reversal Still Needs Confirmation
📌The dollar is showing a reaction from the highlighted support around 98.548, and I’m watching for a bullish recovery. There is still work for buyers to do: the daily chart shows lower highs and bearish breaks of structure (BOS), meaning sellers have repeatedly pushed through earlier lows. This is an early reversal idea, with confirmation still needed.
Confirmation: Reclaim 99.70–99.90 and Hold the Retest
📌The key test is roughly 99.70–99.90, where the chart marks a filled fair value gap (FVG) before the latest decline. That area previously attracted selling. A strong daily close above it, followed by a retest that holds, would support a bullish change of character (CHoCH)—the first meaningful break of the recent bearish sequence.
Upside Targets: 101.079 First, Then Around 103.4
📌If that shift develops, 101.079 is the chart’s first upside target. Beyond it, the July highs around 101.50–101.60 are another hurdle and a potential buy-side liquidity area, where SMC traders look for stops above previous highs. Clearing those highs and holding above them would strengthen the case for the second projected target near 103.4. The arrow shows a possible path, not a timetable.
Invalidation: Losing 98.031 Cancels the Bullish Setup
📌A break below 98.548 would weaken the recovery case and bring 98.031 into focus. That lower level is the chart’s marked invalidation boundary; losing it would cancel this bullish setup.
Trade Management: Confirm the Currency Pair and Define Your Risk
📌For retail traders, use DXY as context and confirm the entry on the currency pair you actually trade. Keep the maximum loss defined before entering.
The SetupsFX_ Team
❤️  Long
Long
 Long
Long
Falling towards pullback support?S&P500 (US500) is falling towards the pivot, which has been identified as a pullback support that aligns with the 127.2% Fibonacci extension and could bounce towards the 1st resistance.
Pivot: 7,573.71
1st Support: 7,515.23
1st Resistance: 7,725.78
Disclaimer:
The opinions given above constitute general market commentary and do not constitute the opinion or advice of IC Markets or any form of personal or investment advice.
Any opinions, news, research, analyses, prices, other information, or links to third-party sites contained on this website are provided on an "as-is" basis, are intended to be informative only, and are not advice, a recommendation, research, a record of our trading prices, an offer of, or solicitation for, a transaction in any financial instrument and thus should not be treated as such. The information provided does not involve any specific investment objectives, financial situation, or needs of any specific person who may receive it. Please be aware that past performance is not a reliable indicator of future performance and/or results. Past performance or forward-looking scenarios based upon the reasonable beliefs of the third-party provider are not a guarantee of future performance. Actual results may differ materially from those anticipated in forward-looking or past performance statements. IC Markets makes no representation or warranty and assumes no liability as to the accuracy or completeness of the information provided, nor any loss arising from any investment based on a recommendation, forecast, or any information supplied by any third party.
Long 
Price nears key resistance?US Dollar Index (DXY) is rising towards the pivot, which is an overlap resistance and could reverse towards the 1st support level, which is an overlap support that aligns with the 145% Fibonacci extension.
Pivot: 99.55
1st Support: 97.98
1st Resistance: 100.48
Disclaimer:
The opinions given above constitute general market commentary and do not constitute the opinion or advice of IC Markets or any form of personal or investment advice.
Any opinions, news, research, analyses, prices, other information, or links to third-party sites contained on this website are provided on an "as-is" basis, are intended to be informative only, and are not advice, a recommendation, research, a record of our trading prices, an offer of, or solicitation for, a transaction in any financial instrument and thus should not be treated as such. The information provided does not involve any specific investment objectives, financial situation, or needs of any specific person who may receive it. Please be aware that past performance is not a reliable indicator of future performance and/or results. Past performance or forward-looking scenarios based upon the reasonable beliefs of the third-party provider are not a guarantee of future performance. Actual results may differ materially from those anticipated in forward-looking or past performance statements. IC Markets makes no representation or warranty and assumes no liability as to the accuracy or completeness of the information provided, nor any loss arising from any investment based on a recommendation, forecast, or any information supplied by any third party.
Short 
Long 
Short 
Short 
Short 
Long 
SPX: Another Leg Higher—or Time for a Pause?The S&P 500 has come a long way from its October 2022 low. But a strong trend does not make the next move inevitable. With SPX trading beneath its August peak, the next question is whether buyers can open the door to another advance—or whether the recent hesitation develops into a deeper correction.
The first checkpoint is 7,816.70. A daily close above that high would support the continuation case. Holding the area on a subsequent pullback would make the breakout more persuasive than a brief push through resistance.
The bigger picture starts on October 13, 2022. The working Elliott interpretation treats the advance into February 2025 as a possible first large wave, followed by the sharp correction into April. The recovery from there may belong to the next larger advance.
The chart follows this idea across three nested scales: Cycle for the broad context, Primary for the major swings, and Intermediate for selected internal moves. Several smaller subdivisions remain open. In particular, the early 2023 correction needs further evidence before it can be called a confirmed running flat. These are working labels, not a fully proven count.
The latest movement is equally important. A simple five-wave reading of the March–September 2026 rise runs into an overlap: September’s pullback entered the price territory of the June high. That prevents me from presenting that sequence as a completed standard impulse. The actual swings remain connected on the chart, while their internal interpretation stays unresolved.
This is where Elliott analysis can be useful: it gives us a way to organize the possibilities, but it also needs a clear point at which price can challenge the story. Adding more labels would not remove the uncertainty.
If SPX confirms the breakout, the next projected upside area is 8,426.77–8,484.15, rounded to 8,427–8,484 on the chart. That band combines a Fibonacci extension of the March–June swing with an equal-length projection of the April 2025–January 2026 advance. The measurements are related and depend on the working structure. Their proximity does not establish a probability or guarantee that price will reach the zone.
The alternative gains weight below 7,237.85. Losing that June low would put a deeper correction ahead of the immediate continuation case. The marked support band at 6,889.83–7,002.28 combines a 61.8% retracement of the March–August rise with January’s high. A failed breakout followed by renewed weakness would also argue for patience rather than assuming the uptrend has already resumed.
Below 6,316.91, the advance from March needs a new count. That would not erase the entire structure since 2022. It is also a structural reference, not automatically an appropriate stop for an individual trade.
Timing adds context, but little independent confirmation. For the main scenario, repeating the 296-calendar-day duration from April 7, 2025 to January 28, 2026 from the March 30 low points to January 20, 2027. The experimental window is January 6–February 3. For the correction alternative, repeating the 61-day January–March decline from August 13 points to October 13, with an October 6–20 window.
Other Fibonacci timing approaches were considered, but no meaningful independent cluster emerged. These windows are observation periods, not deadlines or entry signals. The intermediate bends in the projected paths are schematic.
For now, the most revealing development would be a breakout that can hold. Until then, both the opportunity above resistance and the risk below support deserve a place on the chart.
Daily SPCFD:SPX chart through September 11, 2026; close 7,656.98. Linear scale, levels in index points from this TradingView feed. Educational scenario analysis; the count remains provisional.