NAS100 - Short From Daily FVG, Midweek Odds Favor ContinuationBias: Bearish (short-term continuation within a ranging higher timeframe)
Higher timeframe context
Honest read first: the HTF picture is not cleanly bearish. NAS100 has been accumulating in a broad range for weeks rather than trending. But within that range, the current leg is clearly lower — a series of lower highs since the July rejection, and momentum is with the sellers. This is a continuation trade on the active leg, not a HTF trend call.
The setup
The Daily FVG at 29,369 - 29,481 is the only real point of interest above. Price is retracing into it now. I want the tap and rejection — that's the entry.
The statistical edge
From my own weekly range data on NAS100: midweek is historically the lowest-probability window for the weekly extreme to form. The high of a bearish week is far more likely already in from Monday-Tuesday. That means a midweek retrace into a premium FVG has good odds of being exactly that — a retrace, not a reversal. Stacked on the active leg down, that's the confluence.
Execution
Entry: Daily FVG (29,369 - 29,481)
Invalidation: 29,781 — a daily close above and the range trade flips, idea is dead
Target: Sell side liquidity at 28,202
Time horizon: Delivery expected into the end of this week
If the accumulation resolves upward before the target is hit, I step aside — the mixed HTF means this idea doesn't get extra chances.
Market indices
USTEC (NASDAQ) — BIG BEAR PATH TO DISCOUNT !Bias: SHORT
Price is failing to reclaim any of the internal highs (29,842 / 30,054 / 30,320), confirming that the recent structure has shifted bearish. The rejection from the breaker block (29,380–29,510) — sitting just below the 200EMA — was the key confirmation that sellers are back in control.
Why short:
- No reclaim of internal highs = bearish structure intact
- Breaker block held as resistance, not support
- Price is now trading below the 200EMA, reinforcing downside momentum
- Liquidity resting below (SSL) is the next natural draw
Targets (TP):
1. 28,544 — SSL (sell-side liquidity)
2. 28,186 — Major bull structure support
3. 26,790 — Discount target (final objective)
❌ INVALIDATION:
A confirmed reclaim of the breaker block, paired with a close back above at least one internal high, would signal a Market Structure Shift (MSS) back to bullish — invalidating this bearish outlook.
SUMMARY:
As long as price stays below the breaker/200EMA, the path of least resistance is down toward the discount zone, with liquidity sweeps likely along the way.
A reclaim of structure would flip this bias.
Trade Safe- Manage Your Risk
Kwagga.
NAS100 Buy Setup: Momentum Favors Higher PricesNASDAQ 100 is showing bullish momentum after holding above the 29500 support zone. Buyers remain in control, and a sustained move above this level could fuel further upside toward the 31500 target. Risk is managed with a stop loss at 29300 in case the bullish structure fails.
KEY LEVELS
Entry 29500
Target 31500
Stop Loss 29300
Nikkei Moves More Positive, Targeting ResistanceThe benchmark Nikkei 225 index IG:NIKKEI surged sharply by +2.0%, rocketing above the psychological level of 68,000, while the Topix index also strengthened by +0.4% to 4,022, effectively breaking a two-day losing streak following the mass capitulation earlier in the week.
Ignoring the tactical volatility of global markets following last night's FOMC meeting minutes, regional smart money immediately launched a massive buying blitz.
This bold move was fueled by evidence of extraordinary physical demand for AI infrastructure from New York, dampening negative sentiment surrounding Bain Capital's complete exit from the Japanese memory industry.
-----------------------------------------------------------------------------------------------------------
✅ SK Hynix's US Listing Draft Oversubscribed 7-fold
This is the key bullet that shattered scepticism about AI capex ROI concerns:
- Massive Validation of Western Liquidity: Official pre-listing documents confirm that South Korean memory giant SK Hynix's planned US listing (ADR) was more than seven times oversubscribed.
A massive wholesale buying spree hit the Japanese tech sector's leading capitalisation leaders this afternoon:
- Advantest Corporation ($6,857) Rampages Record +6.9%: The giant semiconductor chip test equipment maker led the charge, capitalising on the recovery in global hardware sentiment.
- Tokyo Electron ($8,035) & Murata Manufacturing ($6,981) Soar Together +4.0%: The chip and passive electronic component manufacturing giant was flooded with foreign capital, validating the ongoing quarterly technology cycle reversal.
- Fujikura Ltd ($5803) Jumps Resiliently +5.1%: The global fibre optic and copper cable producer cluster bounced back stiffly, recovering all of its losses last week after being corrected by the AI chip production brake.
Nifty strategy for 09-07-2026Nifty may open on slight positive note as per gift nifty around at 23920 levels in todays morning session. coming to yesterday nifty opened around at 24260 levels from here bears had taken charge pull back the nifty upto 23805 levels and finally closed around at 23882 with more than 500 points loss and formed a big red candle with small wicks on daily charts which is indicated nifty entered into short term correction due to west asia conflicts escalating in yesterday. I am expecting one more bearish day from today session so investors maintain strict stop losses in their trades.
Nifty trading levels :
short price : 23965
stop loss : 24040
1st target : 23885
2nd target : 23800
Disclaimer : I am not a SEBI Research Analyst please take advise from your financial advisor before take position based on my recommendation.
Thanking for your support if liked my content please suggest to your friends to follow my channel
Please drop a comment on whether my recommendation is useful and correct my mistakes
Nifty 50 AnalysisAfter a sharp decline of more than 500 points, Gift Nifty is indicating a positive opening.
However, this could simply be a short-covering rally rather than a confirmed trend reversal.
Resistance: 24,000 → 24,080 → 24,180
Support: 23,900 → 23,840 → 23,760
Bullish Scenario: A sustained move above 24,000 on the 15-minute chart may trigger a recovery towards 24,080–24,180.
Bearish Scenario: If Nifty fails to
hold above 24,000 and forms a bearish rejection, sellers may push the index back towards 23,900 and lower.
Trading Plan: Wait for the first 15-minute candle before taking a position. Let price action confirm the direction instead of predicting it.
Disclaimer: This analysis is for educational purposes only and is not investment advice.
US500: Hawkish Fed Meets AI Bulls at Key TrendlineThis week, the global financial market's attention is entirely focused on the fallout from the June FOMC meeting minutes and the sudden, historic shift in the Federal Reserve's communication strategy.
As traders, we must realize: this is a critical juncture for the S&P 500 ( TVC:SPX ). The index is currently consolidating around the 7,480 level. With a macroeconomic backdrop where inflation risks are resurfacing and the Fed is intentionally removing forward guidance, the US500 is facing a massive tug-of-war between strong tech fundamentals (AI demand) and looming hawkish policy threats.
Macro Previews: Warsh's "Hawkish Pause" Meets Reigniting Inflation Risks
From the newly released June FOMC minutes, the S&P 500 is digesting a highly complex fundamental landscape:
Inflation Fears Resurface: While the Fed unanimously kept rates unchanged at 3.50% - 3.75%, the minutes revealed that a "few" officials wanted to hike immediately in June. With May PCE hitting 4.1% (highest since April 2023) and Core PCE at 3.4%, inflation is showing broad, sticky price pressure.
The AI Double-Edged Sword: While strong AI demand supports tech valuations in the broader market, majority of Fed officials explicitly noted that this same AI demand, combined with high energy prices and tariffs, could force the Fed to tighten policy (hike rates) further.
The "Death" of Forward Guidance: Under new Chair Kevin Warsh, the Fed is drastically shortening statements and refusing to make pre-commitments. The market is now 100% data-dependent. This means every upcoming macroeconomic data release will trigger massive intraday volatility.
Deep Technical Analysis: US500 Consolidating Above Crucial Trendline Support
Under the dual forces of "AI optimism + Hawkish Fed risks," the US500 is currently in a tightening consolidation phase. Unfolding the Daily (1D) chart, the technical structure perfectly reflects a market waiting for the next catalyst:
1. Moving Average Convergence & Consolidation (GMMA Indicator):
The Guppy Multiple Moving Average (GMMA) shows a clear consolidation pattern. The short-term moving average group (yellow) has intertwined with the long-term moving average group (blue). The previous aggressive bullish momentum has paused, but the price remains supported near the longer-term baseline, indicating buyers are still defending the broader uptrend, though momentum is currently flat.
2. Key Support/Resistance & Trendline:
Through the chart, we can identify a clear defensive structure for both sides:
Ascending Trendline Support (White Dashed Line): Price is currently resting perfectly on this dynamic support line. A bounce here is absolutely crucial for the bulls to maintain the structural uptrend.
Immediate Support Zones: Located around the 7,456 and 7,374 horizontal levels. If the trendline breaks, these will act as the next major defensive walls.
Key Resistance (Top Dashed Line): Located around the 7,621 level. This is the immediate ceiling bulls need to shatter to resume price discovery mode.
Trading Strategy: How to Profit Amidst the "No Forward Guidance" Era Volatility?
With the Fed explicitly stating policy is data-dependent, the US500 will be highly reactive to the upcoming July 14 CPI release and Chair Warsh's congressional testimony.
1) Trend-Following Approach (Support Bounce): Buy the Dips
Long-Positioning: Since the price is resting right on the ascending trendline and near the 7,456 horizontal support, look for bullish rejection candles on lower timeframes (like 1H or 4H) to initiate long positions. If tech/AI strength persists despite Fed fears, riding the bounce back towards the upper GMMA cluster or the 7,621 resistance offers an excellent risk-to-reward ratio.
2) Breakout/Pullback Scenarios (Data-Driven after July 14):
Upside Continuation (Soft CPI): If the upcoming July 14 CPI shows inflation cooling, easing the "hawkish pause" fears, look for a solid daily candle closing above the current GMMA entanglement. A break above 7,621 will trigger the next major leg up.
Downside Correction (Hot CPI / Hawkish Testimony): If inflation data comes in hot or Warsh sounds overly aggressive regarding rate hikes, the US500 might decisively break below the white trendline and the 7,456 support. In this scenario, short positions can be taken targeting the deeper 7,374 level as a quick swing.
Next Focus: As traders in this new era, keep your position sizes strictly controlled and stop-losses tight as we approach July 14!
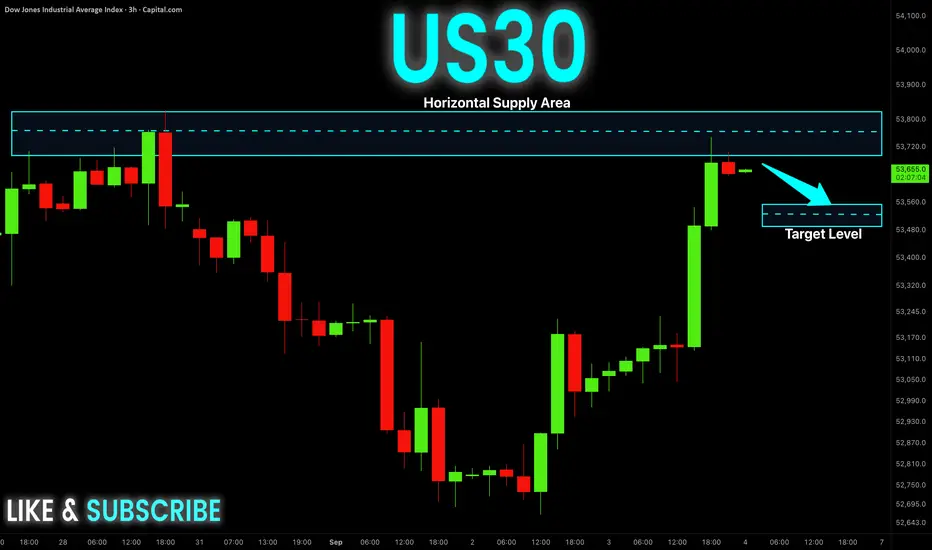
(US30) Dow Jones Industrial Average | Strong Demand ZoneI entered a buy from this zone today — a strong zone, despite the price coming close to and touching the stop-loss area just below the green box. I expect the index to strengthen by the end of this week, with a likely bounce from here. This could be invalidated in the event of negative geopolitical news or escalating tensions between the US and Iran.
⚠️ This is a personal market idea shared for educational/analytical purposes only. It is not financial advice. Always do your own research and manage your own risk.
DAX30 – Long Setup Analysis | By BahriDax30 - Analysis 1D Time Frime.
The DAX index has reached the demand zone I the price has reached the strong demand zone in 1D time frime, where I'm expecting the price to rise from this zone.
⚠️ This is a personal market idea shared for educational/analytical purposes only. It is not financial advice. Always do your own research and manage your own risk.
Compression at Range Low – Watch 7513 Reclaim or 7419 FailureThe daily chart is still in a range regime, not a confirmed trend. Price is compressing into a triangle after a strong rejection from the June swing high, while indicators continues to identify the market as Bullish Structure but currently in a Range Low location.
Bull Case
The first thing bulls need to accomplish is reclaim the confluence around 7513.
This level isn't just horizontal resistance—it aligns with:
Daily VWAP resistance
ATR +0.5 expansion
Previous rejection area
Current descending trendline
A convincing daily close above this zone would invalidate the current lower-high sequence and could open the path toward:
7620 (Monthly High)
ATR +1.5 expansion
Retest of the major swing high
Until then, every rally remains a test inside the range.
Bear Case
The indicators currently marks 7419 as the important support.
If sellers break this level with acceptance:
triangle support breaks
range low fails
momentum shifts toward lower liquidity
Downside objectives become:
Fib 61.8
ATR -1.5
Monthly Low near 7223
A rejection from 7513 followed by loss of 7419 would strengthen the bearish thesis considerably.
What I Like
The current structure isn't random.
Multiple independent factors are converging:
descending trendline
ascending support
VWAP resistance
ATR watch levels
Fibonacci retracement
Monthly reference levels
CVD divergence warning
When independent tools begin pointing to the same area, those zones become decision points rather than prediction points.
Trading Plan
I'm not interested in predicting the breakout.
Instead I'll wait for one of two confirmations:
🟢 Bullish
Daily close above 7513
Successful retest
Buyers defend the breakout
🔴 Bearish
Daily close below 7419
Failed reclaim
Sellers maintain acceptance below support
Anything between these two levels is simply range trading where patience generally has a better expectancy than forcing entries.
DXY Elliott Wave Analysis | USD Index Forecast |
Is the US Dollar Index (DXY) preparing for a major Wave C rally? 👀
My Elliott Wave + Smart Money Concept (SMC) analysis suggests DXY could be heading toward the 102–104 demand zone, increasing the probability of EUR/USD entering a bullish Wave 3.
⚠️ This is technical analysis, not financial advice. Always wait for confirmation and manage risk.
#Forex
SPX500: Bearish Drop to 7150?FX:SPX500 is eyeing a bearish reversal on the 4-hour chart , with price testing resistance after recent highs, converging with a potential entry zone that could trigger downside momentum if sellers defend amid volatility. This setup suggests a pullback opportunity in the uptrend, targeting lower support levels with approximately 1:3 risk-reward .🔥
Entry between 7475–7515 (entry from current price with proper risk management is recommended). Target at 7150 . Set a stop loss at a daily close above 7585 , yielding a risk-reward ratio of approximately 1:3 . Monitor for confirmation via a bearish candle close below entry with rising volume, leveraging the index's weakness near resistance.🌟
📝 Trade Setup
🎯 Entry (Short):
7475 – 7515
(Entry from current price is valid with proper risk & position sizing.)
🎯 Target:
• 7150
❌ Stop Loss:
• Daily close above 7585
⚖️ Risk-to-Reward:
• ~ 1:3
💡 Does SPX500 reject the 7475–7515 resistance zone and correct toward 7150, or will buyers break above resistance and extend the broader uptrend? 👇
S&P 500 fails to break out of indecisionOver the last few trading sessions, price variation around the SPX index has remained close to 0.3% on average. This has started to highlight more evident indecision in the chart’s movements, which for now do not show significant short-term trend strength.
In addition, after updates emerged about a possible reactivation of tensions between the United States and Iran, this catalyst could once again affect confidence in market demand. In this scenario, the lack of a clear recovery in the index could continue to highlight an important phase of indecision in S&P 500 movements over the next few trading sessions.
Sideways range remains consistent: For several weeks, average movements in the SPX have started to form an increasingly evident medium-term sideways range, with a ceiling near 7,600 points and a floor around 7,200 points.
So far, price has not managed to define a clear short-term direction. As long as a more relevant buying or selling bias does not appear on the chart, the current sideways range could remain the most important structure for the next few trading sessions.
RSI: The RSI indicator line continues to move consistently very close to the neutral 50 line. This suggests a balance in the average bullish and bearish impulses of the last 14 sessions.
For this reason, the indicator continues to point to a phase of indecision that could remain in place over the next few sessions if this behavior continues.
MACD: A similar scenario can be seen in the MACD histogram, which also maintains relevant movements around the neutral 0 line. This suggests a balance of strength in short-term moving averages.
This reading also reflects the importance of an increasingly evident neutral bias over the next few trading sessions.
Key levels to watch:
7,600 points – Main resistance: This zone corresponds to the historical highs of the SPX and currently acts as the most important bullish barrier to watch.
Price movements above this level could reactivate a buying bias and open room for a possible extension of the long bullish trend line, which remains the dominant long-term technical pattern.
7,400 points – Near-term barrier: This zone corresponds to a recent retracement, sits in the middle of the sideways range, and coincides with the barrier marked by the 50-period simple moving average.
If the SPX price remains too close to this level without managing to move clearly away from it, it could continue to reinforce an indecision scenario and keep the sideways range as the dominant pattern over the next few sessions.
7,200 points – Key support: This level corresponds to lows from previous weeks and coincides with an area near the 23.6% Fibonacci retracement of the most relevant move on the chart. For this reason, it represents the most important bearish barrier to watch.
Price movements below this level could reinforce more consistent selling pressure and open room for a relevant selling bias over the coming weeks.
Written by Julian Pineda, CFA, CMT – Market Analyst
Euro Stoxx 50 (STOXX50) LONG — 6H ALMA Setup (WR 76%)█ SETUP
ICMARKETS:STOXX50 · 6H · long only.
(Context: Euro Stoxx 50 — pan-European large-cap index, EUR beta.)
ALMA Averaging Strategy: ALMA 3 / σ2, SD band 2, min diff 4/3, 25% per bar, up to 4 adds, hard stop −10% from average entry.
Strategy Tester (STOXX50 6H):
Win rate 76% · profit factor 2.5 · max drawdown 18%
Avg win +3.8% · avg loss −2.8% · typical hold ~54×6H bars on winners — patient index mean-reversion grid
═
█ WHY NOW
Wednesday evening 6H bar — ALMA long fired 08 Jul 18:00 UTC on the ICMARKETS STOXX50 print ~ 6,234 .
First lot on a fresh cycle — snapshot ~ 6,214 (~−0.5% under fill, day-one index noise). Daily VWAP Support touch 08 Jul tags the same shelf ~ 6,216 .
Hard stop zone −10% from fill ~ 5,611 . Exits follow Pine ALMA flip + min diff or the hard stop.
█ MACRO
Asset: STOXX50 = Eurozone large-cap basket — ECB path, EUR, energy import costs, and global risk appetite move the index more than any single headline name.
Tape (8 Jul): Iran ceasefire breakdown lifted oil ~+5% and pushed euro-area yields higher on inflation fears; Northwest European gasoline margins compressed as crude jumped — European equities trade geo/oil beta, not a clean growth read.
Parallel book: a GER40 4H ALMA long opened earlier the same day on Germany cash — related Europe risk, **different** index and chart; this idea tracks STOXX50 6H only.
═
█ OUTLOOK
Positive factors
- 76% WR · PF 2.5 · avg win +3.8% vs avg loss −2.8% — positive skew on a deep 283-day 6H sample
- Fresh 6H entry inside the 24h publish window — first lot on the evening close, not a scale-in add
- ALMA — 4H: SHORT · S:7 vs SAvg 3.6 — OVERHEAT-S on the execution ladder; mean-reversion long frame at the fill bar
- EMA — 1H: Below · S:23 vs ~ 5.5-bar norm — fast index stretched ~1.0% under the hourly average; bounce setup on the 6H template
- SMC — 1W bull FVG raid ~6,413: bounce B 67% Br33% (n=63) — elevated weekly bounce skew on the euro50 inefficiency; supports grind if price works back toward the raid zone
- SMC — 1D FVG enter bull ~6,324: bounce B 56% Br44% (n=395) — mild daily bounce bias on the prior session cluster
- SMC — 4H FVG enter bull ~6,185: bounce B 56% Br44% (n=1520) — demand shelf under fill with bounce skew
- VWAP — chart touch: Support 08 Jul ~ 6,216 on the STOXX50 board — tags the same zone as snapshot ~6,214
Negative factors
- ALMA — slow board: 1W LONG · L:8 vs LAvg 4.4 — OVERHEAT-L on the weekly band; higher-TF long stretch conflicts with a fresh 6H long at a marginal pullback
- ALMA — fast ladder: 1H SHORT · 4H SHORT · 1D SHORT — execution and medium boards still short into the new 6H long
- EMA MTF — mixed stack: 1H–4H Below but 1D–1W Above on ~6,214 — fast indices under the rail while slow boards still hold above; not a clean discount reclaim
- First Bar Close: 1H below 1D EMA on the 08 Jul snapshot — fast ladder lost the daily line again
- SMC — 4H at fill ~6,236: FVG New Bear plus OB Breaker Bear bounce B45% · break Br 55% (n=130) — marginal break bias and new bear inefficiency at the entry print ; churn, not clean bid
- VWAP — active supports ~6,201 / 6,289: bounce B44% · break Br 56% (n=206) — elevated break through support ribbon vs bounce; conflicts with 6H long if the shelf fails
- TL AI — Rising Wedge (Contracting) GEO 06 Jul: bounce B54% · break Br46% (n=24) — flat pattern odds; index geometry not confirming a clean bounce setup
- Price action: Fractal High Formed on the STOXX50 board — local top risk into a flat fill
- Geo/oil gap risk on EU cash — −10% stop can slip on an energy headline open
- Single lot only — no scale-in discount yet
Takeaway: 4H ALMA OVERHEAT-S, hourly EMA stretch, and weekly bull FVG bounce skew support the 76% WR 6H long, but weekly OVERHEAT-L, VWAP Br56%, and 4H bear FVG at ~6,236 cap the first leg — probability layer says patient index grind at entry, not breakout chase toward ~6,413; nominal risk on −10% / Pine exit.
Base case: 6H ALMA holds ~6,180–6,280 · VWAP support shelf holds · slow work toward daily/weekly inefficiency zones ~6,324–6,413 if European risk appetite stabilizes.
Bear case: lose 6H ALMA · 4H bear FVG extends · VWAP support breaks Br56% · geo/oil gap on EU cash · −10% toward ~5,611 from ~6,234 entry.
Chart: ICMARKETS:STOXX50 6H — ALMA Averaging Strategy.
Educational idea. Live position — past backtest ≠ future results. NFA.
Market Update...Day 2Hey hey TradingView community!! Hope you are all doing amazing!!
OK so something I literally made the decision yesterday to do after my video post breaking down the Nasdaq 100 index, was to do a market update for the next 30 days for you all!!
So for the next month roughly I will be doing daily market breakdowns. I think right now we are in a time where this could help hopefully bring clarity & understanding to what the markets are doing and hopefully provide some value to you all on your current & future potential decisions in the market.
So I am going to break down price on the Nasdaq 100 for July 8th 2026! Enjoy!!!
(some of these days may be redundant or little change) but I will work to provide as many nuggets as possible for you all. here it is!!
Cheers!
Bank Nifty Index Intraday Technical Analysis for 9th July, 26NSE:BANKNIFTY
Nifty Bank Index (NSE) | Intraday Structure | July 9, 2026
Bank Nifty is trading around 56,826.80, stabilizing slightly above the 56,743 Zero Line after a steep vertical breakdown during the previous session. The sharp selloff mirrored weakness in the broader indices, forcing the banking sector through an aggressive liquidation cycle that sliced through several major support zones.
Price enters today's session locked in a tight, localized stabilization attempt right near its major inflection point. Sellers are trying to retain control underneath the key distribution blocks, while option writers build heavy exposure ahead of macro cues. Wait for a high-volume 15-minute candle close away from this boundary before committing capital.
Bullish Triggers
Long Entry: Above 57,493 (requires sustained acceptance above the 57,313 Add Long Pos. band).
Targets: 57,686 - 58,269
Risk Control: Structure weakens below 57,313. Hard exit below 56,984.
Bearish Triggers
Short Entry: Below 57,132 (strongly validated if price builds continuous acceptance under the 56,743 Zero Line).
Targets: 55,799 - 55,216
Risk Control: Cover immediately above 57,641. Bias protected below 56,999.
No-Trade Chop Zone: 56,984 - 57,493
Expect highly choppy, rotational price action within this block as institutional players and commercial desks clear out risk. Do not chase early morning whipsaws; let a clean 15-minute structural candle breakout provide true execution validation.
Execution Rule: Structure first, confirmation next. Zero anticipation.
Hit Boost and drop your view in the comments if you're tracking these levels today.
#BankNifty
Nifty50 Index Intraday Technical Analysis for 9th July, 26NSE:NIFTY
Nifty 50 Index (NSE) | Intraday Structure | July 9, 2026
Nifty is trading around 23,897.20, holding precariously right above the 23,882 Zero Line after a brutal, single-day broad-based selloff. A sharp spike in crude oil prices driven by Strait of Hormuz tensions and overnight weakness on Wall Street slammed the brakes on recent bullish momentum.
The index saw aggressive fresh short buildup into yesterday's close. Price is compressed tight at this critical floor; wait for a high-volume 15-minute candle to break away from this cluster to see if big money intends to run a deeper correction or stage a stabilization squeeze ahead of evening corporate earnings.
Bullish Triggers
Long Entry: Above 24,111 (requires sustained acceptance above the 24,053 Add Long band).
Targets: 24,188 | 24,377
Risk Control: Weakens below 24,053. Hard exit below 23,946.
Bearish Triggers
Short Entry: Below 23,994 (strongly validated if the 23,882 Zero Line fails early and flips to a distribution ceiling).
Targets: 23,576 | 23,387
Risk Control: Cover immediately above 24,159. Bias protected below 24,300.
⚠️ No-Trade Chop Zone: 23,946 – 24,111
Expect highly erratic, rotational price action within this zone as option writers aggressively manage exposure. Avoid chasing early morning whipsaws; let a clean 15-minute candle establish true structural intent.
Execution Rule: Structure first, confirmation next. Zero anticipation.
Hit Boost and drop your view in the comments if you're tracking these levels today.
#Nifty50
Bearish drop off?USD Dollar is reacting off the resistance level, which is a pullback resistance, and could drop from this level to our take-profit.
Entry: 100.89
Why we like it:
There is a pullback resistance level.
Stop loss: 101.47
Why we like it:
There is a pullback resistance level.
Take profit: 100.22
Why we like it:
There is a pullback support level.
Enjoying your TradingView experience? Review us!
Please be advised that the information presented on TradingView is provided to Vantage (‘Vantage Global Limited’, ‘we’) by a third-party provider (‘Everest Fortune Group’). Please be reminded that you are solely responsible for the trading decisions on your account. There is a very high degree of risk involved in trading. Any information and/or content is intended entirely for research, educational and informational purposes only and does not constitute investment or consultation advice or investment strategy. The information is not tailored to the investment needs of any specific person and therefore does not involve a consideration of any of the investment objectives, financial situation or needs of any viewer that may receive it. Kindly also note that past performance is not a reliable indicator of future results. Actual results may differ materially from those anticipated in forward-looking or past performance statements. We assume no liability as to the accuracy or completeness of any of the information and/or content provided herein and the Company cannot be held responsible for any omission, mistake nor for any loss or damage including without limitation to any loss of profit which may arise from reliance on any information supplied by Everest Fortune Group.
DOW JONES 4-year Channel Up calls for a 1W MA100 correction.Dow Jones (DJIA) has been trading within a 4-year Channel Up whose top (Higher Highs trend-line) hit last week. This week's red 1W candle may not be as surprising technically as the last time the index hit that Higher Highs trend-line (February 09 2026), a -11.29% Bearish Leg (U.S. - Iran War) was initiated that breached the 1W MA50 (blue trend-line) before rebounding.
That was the 2nd strongest correction within this pattern after the -19.09% of February - March 2025 (U.S. - China Trade War) that breached below the 1W MA100 (green trend-line) and even almost hit the 1W MA200 (orange trend-line).
At the same time, last week's 1W RSI got overbought (above 70.00) for the first time since November 25 2024. 2 out of 4 such overbought rejections initiated corrections.
Given the fact that the 1W MA100 has been untested for over 1 year, we expect the current rejection to be the one that tests it and if it repeats the most recent -11.29% correction, it can hit it at 47300.
If the 1W RSI hits its 4-year Support Zone first though, Dow will become a buy opportunity again regardless of the target price.
---
** Please LIKE 👍, FOLLOW ✅, SHARE 🙌 and COMMENT ✍ if you enjoy this idea! Also share your ideas and charts in the comments section below! This is best way to keep it relevant, support us, keep the content here free and allow the idea to reach as many people as possible. **
---
💸💸💸💸💸💸
👇 👇 👇 👇 👇 👇